-Band Red Clump Distance to the Large Magellanic Cloud
Abstract
The Hipparcos -band calibration of horizontal-branch red clump giants as standard candles has lead to controversial results for the distance to the Large Magellanic Cloud (LMC). In an attempt to properly ascertain the corrections for interstellar extinction and clump age and metallicity, we analyze new multi-wavelength luminosity functions of the LMC red clump. Our photometry dataset in the -band was obtained with the SOFI infrared imager at the European Southern Observatory’s New Technology Telescope. In the and passbands, we employ data from WFPC2 onboard the Hubble Space Telescope . The LMC red clump is first identified in a , color-magnitude diagram. Our luminosity functions yield apparent magnitudes of = 16.974, = 18.206, and = 19.233 ( ; random and systematic error, respectively). Compared directly to the Hipparcos red clump calibration (without a correction for age and metallicity), the LMC clump measurements imply a negative interstellar reddening correction. This unphysical result indicates a population difference between clumps. A modified calibration based on theoretical modeling yields an average reddening correction of , and a true LMC distance modulus of . We reconcile our result with the short distance previously derived from OGLE II red clump data.
1 Introduction
The Hipparcos satellite mission yielded parallax measurements for hundreds of nearby red clump stars, and these are, collectively, the best calibrated standard candle (Paczyński & Stanek 1998; Paczyński 2001). However, attempts to use the Hipparcos -band red clump calibration to determine the distance to the Large Magellanic Cloud (LMC) have lead to controversial results. Udalski et al. (1998) obtained (random and systematic error, respectively), which was subsequently revised upward to (Udalski 2000). Stanek, Zaritsky and Harris (1998) found . However, Zaritsky (1999) showed that the reddening correction used by Stanek et al. (1998) was overestimated. Romaniello et al. (2000) found by analyzing Hubble Space Telescope (HST ) photometry of the LMC red clump. Girardi and Salaris (2001) review these measurements, and apply new model corrections for population effects (i.e. age and metallicity). They find a population correction in the -band of 0.2 mag. Consequently, they revise the Udalski (2000) result to , and the Zaritsky (1999) and Romaniello et al. (2000) result to .
Alves (2000) demonstrated the use of the red clump as a standard candle at longer wavelengths; he calibrated the Hipparcos red clump absolute magnitude in the -band, and applied the calibration to the Galactic bulge red clump. One advantage of working in this 2 passband is the particularly small effect of extinction by interstellar dust (e.g. Schlegel et al. 1998). Grocholski and Sarajedini (2002) recently studied population effects on the red clump’s -band absolute magnitude by compiling 2MASS photometry of open clusters. They concluded that is, in general, also less sensitive to population effects than . The red clump models of Girardi and Salaris (2001) were also shown to be in fair agreement with the -band open cluster data. In this Letter , we present a deep -band luminosity function for red clump stars in the LMC bar and inner-disk. We also construct a , color-magnitude diagram, and complementary and luminosity functions. This is a first reconnaissance of optical and near-infrared photometry of the LMC red clump.
2 Data
The 6 lines-of-sight studied in this paper are centered on the source stars of LMC microlensing events discovered by the MACHO Project (Alcock et al. 2001; events 4, 7, 9, 12, 14, and 18). For our purposes, the lines-of-sight were selected at random by the natural occurrence of microlensing111Actually, event 12 may be a supernova in a galaxy behind the LMC, but this distinction does not affect the current work.. The 6-field average line-of-sight intersects the LMC disk at = 05:25:55.2 and = 70:20:24 (J2000). This is from the center of the LMC, nearly perpendicular to the line-of-nodes, and on the far side of the inclined disk (van der Marel et al. 2002). The geometric correction is small, about 0.6% in distance (0.013 mag), and in the sense that our clump giants are farther away than those at the LMC center.
The -band dataset analyzed here was obtained with the SOFI infrared imager at the European Southern Observatory’s New Technology Telescope; it is a 10241024 array with a pixel size of 0′′.292. The total field-of-view of our trimmed (equal-exposure) images after coadding individual dithered frames is about 140 . The photometry was derived with DAOPHOT II (Stetson 1994), and calibrated with observations of 6 standard stars (Persson et al. 1998). Conditions were photometric (Rejkuba et al. 2001). The 1- standard deviation of the calibration solution is 0.028 mag. Over 98% of the stars in the red clump (or brighter; ) were detected with a signal-to-noise 10, and thus our SOFI red clump data are nearly complete. The mag system employed (“K-short”) is the same as 2MASS. In order to check our standardized zero point, we matched a subset of the SOFI data with 2MASS second incremental release photometry222http://www.ipac.caltech.edu/2mass/.. A comparison shows no zero-point difference to within 0.02 mag (for stars with colors like the red clump). However, all of the stars in the comparison are actually redder and brighter than the clump, and thus the agreement found lends only weak support to the accuracy of our data. Finally, magnitudes are related to the -band red clump data compiled by Alves (2000) by (Grocholski & Sarajedini 2002; their Eqn. 2). We transform to accordingly.
Our dataset in and was obtained with WFPC2 onboard the HST (PI: Cook). We exclude the PC2 images from our analysis. This guarantees a homogeneous and photometry dataset, and represents only a small loss in imaged area. The 3 WFs are 800800 pixel arrays with a pixel size of 0′′.1. The resulting total field-of-view is approximately 32 . The HST /WF instrumental F555W and F814W magnitudes were derived with DAOPHOT II, and calibrated to Landolt’s and with an accuracy of 0.02–0.03 mag following the usual procedures (Alcock et al. 2001). Nearly all of the LMC clump giants were detected with very high signal-to-noise. In order to check our and zero points, we cross-correlated a subset of our data with OGLE II ground-based photometry333http://sirius.astrouw.edu.pl/ogle/. (Udalski et al. 2000). A comparison reveals zero-point differences of and mag in the sense that OGLE II is brighter. Alcock et al. (1999) compared MACHO ground-based photometry with an early reduction of these same standardized HST /WF data (a different subset), and found that MACHO was brighter by and mag. We speculate that the aperture corrections applied to the OGLE II and MACHO ground-based data may be affected at the 5-10% level by crowding errors. For example, it is possible that the -band “sky” around bright stars used to determine the aperture corrections was on average underestimated because nearby neighbor stars were oversubtracted (Alcock et al. 1999; Udalski et al. 2000). We tentatively adopt a formal systematic calibration error of 0.02 mag in and based on the stated accuracy of HST /WF calibrations.
3 Analysis and Results
We detected approximately 36,000 stars in and 109,000 stars in and . Of these approximately 27,000 have , and 7,000 have . Cross-correlating these latter source lists yields 4745 stars with , , and mags. Figure 1 shows the resulting , color-magnitude diagram (CMD) in the region around the red clump. Only 2353 stars appear within the limits of Fig. 1, and we restrict our subsequent analyses to these stars. As discussed by Alves (2000; and refs. therein), not all of the stars appearing in Fig. 1 are bona fide red clump giants. The first-ascent red giant branch (RGB) is identified as the roughly vertical sequence running from 2.2 at to 3.1 at . It has a width of about 0.2 mag in color, and no distinct component branches are evident. Some of these stars are second-ascent asymptotic giant branch (AGB) stars. The distinction between an RGB and AGB star is not necessarily clear in a CMD of mixed-age field populations like this one. The sought-after horizontal branch red clump is the most prominent feature in Fig. 1. It appears at and lies mostly blueward of the giant branch, i.e. . The detailed structure of the clump seen here is well understood in the context of stellar evolution theory (Girardi & Salaris 2001). The overdensity of stars with and colors that associate them with the giant branch (i.e. to 2.5) may be the first detection of the “RGB bump” for LMC field stars (see Fig. 19 of Girardi & Salaris 2001). The RGB bump is an evolutionary pause as the hydrogen-burning shell crosses a chemical composition discontinuity. The loose clustering of stars seen on the giant branch at and may be the “AGB bump,” an evolutionary pause at the onset of helium shell burning (e.g., see Alves & Sarajedini 1999).
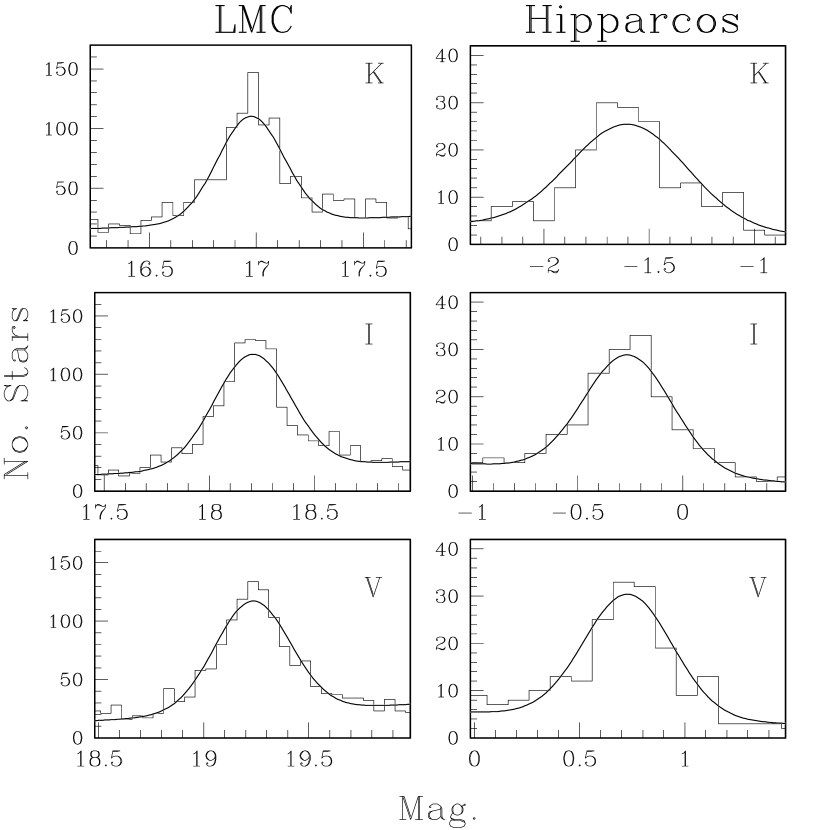
A side-by-side comparison of red clump luminosity functions (LFs) is presented in Figure 2. The LMC clump is shown on the left. The Hipparcos clump is shown on the right (data from Alves 2000). The LFs in , , and are each plotted in separate panels (top to bottom). LMC bin size is 0.05 mag; Hipparcos bin size is 0.10 mag; each panel is 1.5 mag wide. The adopted model LFs (solid lines in Fig. 2) are a superposition of a linear background and a Gaussian of variable width, amplitude, and location. The backgrounds are fit in restricted magnitude ranges which exclude the clump. The best-fit model parameters and (per d.o.f.) are provided in Table 1. The LMC red clump in Fig. 2 totals about 2000 stars. For comparison, there are 238 Hipparcos red clump stars with , , and data (Alves 2000). This distinction reflects in the formal statistical errors for the peak clump brightnesses given in Table 1. Despite the shortcomings of our model LFs revealed in Fig. 2, the peak brightnesses of the red clumps are evidently well determined.
The Hipparcos calibration assumes no reddening correction, as suggested by Stanek and Garnavich (1998). These authors argue that the average reddening is probably mag. It should be kept in mind that the LMC distance derived in this work is practically independent of the reddening correction applied to the Hipparcos clump. However, the average LMC reddening obtained in comparison may be slightly underestimated. We note that the Lutz-Kelker correction to the Alves (2000) calibration dataset is probably also negligible (Udalski 2000). The true LMC distance modulus is therefore given by:
| (1) |
where corresponds to either , , or , and the apparent distance moduli in each passband are . The corrections for population effects are (LMC) following the convention of Girardi and Salaris (2001). These corrections, the inverse effective wavelengths of each passband (), and the adopted reddening law (; Schlegel et al. 1998) are all summarized in Table 1. The results of this work are insensitive to small uncertainties in the reddening law or effective wavelengths employed. Although omitted from Eqn. 1, we also apply a geometric correction to our final distance estimate (see below).
We first compare the LMC and Hipparcos red clumps by assuming = 0. The resulting apparent distance moduli are plotted as a function of inverse effective wavelength in Figure 3 (open circles; error bars omitted), and listed in Table 1. A fit for the average interstellar reddening and true LMC distance modulus yields = and = 18.562 , which is shown as the dotted line in Fig. 2. A negative reddening correction is unphysical, and indicates a significant population difference between the LMC and Hipparcos red clumps. In order to account for the population difference, we appeal to the theoretical calculations of Girardi and Salaris (2001). These authors generated artificial LMC and Hipparcos red clumps from a grid of core helium-burning stellar models. Each clump refers to specific star formation and chemical enrichment histories reported in the literature, and is thus constrained at least indirectly by observational data. Possible systematic errors associated with the zero-points of the theoretical models would cancel in the first order approximation, because the population corrections are calculated only in a relative sense. This calculation predicts mag (§1). In a private communication (L. Girardi & M. Salaris 2002), the same artificial clumps yield population corrections of and (Table 1). The -band absolute magnitude has the smallest correction, in agreement with the trend noted by Grocholski and Sarajedini (2002). The resulting modified apparent distance moduli are plotted in Fig. 3 (solid circles with error bars), and listed in Table 1. Solving for the reddening and true distance modulus yields = 0.089 and = 18.506 (solid line in Fig. 3). The excellent fit of the red clump data in Fig. 3 lends indirect support to the photometric zero-points adopted in this work. Applying a small correction for the inclination of the LMC disk and the location of our fields (§2), the true LMC distance modulus is = 18.493 .
4 Conclusion
We have presented new multi-wavelength luminosity functions of LMC red clump stars. Our analysis yields a distance modulus of . The -band red clump distance to the LMC is 49.96 0.77 kpc in good agreement with the average published value (50.1 kpc; Freedman et al. 2001). We have also derived an average reddening of = 0.089 . For comparison, the Galactic foreground reddening in this direction is (Oestreicher et al. 1995). Our mean reddening result is consistent with the foreground reddening, and this is a success of the Girardi and Salaris (2001) models.
The statistical error associated with our new distance result is due to the Hipparcos calibration (3%), and measuring the LMC red clump brightnesses (1%). The overall systematic error may be comparable. Our photometry is standardized with a 2% systematic uncertainty. This error is also uncorrelated between and or . However, our zero-point checks do not support this level of photometric accuracy unless ground-based comparison data are in some cases too bright by up to 0.1 mag. We have suggested that this may be possible. Uncertainties in our reddening and geometric corrections contribute negligible systematic error to the distance result. The systematic error due to the population correction is probably also small. The worst case of making no correction at all leads to a change in modulus of less than 6%. However, this also yields a negative reddening correction. For realistic reddenings, the population correction to the true distance modulus is approximately the same as the correction in the -band (3%). In summary, the systematic errors in our -band red clump distance to the LMC are probably of order 2% (photometric calibration) and 3% (population correction), and thus comparable to the statistical error obtained.
The -band red clump distance to the LMC is in agreement with previously reported -band results (§1). The only serious discrepancy is the short distance result of Udalski (2000) based on OGLE II data. Udalski (2000) finds a mean dereddened red clump brightness of for 9 fields in the LMC halo. Those fields are on average from the center of the LMC, nearly perpendicular to the line-of-nodes, and on the near side of the inclined disk (van der Marel et al. 2002). Correcting for the 0.02 mag zero-point offset between OGLE II and our HST /WF data, and for geometric projection, the Udalski (2000) red clump brightness becomes mag (at LMC center). For comparison, our dereddened red clump brightness (Table 1) corrected to the LMC center is mag. The results of this work, Udalski (2000), and Romaniello et al. (2000) therefore all agree, which lends strong support to the accuracy of the -band red clump distance to the LMC.
References
- (1)
- (2) Alcock, C. et al. 1999, PASP, 111, 1539
- (3) Alcock, C. et al. 2001, ApJ, 552, 582
- (4) Alves, D.R. 2000, ApJ, 539, 732
- (5) Alves, D.R. & Sarajedini, A. 1999, ApJ, 511, 225
- (6) Freedman, W. et al. 2001, ApJ, 553, 47
- (7) Girardi, L., & Salaris, M. 2001 MNRAS, 323, 109
- (8) Grocholski, A., & Sarajedini, A. 2002, astroph/0112251
- (9) Oestreicher, M.O., Gochermann, J., & Schmidt-Kaler, T. 1995, A&AS, 112, 495
- (10) Paczyński, B. & Stanek, K.Z. 1998, ApJ, 494, L219
- (11) Paczyński, B. 2001, Acta Astronomica, 51, 81
- (12) Persson, S.E., Murphy, D.C., Krzeminski, W., Roth, M., & Rieke, M.J. 1998, AJ, 116, 2475
- (13) Rejkuba, M., Minniti, D., Silva, D.R. & Bedding, T. 2001, A&A, 379, 781
- (14) Romaniello, M., Salaris, M., Cassis, S., & Panagia, N. 2000, ApJ, 530, 738
- (15) Schlegel, D.J., Finkbeiner, D.P., & Davis, M. 1998, ApJ, 500, 525
- (16) Stanek, K.Z., Garnavich, P.M. 1998, ApJ, 503, L131
- (17) Stanek, K.Z., Zaritsky, D., & Harris, J. 1998, ApJ, 500, L141
- (18) Stetson, P. 1994, PASP, 106, 250
- (19) Udalski, A., Szymanski, M., Kubiak,M., Pietrzynski, G., Wozniak, P., & Zebrun, K. 1998 , Acta Astronomica, 48, 1
- (20) Udalski, A. et al. 2000, Acta Astronomica, 50, 307
- (21) Udalski, A. 2000, ApJ, 531, L25
- (22) van der Marel, R., Alves, D.R., Hardy, E., & Suntzeff, N. 2002, astroph/0205161
- (23) Zaritsky, D. 1999, AJ, 118, 2824
- (24)
| Quantity | |||
|---|---|---|---|
| () | 0.48 | 1.24 | 1.81 |
| AAAdopted reddening law from Schlegel et al. (1998), which refers to the effective wavelength of each passband. | 0.35 | 1.96 | 3.24 |
| BBPeak brightness and width of the LMC clump, followed by per d.o.f. of the best-fit model luminosity function. | |||
| 0.155 | 0.182 | 0.180 | |
| 2.2 | 2.1 | 1.6 | |
| CCPeak brightness and width of the Hipparcos clump (data from Alves 2000), followed by per d.o.f. of the best-fit model luminosity function. The LMC apparent distance moduli based on this calibration are given on the next line (see text). | |||
| 0.28 | 0.21 | 0.21 | |
| 1.4 | 0.9 | 1.7 | |
| 18.57 | 18.47 | 18.50 | |
| DDThe population correction for the LMC red clump absolute magnitude calculated from theoretical models (Girardi & Salaris 2001). The modified Hipparcos calibration is given on the next line, followed by the resulting LMC apparent distance moduli. | 0.03 | 0.20 | 0.30 |