Molecular Gas and the Young Starburst in NGC 5253, Revisited
Abstract
We report the detection of CO(2-1) and 3.1 mm and 1.3 mm continuum emission towards the extremely young starburst in NGC 5253, with data taken from the Owens Valley Millimeter Array. Faint CO emission originates in five molecular clouds distributed along the prominent dust lane seen in visual images. With the gas, the morphology of NGC 5253 looks much like a dwarf elliptical version of the “dust-lane ellipticals” or “polar-ring” class of galaxies. The molecular gas resides in GMCs well away from the radio-IR super-star cluster/supernebula seen in the radio and infrared. The millimeter continuum data confirm that the 2 cm flux from the supernebula is optically thick; the Lyman continuum rate derived from the 1.3 mm continuum is N for the central . CO may underestimate the true molecular column density, as expected for a low metallicity system, although there are regions along the dust lane that appear to have near-Galactic conversion factors. We estimate a total molecular gas mass of . The molecular gas in the dust lane is falling into the galaxy, supporting an accretion hypothesis. The dust lane gas cannot therefore be causally associated with the current burst of star formation. A relatively small amount, , of molecular gas is associated with the current starburst. We estimate a star formation efficiency of at least 25 % and more likely 75 %, consistent with the formation of a bound cluster. Despite the extreme youth of the starburst, the specific trigger of the starburst remains elusive, although the infall of gas in the dust lane suggests that there is more star formation to come in NGC 5253.
1 Introduction
Star formation in dwarf galaxies can be as intense or more so, in terms of stars per unit mass, than those seen in large spirals, but occurs without the familiar triggering mechanisms provided by dynamical features such as spiral arms or bars (eg., Beck, 2000). High resolution observations in the optical/UV and NIR indicate that the dominant mode of star formation in nearby starbursts is through massive clusters (eg., Whitmore & Schweizer, 1995; O’Connell, Gallagher & Hunter, 1994). Observational and theoretical evidence suggests that tidal interaction/merger events may be an important triggering mechanism for (see Whitmore, 2001, for a recent review), but the nature of the triggering in isolated dwarfs is not well understood. Because their metallicities are low, dwarf galaxies may present galactic conditions more like those seen during the first epoch of star and cluster formation in the early universe. NGC 5253 is an excellent example of such a galaxy.
NGC 5253 is a nearby (3.8 Mpc; Caldwell & Phillips, 1989; Saha et al., 1995; Gibson et al., 2000, Sakai 2001, private comm.), dwarf starburst galaxy that may be a companion to M83. Its star formation is particularly extreme and dramatic. The central region of NGC 5253 contains several “super-star clusters” of -10 to -11 (Meurer et al., 1995; Gorjian, 1996; Beck et al., 1996; Calzetti et al., 1997; Turner, Beck & Ho, 2000), with L L⊙, or two orders of magnitude larger than any individual Galactic star forming regions (eg., Gorjian, Turner & Beck, 2001). Strong Br emission, weak CO bandhead, bright Wolf-Rayet features and a radio spectrum consistent with being entirely thermal demonstrate that this burst of super star cluster (SSC) formation must be very young (Campbell, Terlevich & Melnick, 1986; Reike, Lebofsky & Walker, 1988; Conti, 1991; Beck et al., 1996; Turner, Ho & Beck, 1998). Models of the stellar population based on optical colors indicate that the youngest optical/UV clusters have ages of 2.5 Myr up to 50 Myrs (eg.; Calzetti et al., 1997; Tremonti et al., 2001). Radio and infrared observations find an even younger, more obscured super star-cluster (Turner, Ho & Beck, 1998; Turner, Beck & Ho, 2000; Gorjian, Turner & Beck, 2001). The starburst in NGC 5253 is extremely young, possibly the youngest yet observed (Reike, Lebofsky & Walker, 1988; Turner, Beck & Ho, 2000; Gorjian, Turner & Beck, 2001). The molecular gas distribution from which this young burst originated should still be evident.
Turner, Beck & Hurt (1997) observed NGC 5253 in CO(1-0) with the Owens Valley Millimeter Interferometer (OVRO), and managed a tentative (5-7) detection of CO with resolution. Although the CO detection is tentative it lines up with the visible dust lane. The CO emission is extremely weak considering the amount of star formation present. It is two orders of magnitude weaker than its neighboring spiral galaxy, M 83, which has a starburst of similar luminosity (Turner, Hurt & Kenny 2002, in preparation; Crosthwaite et al., 2002). The ratio of free-free luminosity to inferred molecular mass in NGC 5253 is , as compared to 10 - 20 in nearby, actively star-forming spirals. Turner, Beck & Hurt (1997) argued, on the basis of the CO(1-0) morphology, that a cloud of gas, possibly with ultra-low metallicity, is accreting onto the galaxy and has triggered the starburst.
To confirm the CO detection and to further investigate the nature of the molecular gas and its connection to the starburst in NGC 5253, we have obtain higher sensitivity and resolution observations of the J=2-1 transition of CO with OVRO.
2 Observations and Data Reduction
Aperture synthesis observations of the CO(2-1) transition (230.538 GHz) were made with the Owens Valley Radio Observatory (OVRO) Millimeter Interferometer between 16 November 1996 and 21 December 1997 (Table 1). The interferometer consists of six 10.4m antennas with cooled SIS receivers (Padin et al., 1991; Scoville et al., 1994). System temperatures (single sideband) ranged from 700 - 2200 K. A 64 channel, 2 MHz filterbank was used giving a velocity resolution of 2.6 km s-1, which corresponds to an overall bandwidth of 166 km s-1. To increase the signal-to-noise, the data were smoothed to 4 MHz resolution. Channel 32.5 is centered at = 410 km s-1. Separate simultaneous 1 GHz bandwidth continuum observations at 97 GHz (3.1 mm) and 233 GHz (1.3 mm) were obtained. Two pointings with phase centers of (B1950) = 13:37:04.80; (B1950) = -31:22:58.0, (B1950) = 13:37:05.60; (B1950) = -31:23:22.0, were observed to cover the nuclear starburst and dust lane. Phase calibration was done by observing quasars, 1244-255 and 1334-127, every 20-30 minutes. For absolute flux calibration we used Neptune as primary flux calibrator and 3C273 as a secondary flux calibrator. Absolute fluxes are good to 25% - 30% for the 1 mm data and 15% for the 3 mm data, with uncertainties due to brightness variations in the calibrators and elevation effects at this low declination.
The dataset was mosaicked using MIRIAD software. The maps are robustly-weighted and corrected for primary-beam attenuation. Since the maps are mosaics, the noise level varies across the maps. Reported noise levels for this paper are those measured from line free regions of the map half-way between the map center and the edge (FWHM of the primary beam). The noise level is a bit lower than this in the center and somewhat higher toward the edges of the map. All further data reduction was done using the NRAO AIPS package. To generate an integrated intensity map (ICO) velocities were integrated from 350 km s-1 to 450 km s-1. Only emission greater than 1 in the channel maps was included in ICO to minimize the effect of summing noise. For the faint, narrow lines in NGC 5253, it is possible that this prceedure might clip out a small amount of real emission. However, we tested different clip levels and found that for different clip levels neither the morphology on the intensity varied more then the given noise level.
Tracks in Equatorial (E) and Low (L) configurations were used to make up the dataset. In the resolution setting configuration (E) one antenna along the E-W arm of the array was down, making this configuration almost entirely N-S. This gives the 1 mm beam an E-W extension not typically seen for such low declination sources. The (u,v) coverage for these observations implies that emission on scales larger than 20 is resolved out. Given the small field of view at 230 GHz and the differences in pointing centers between our data and single-dish CO(2-1) data (Meier et al., 2001), it is difficult to quantify exactly how much flux is resolved out. A single-dish peak main-beam temperature of 34 mK (1.3 Jy for the 30 beam) was detected for CO(2-1). We estimate the flux resolved out in two ways. Firstly, the flux in the channel maps were summed over the single-dish beam area. A peak flux of 1.4 Jy was obtained, consistent with detecting all the emission. Secondly, we convolved the observed maps to a resolution of 30 and compared it to the single-dish data. Only a 0.65 Jy peak was detected, in this method, suggesting 50% of the flux is resolved out. Therefore, we estimate that towards the localized peaks most of the flux is detected, but that we probably resolve out some widespread diffuse emission.
3 Results
3.1 The Molecular Gas Morphology
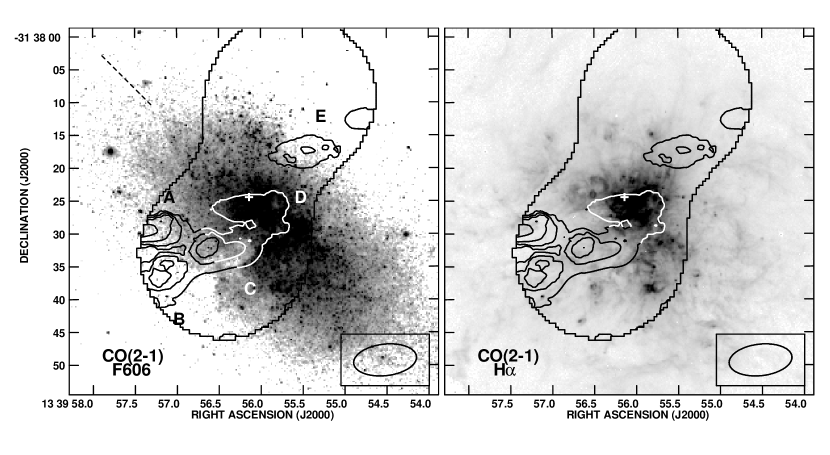
Figure 1 displays the CO(2-1) integrated intensity overlaid on the HST V-band and H images of NGC 5253 (Calzetti et al., 1997). Molecular gas is largely confined to the prominent dust lane that stretches across the minor axis of the galaxy, confirming the results of Turner, Beck & Hurt (1997). In the field-of-view of these observations, no evidence is seen for a “disk” of CO emission oriented along the major axis of the galaxy, though it is possible that weak extended emission has been resolved out if it is smooth on 20 scales. Very little molecular gas is detected towards the central super-star cluster/radio “supernebula.” The rms noise level of 0.6 K km s-1 corresponds to a column density of for the Galactic conversion factor, or , averaged over the 90180 pc beam. Only the faintest cloud, GMC D, is within 200 pc of the central cluster. For the first time molecular gas is tentatively detected on the northwest side of the galaxy. It lies on the same line traced by the dust lane. The CO along the dust lane seen prominently to the southeast appears to cross the galaxy and continue to the northwest. The molecular gas also lines up with the prominent H and [OIII] filament (Graham, 1981; Calzetti et al., 1997). NGC 5253 is, though much smaller, reminiscent of the “dust lane ellipticals” or “polar-ring” classes of galaxies (eg., Sage & Galletta, 1993; Galletta, Sage & Sparke, 1997).
CO(2-1) emission resolves into five clouds along the dust lane (labeled A - E). Clouds D & E are tentatively detected, being only in intensity, with cloud D being the faintest. Clouds are indentified as any spatially and spectrally localized clump that has an intensity greater than 3 in two adjacent channels. Each cloud has been fit with an elliptical gaussian to determine its size and location. A box containing all the emission from the cloud was then summed to produce a spectrum, which was in turn fitted with a gaussian to obtain linewidths and velocity centroids (Table 2). Only cloud D is slightly resolved. Taking the beam minor axis as an upper limit, the remaining clouds have sizes (diameters) less than 90 pc. Typically giant molecular clouds (GMCs) in less-active dwarf galaxies have sizes 10 - 70 pc and linewidths of 3 - 12 km s-1 (eg. Rubio, Lequeux & Boulanger, 1993; Wilson, 1994, 1995; Taylor et al., 1999; Walter et al., 2001; Meier, Turner, & Beck, 2001). In the region associated with cloud C, the dust lane is particularly well pronounced against the background galaxy (Figure 1). If we assume that the molecular gas clouds follow the area of optical extinction, a size of or 55 pc is estimated. This suggests that the upper limits listed in Table 2 for the sizes and virial masses are about a factor of two larger than their true values. Linewidths for the clouds along the central dust lane are narrowest (8 - 15 km s-1). The upper limits of the cloud sizes and linewidths in NGC 5253 are, therefore, consistent with being GMCs, and henceforth will be referred to as such, although we cannot determine from the current data whether to identify them as self-gravitating objects (§3.2).
3.2 The Molecular Cloud Masses in NGC 5253
The estimation of molecular gas masses in dwarf galaxies is difficult, but important for determining the strength and efficiency of star formation. In environments with low metallicities and high radiation fields, it is predicted that CO ceases to be a reliable tracer of molecular hydrogen (Maloney & Black, 1988; Elmegreen, 1989; Sakamoto, 1996). We can hope to converge on the true molecular mass of NGC 5253 by taking virial masses as upper limits to the mass and masses from the Galactic conversion factor as likely lower limits to the gas mass. We describe these methods below.
The first to consider is the use of the standard conversion factor:
| (1) |
where is the conversion factor applicable to NGC 5253, the Galactic conversion factor = (Strong et al., 1988; Hunter et al., 1997), is the CO(2-1) flux in Jy km s-1, and is the CO(2-1)/CO(1-0) line ratio (eg., Petitpas & Wilson, 1998; Meier et al., 2001). In all further calculations, is assumed to be unity, consistent with the observed single-dish value (Meier et al., 2001). For , we find that the masses of the GMCs range from (Table 2). In low metallicity systems, CO emission is generally found to be underluminous for a given gas mass with respect to molecular gas in the Galaxy (Israel, 1986; Sage et al., 1992; Verter and Hodge, 1995; Wilson, 1995; Arimoto, Sofue and Tsujimoto, 1996; Taylor, Kobulnicky & Skillman, 1998). Hence the assumption should give a lower limit to the true molecular gas present.
A second method makes use of the assumption that the molecular clouds are in virial equilibrium, so that the constraints on clouds size and linewidth can be related to the total gravitational mass present (eg., MacLaren, Richardson, & Wolfendale, 1988):
| (2) |
where R is the radius of the cloud (assumed to be 0.7 with and being respectively the FWHM major and minor axes of the fitted cloud size) and is the FWHM of the linewidth. The constant of proportionality assumes that the GMCs have an dependence consistent with what is typically found for Galactic clouds, but changing the densities anywhere from affects the masses by 50 %. While the spatial resolution is not high enough to precisely determine the virial mass, it is high enough to provide useful upper limits on the clouds masses. Turbulence, stellar winds from the Wolf-Rayet stars (Walsh & Roy, 1989) and any supernovae associated with the starburst would all be expected to increase linewidths over their virial value, so the GMC masses we derive from assuming virial equilbrium should represent robust upper limits. Upper limits to the cloud masses based on virial equilibrium range from (GMC B) to (GMC A; Table 2). Derived values for GMC A should be considered especially uncertain because 1/2 of the GMC lies outside the half-power points of the primary beam.
A third independent constraint on gas masses is from the lack of dust emission in the millimeter continuum. For a dust temperature of 46 K (Thronson & Telesco, 1986), and a 1.3 mm dust absorption coefficient of (Pollack et al., 1994), . Dust continuum emission at 1.3 mm is not detected (§3.4). The upper limit to the 1.3 mm dust flux present at any location is 7.5 mJy, which equates to . If a Galactic gas-to-dust ratio of 100 is applicable to NGC 5253, the molecular mass implied from the dust is for each GMC. Since NGC 5253 has a low metallicity (log(O/H) = 8.16; Kobulnicky et al., 1997), the dust-to-gas ratio and hence the molecular cloud gas masses may be higher than this (Sage et al., 1992; Lisenfeld & Ferrara, 1998). However, masses estimated from 350 m continuum observations indicate that the gas-to-dust ratio is not significantly different from the adopted value (Meier et al. 2002, in preparation).
Surprisingly, for the dust lane GMCs B & C, the masses estimated from the virial theorem do not differ significantly from the lower limits estimated from CO emission and a Galactic conversion factor. Apparently these two GMCs have near-Galactic conversion factors. One would not expect the Galactic conversion to hold in such a low metallicity galaxy. To further test whether a Galactic conversion factor mass is applicable for the dust lane locations, we consider the relationship between gas mass and . Towards the dust lane, the dust geometry is reasonable well approximated by a foreground screen, with an (Calzetti et al., 1997). With the standard relationship of N(H)/AV = (Bohlin, Savage & Drake, 1978), this AV implies a column density of . The observed HI column density of (Kobulnicky & Skillman, 1995), suggests that . Again, this value is only slightly less than the obtained from the standard Galactic conversion factor.
If an extinction relationship more suitable for NGC 5253’s low metallicity, which is intermediate between those of the LMC and the SMC, is adopted, N(H) AV (eg., Weingartner & Draine, 2001), we obtain column densities of N(H2) cm-2 (at this column density, the gas would be dominated by .) This value of N(H2) is more than an order of magnitude larger than that found from the a Galactic conversion factor and more than a factor of two larger than the upper limit set by the virial analysis. The assumption of a Magellenic-like extinction relation significantly overpredicts the amount of gas present. Moreover, for the H/H ratio used to derive the visual extinction begins to saturate. If the extinction towards the dust lane is larger than A, then the above numbers are even more discrepent. However, since the N(HI) was estimated from observations with a larger beam () than the CO data, it is possible that N(HI) could be underestimated if N(HI) is unresolved. This could result in a reduction of the derived N(H2), but only in the case of near-Galactic extinction relationships. Future high resolution HI observations will be able to address the impact of this effect (Kobulnicky 2002, in preparation).
Evidently, the narrow linewidths, combined with relatively high extinction and bright CO emission imply that CO is not dramatically underluminous along the dust lane, and that it does a reasonable job of tracing the molecular gas mass. It is possible that CO is not so underluminous here because the dust lane, which is remote from the starburst, is not affected by the intense radiation field of the young stars.
The same cannot be said for the other GMCs. The virial mass upper limits of the three remaining GMCs A, D & E are all much larger than the conversion factor estimates (factors of 10 - 20). It is particularly true towards the central obscured star cluster (GMC D). Dust extinction measurements prove that there are mag towards the dominant nebula (Kawara, Nishida & Phillips, 1989; Calzetti et al., 1997), although this dust appears to be completely internal to the 1 pc supernebula (Gorjian, Turner & Beck, 2001; Turner et al., 2001, , Turner et al. 2002, in preparation.). Moreover, the linewidth of GMC D could well be larger than virial, reflecting turbulent motions associated with the large collection of OB stars. Such motions would likely not be present for the other GMCs. In summary, these results imply that the dust lane GMCs B & C have masses of . The masses of the other GMCs are not well determined but probably are larger than conversion factor values listed in Table 2, few each.
3.3 Molecular Gas Kinematics: Gas Infall onto the Galaxy?
Emission from the molecular clouds is detected from 355 - 440 km s-1, with the bulk of the CO(2-1) emission at 400 - 420 km s-1, consistent with lower resolution CO and HI data (Turner, Beck & Hurt, 1997; Taylor, Kobulnicky & Skillman, 1998; Meier et al., 2001). By contrast, the velocity of the central super-star cluster/supernebula and surrounding disk is 380 km s-1 (Atherton et al., 1982; Mohan, Anatharamaiah & Goss, 2001, Turner et al. 2001). Only GMC A is significantly blueshifted relative to central star cluster ( km s-1). In Figure 2, the Position-Velocity (PV) diagram is displayed for gas integrated within within 5 (which does not include GMC A) of the minor axis (pa. = 45o). Recessional velocities tend to increase as one moves farther away from the center of the galaxy along the dust lane (GMCs D - B), ranging from 395 km s-1 at the center to 430 km s-1 at or just beyond the field edge. This is similar to the ionized gas and HI velocity fields at this location, though the large beam size of the HI observations and the extinction of the ionized gas makes it difficult to compare in detail (Martin & Kennicutt, 1995; Kobulnicky & Skillman, 1995). Such a trend would be expected if the dust lane gas is rotating along the minor axis (Kobulnicky & Skillman, 1995). If the molecular gas associated with the dust lane is in rotation around the minor axis, then GMC E being on the opposite side of the galaxy should have blueshifted velocities with respect to the galaxy center (velocities of 350 km s-1 would be expected). GMC E has a recessional velocity of 425 km s-1, redshifted from the center of the galaxy. A similar upturn in the H velocity centroid is seen (crosses in Figure 2 taken from Martin & Kennicutt, 1995). If the velocity centroid of GMC E is believable and is a continuation of the dust lane across the galaxy, then the dust lane kinematics are not consistent with rotation. Since the dust lane is clearly in front of the majority (90 %; Calzetti et al., 1997) of the galaxy, the fact that the dust lane GMCs are all preferentially redshifted relative to the star cluster implies they are falling into the galaxy. GMC A may be an exception, though the extinction in the galaxy seen in the direction of this GMC is much lower; perhaps it is falling in as well, from the back side of the galaxy. Though difficult to see in the displayed stretch, inspection of the HST V-band image (Figure 1) shows increased extinction towards GMC E as well, suggesting that it too is foreground and infalling. If it is assumed that GMC E is not real, it is possibly that the dust lane GMCs B, C and possibly D could be rotating, but then GMC A would still be infalling. As a result, it is concluded that over the central radius of the galaxy, the kinematics of the molecular gas favor infall (accreting gas) over rotation. Which gas is infalling, GMCs A & E or the dust lane GMCs B & C, depends on the believability of GMC E, but in any case it appears from the kinematics that some gas must currently be infalling. CO traces only part of the extensive cloud cloud of HI gas, so higher resolution HI observations (Kobulnicky 2002, in preparation) will give a much more complete picture of the complex gas kinematics in NGC 5253.
3.4 Millimeter Continuum: Further Evidence for Optically Thick Cm-wave Emission from the Supernebula
The radio continuum spectrum of NGC 5253 is flat from 20 cm to 2.6 mm (Beck et al., 1996; Turner, Beck & Hurt, 1997). At short wavelengths, the central “supernebula” associated with a very young SSC contributes a significant fraction of the radio flux, but the emission is likely optically thick longward of 2 cm (Turner, Ho & Beck, 1998; Turner, Beck & Ho, 2000). Even the highest frequency cm-wave observations may still not detect the full strength of the central starburst in NGC 5253. Emission from dust can also potentially contribute to the observed millimeter continuum fluxes. Therefore, we have imaged the millimeter continuum at both 3.1 mm and 1.3 mm to better constrain the spectral energy distribution, the total star formation strength and the dust content.
Figure 3 displays the 97 GHz (3.1 mm) and 233 GHz (1.3) mm continuum maps of NGC 5253. The 3.1 mm continuum emission is essentially unresolved in the beam, with a marginally believable extension to the west of the peak. The peak 3.1 mm flux density of the central source is mJy beam-1. Summed over the inner , the total 3.1 mm flux density is mJy. This is in good agreement with the values and at 2.6 mm (Turner, Beck & Hurt, 1997). As in the case of the 3.1 mm map, the emission at 1.3 mm is basically unresolved, though it is possible that there is a western extension as well. The 1.3 mm peak flux density is mJy and over the central 20. The 1.3 mm continuum peak is centered at , . The 3.1 mm continuum peak is west of the 1.3 mm position, but considering the large beams and moderate SNR, this difference is not significant. We are unable to confirm the existence of the suggested weak secondary northern component (Turner, Beck & Hurt, 1997). The spectral index, , () found for the central cluster between 3.1 mm and 1.3 mm is . The flat spectral index demonstrates that the radio emission from the central starburst is dominated by thermal bremsstrahlung emission out to 230 GHz (see below).
In Figure 4, the radio-mm spectral energy distribution (SED) is displayed for the central 20 of NGC 5253. The additional flux measurements are taken from Turner, Beck & Hurt (1997) and Turner, Ho & Beck (1998). The radio spectrum is indeed basically flat from 20 cm to 1.3 mm. However, interesting deviations from a flat () spectrum are seen. The total continuum fluxes observed at the shortest wavelengths (1 cm) are brighter than extrapolated from the centimeter data assuming the standard optically thin bremsstrahlung spectrum. The probable explanation for this, as suggested previously, is optically thick radio continuum from the supernebula associated with the youngest optically obscured cluster (Turner, Ho & Beck, 1998; Turner, Beck & Ho, 2000).
We model the radio-mm SED based on the thermal/non-thermal separation derived from the cm-wave data (Turner, Ho & Beck, 1998). The SED is fit with three components. One component is optically thin, thermal free-free emission with a flux density of 43 mJy at 6 cm, based on summing up the 6 cm flux of the sources with thermal spectral indices between 2 cm and 6 cm. The second component is synchrotron emission with an adopted spectral index of , which accounts for the remainder of the flux at 20 cm. This component is very small (8 mJy) and negligible shortward of 10 cm. The third component is the supernebula. It is assumed to have an optically thick free-free spectrum with a flux density of 11 mJy at 2 cm and a turnover wavelength () below 2 cm as seen in the VLA-A array map (Turner, Beck & Ho, 2000). That the millimeter fluxes are only slightly brighter than the 2 cm point demonstrates that the turnover wavelength cannot be much shorter than 1.3 cm. The best fit to the turnover wavelength is cm (20 GHz). Therefore, the higher flux densities seen at the millimeter wavelengths beautifully confirm the presence of an HII region that is optically thick below 2 cm. While it is possible that NGC 5253 contains several optically thick HII regions with different turnover wavelengths, the quality of the fit without them indicates that any additional sources must not provide a substantial contribution to the overall flux. Again, NGC 5253 is unique, having a single, optically thick supernebula that is dominant enough to be distinguishable in the global SED of the nucleus.
From the spectrum and it is clear that the continuum detected at 1.3 mm is still consistent with being entirely thermal bremsstrahlung. No dust emission is detected at 1.3 mm. From the 1.3 mm continuum flux, we estimate (eg., Mezger & Henderson, 1967) a Lyman continuum rate of for the central 20, (for K; Walsh & Roy, 1989). The rate is somewhat higher than estimated at 2 cm, as expected if some of the free-free emission is still optically thick at that wavelength. From the SED (Figure 4) at least N comes from the optically thick supernebula alone. The rate derived from the 1.3 mm continuum data should be a robust estimate of all possible ionizing photons in the central region, since an emission measure, , would be required for optically thick continuum beyond 200 GHz. Even in an exotic region like NGC 5253’s supernebula, this is unlikely for this relatively large region. Given that the best fit turnover wavelength is cm, the central supernebula has an , or for a line-of-sight distance of 1 pc. Towards the dust lane, an upper limit of is derived from the more constraining 3.1 mm continuum upper limit. Apparently, the dust lane is not a site of strong current star formation despite being the brightest region in CO.
4 Molecular Gas and the Star Formation Efficiency in NGC 5253
The confinement of the molecular gas to a lane crossing the minor axis, together with the fact that the foreground molecular gas is redshifted with respect to the starburst strongly suggests that gas is currently falling into the nucleus. The idea that an interaction with the “companion”, M 83, (at a current projected distance of 130 kpc) occurred 1 Gyr ago, triggering the burst of star formation, has been suggested by several authors (van den Bergh, 1980; Graham, 1981; Kobulnicky & Skillman, 1995; Turner, Beck & Hurt, 1997; Calzetti et al., 1999). In a global sense, this is a reasonable trigger for the starburst in NGC 5253. However, due to the large differences in timescales, 1 Gyr for the interaction age and Myr for the current starburst episode, the current burst of star formation can only be indirectly triggered by an interaction with M 83. No other suitable galactic merger candidates appear near enough to NGC 5253 to directly trigger the burst. We find a similar time delay between the interaction and the current starburst in another nearby dwarf interaction-induced starburst, NGC 3077 (Meier, Turner, & Beck, 2001). In that starburst, we demonstrated that the delay can successfully be explained by the gas clouds that were either pulled out of the dwarf, NGC 3077, or captured from M 81 raining back down onto the galaxy due to effects such as dynamical friction. Evidence is strong for the triggering in NGC 3077; in this famous system (the M81-M82-NGC 3077 triplet), large streamers of gas connect the three main galaxies. In addition, large gas clouds are seen just outside the optical disk of NGC 3077, and the starburst in the galaxy is seen at the interface of two “colliding” GMCs.
It is tempting to apply the same mechanism to NGC 5253, although direct evidence for an interaction with M 83 is not available. Indirect support of such an interaction is provided by the strongly warped disk of M83, a finger of HI emission extending towards NGC 5253 (Rogstad, Lockhart & Wright, 1974; Tilanus & Allen, 1993; Crosthwaite et al., 2002), the fact that the dust lane points back towards M83 (eg., Calzetti et al., 1999) and the existence of a population of intermediate age clusters in the outer parts of NGC 5253 (between 0.1 - 1 Gyr; Caldwell & Phillips, 1989). On the other hand, low resolution HI observations of NGC 5253 do not show evidence for any HI clouds greater than M⊙ outside its optical disk (Kobulnicky & Skillman, 1995), unlike what has been seen in the M81 group Yun, Ho & Lo (1994).
Clearly though, the presence of infalling gas along the minor axis (§3.3), implies that some gas must have been in the halo sometime in the recent past. In fact, from a conceptual perspective, infall of a gas cloud into a dwarf galaxy model may represent a qualitatively similar event to the large spiral-satellite mergers modeled, only on a much smaller sizescale, with the delayed trigger of the starburst occurring upon “the final stages” of merger of the small gas cloud (eg., Hernquist, 1989; Mihos & Hernquist, 1994). Assuming the conversion factor over much of the galaxy is not significantly larger than we have estimated (§3.2), a M⊙ cloud is all that is required to explain the dust lane molecular gas.
The origin of the gas in the dust lane is unknown. NGC 5253 appears to have been a metal-poor dwarf elliptical before the current burst with very little galactic rotation (Caldwell & Phillips, 1989). This suggests that the bulk of the infalling gas did not originally belong to NGC 5253. In fact, if the conversion factors we derived in §3.2 are correct, the dust lane gas may have higher metallicities than the rest of the “disk” of NGC 5253. This situation could arise if the dust lane gas came from a higher metallicity object like M 83. It might be expected that the gas morphology seen in NGC 5253 is similar to what NGC 3077 will look like when most of its remaining halo gas clouds settle into the galaxy, a few hundred Myrs from now. In order to conclude that the gas originated from NGC 5253, it appears that one would require the gas to experience enrichment in metals from a previous generation star formation event as it falls back in from the halo (eg., Mac Low & Ferrara, 1999; D’Ercole & Brighenti, 1999; Recchi, Matteucci, & D’Ercole, 2001).
The molecular gas morphology and the extreme youth of the starburst in the NGC 5253 put strong constraints on the gas evolution in the nucleus. The youngest optically visible cluster is 2.5 Myrs old (Calzetti et al., 1997), and the optically obscured super-star cluster and its associated supernebula are almost certainly even younger, Myr or less (eg. Beck et al., 1996; Crowther et al., 1999; Turner, Beck & Ho, 2000). Assuming that the GMCs are moving 40 km s-1 with respect to the super star cluster/supernebula (§3.3), only GMCs within a distances of pc (6.5), can be casually connected with it. Of the molecular gas detected only GMC D can satisfy such a constraint. The molecular gas we detect along the dust lane is too far away and moving in the wrong direction to be responsible for the current burst of star formation. Presumably it is the fuel of a future burst.
It is well known that the IR luminosity of NGC 5253 is high relative to the amount of molecular gas present, (Turner, Beck & Hurt, 1997), suggesting a high global efficiency of star formation. We consider here the SFE local to within pc of the SSC. Based on a Salpeter IMF, Turner, Beck & Ho (2000) calculate that the central cluster contains of stars. Assuming that only the molecular gas in GMC D can be associated with the current SSC formation, this implies , for a Galactic conversion factor, or a SFE = = 75 %. Even if the applicable conversion factor for NGC 5253 is a factor of 10 larger than the Galactic value, the upper limit allowable from the virial linewidth (which probably overestimates the molecular mass somewhat; §3.2), the SFE on this localized scale is quite high, at least 25 %. The SFE will be even higher if GMC D is not directly related to the burst, being just lined up in projection. Apparently, this super-star cluster has converted a major fraction of its gas mass to stars, as expected in order for the cluster to remain bound (eg. Lada, Margulis & Dearborn, 1984).
One of the goals of this project is to clarify what triggered the formation of the young super star clusters in NGC 5253. Because the current starburst is so young, a few Myrs, the molecular gas distribution should not have had time to change significantly since its “initial configuration”. The current starburst appears to occur at the “intersection” of the dust lane and the center of the galaxy. This morphology supports the hypothesis that the burst of star formation in NGC 5253 is being triggered by inflow of gas. The comparative lack of star formation associated with dust lane itself (§3.4), implies that strong star formation does not begin until the infalling gas reaches the center of the galaxy. A possible explanation for this could be that there existed a collection of gas (possibly HI) at the center of NGC 5253’s potential well that the infalling gas collided with. If so, the burst would have had to have consumed its gas extremely efficiently in order to create several clusters (Calzetti et al., 1997; Turner, Ho & Beck, 1998) with only the extremely faint GMC D remaining of the gas. One can relax the efficiency somewhat by assuming that the CO conversion factor at GMC D is off by orders of magnitude (Turner, Beck & Hurt, 1997); however our analysis indicates that the conversion factor cannot be large enough to eliminate the need for a high star formation efficiency. Another possible trigger is that the GMCs shock and collapse due to the steepening of the galaxy potential at the center of the nucleus (eg., Kovalenko & Levy, 1992; Wakamatsu, 1993). This is unlikely for a small galaxy like NGC 5253. A third possibility is that an overpressure on the GMC surfaces due to a superwind driven from the older clusters in the nucleus of NGC 5253 (eg. Graham, 1981; Marlowe et al., 1995; Martin & Kennicutt, 1995; Strickland & Stevens, 1999) compressed the infalling clouds as they approach the center of the galaxy, triggering the current burst, a form of sequential star formation (Elmegreen & Lada, 1977). This is an enticing hypothesis since the ages of the brightest star cluster do appear to decrease consistently from the southwest towards the northeast hinting at the possiblity of propagating star formation (Gorjian, 1996; Calzetti et al., 1997; Tremonti et al., 2001). However, evidence for a superwind is weak. All observed linewidths to date have been relatively narrow (Marlowe et al., 1995; Mohan, Anatharamaiah & Goss, 2001; Turner, 2002). ROSAT HRI observations of the X-ray emitting gas imply that the hot gas is still localized to the star clusters and hasn’t yet had time to drive a large-scale galactic wind (Strickland & Stevens, 1999). And this theory is not obviously consistent with the current distribution of molecular gas: why it there an age trend southwest-to-northwest, when the gas is distributed southeast-to-northwest? Super star clusters, which require a high efficiency of conversion of gas into stars, may leave little evidence of their formation in the form of molecular gas.
5 Summary
We have confirmed the detection of CO in the dust lane of NGC 5253. Our analysis of the dust and virial masses indicate that the Galactic conversion factor may hold locally in the dust lane, implying it probably contains less than a few of molecular gas. For the first time we detect molecular gas in the direction of the central SSCs and radio/IR nebula; the total amount of molecular gas at this location is small, –. We also confirm the presence of optically thick free-free emission at 2 cm towards the supernebula, and obtain N over the central 20. The kinematics of the molecular clouds in the dust lane indicate that these clouds are falling into NGC 5253, consistent with the hypothesis that the starburst is caused by accretion of gas from outside the galaxy. However beyond this general inference, little can be said about the detailed trigger for the star formation. The small amount of molecular gas close enough to be causally associated with the current star formation demonstrates that regardless of what the specific trigger is it must have been extremely efficient. We estimate a star formation efficiency of 75 % for the current starburst: at worst it can be 25 %. This high efficiency is consistent with the formation of a large, bound cluster as indicated by the radio/IR supernebula. The gun that triggers super star cluster formation may be relatively smokeless.
References
- Arimoto, Sofue and Tsujimoto (1996) Arimoto, N., Sofue, Y. & Tsujimoto, T. 1996, PASJ, 48, 275
- Atherton et al. (1982) Atherton, P. D., Taylor, K., Pike, C. D., Harmer, C. F. W., Parker, N. M. & Hook, R. N. 1982, MNRAS, 201, 661
- Beck (2000) Beck, S. C. 2000, Sci Am, 282, 46
- Beck et al. (1996) Beck, S. C., Turner, J. L., Ho, P. T. P., Lacy, J. H. & Kelly, D. M. 1996, ApJ, 457, 610
- Bohlin, Savage & Drake (1978) Bohlin, R. C., Savage, B. D. & Drake, J. F. 1978, ApJ, 224, 132
- Caldwell & Phillips (1989) Caldwell, N. & Phillips, M. M. 1989, ApJ, 338, 789
- Calzetti et al. (1999) Calzetti, D., Conselice, C. J., Gallagher Jr., J. S. & Kinney, A. L. 1999, AJ, 118, 797
- Calzetti et al. (1997) Calzetti, D., Meurer, G. R., Bohlin, R. C., Garnett, D. R., Kinney, A. L., Leitherer, C. & Storchi-Bergmann, T. 1997, AJ, 114, 1834
- Campbell, Terlevich & Melnick (1986) Campbell, A. W., Terlevich, R. & Melnick, J. 1986, MNRAS, 223, 811
- Conti (1991) Conti, P. 1991, ApJ, 377, 115
- Crowther et al. (1999) Crowther, P. A., Beck, S. C., Willis, A. J., Conti, P. S., Morris, P. W. & Sutherland, R. S. 1999, MNRAS, 304, 654
- Crosthwaite et al. (2002) Crosthwaite, L. P., Turner, J. L., Buchholz, L., Ho, P. T. P., & Martin, R. N. 2002, AJ, 123, 1892.
- D’Ercole & Brighenti (1999) D’Ercole, A. & Brighenti, F. 1999, MNRAS, 309, 941
- Elmegreen (1989) Elmegreen, B. G., 1989, ApJ, 338, 178
- Elmegreen & Lada (1977) Elmegreen, B. G., & Lada, C. J. 1977, ApJ, 214, 725
- Galletta, Sage & Sparke (1997) Galletta, G., Sage, L. J. & Sparke, L. S. 1997, MNRAS, 284, 773
- Gibson et al. (2000) Gibson, B. K. et al. 2000, ApJ, 529, 723
- Gorjian (1996) Gorjian, V. 1996, AJ, 112, 1886
- Gorjian, Turner & Beck (2001) Gorjian, V., Turner, J. L. & Beck, S. C. 2001, ApJ, 554, L29
- Graham (1981) Graham, J. A. 1981, PASP, 93, 552
- Hernquist (1989) Hernquist, L. 1989, Nature, 340, 687
- Hunter et al. (1997) Hunter, S. D. et al. 1997, ApJ, 481, 205
- Israel (1986) Israel, F. P. 1986, A&A, 168, 369
- Kawara, Nishida & Phillips (1989) Kawara, K., Nishida, M. & Phillips, M. M. 1989, ApJ, 337, 230
- Kobulnicky & Skillman (1995) Kobulnicky, H. A. & Skillman, E. D. 1995, ApJ, 454, L121
- Kobulnicky et al. (1997) Kobulnicky, H. A., Skillman, E. D., Roy, J.-R., Walsh, J. R. & Rosa, M. R. 1997, ApJ, 477, 679
- Kovalenko & Levy (1992) Kovalenko, I. G. & Levy, V. V. 1992, A&A, 264, 406
- Lada, Margulis & Dearborn (1984) Lada, C. J., Margulis, M. & Dearborn, D. 1984, ApJ, 285, 141
- Lisenfeld & Ferrara (1998) Lisenfeld, U. & Ferrara, A. 1998, ApJ, 496, 145
- MacLaren, Richardson, & Wolfendale (1988) MacLaren, I., Richardson, K. M., & Wolfendale, A. W. 1988, ApJ, 333, 821
- Mac Low & Ferrara (1999) Mac Low, M. & Ferrara, A. 1999, ApJ, 513, 142
- Maloney & Black (1988) Maloney, P., & Black, J. H. 1988, ApJ, 325, 389.
- Marlowe et al. (1995) Marlowe, A. T., Heckman, T. M., Wyse, R. F. G. & Schommer, R. 1995, ApJ, 439, 563
- Martin & Kennicutt (1995) Martin, C. L. & Kennicutt Jr., R. C. 1995, ApJ, 447, 171
- Meier & Turner (2001) Meier, D. S. & Turner, J. L. 2001, ApJ, 551, 687
- Meier, Turner, & Beck (2001) Meier, D. S., & Turner, J. L. & Beck, S. C. 2001, AJ, 122, 1770
- Meier et al. (2001) Meier, D. S., Turner, J. L., Crosthwaite, L. P. & Beck, S. C. 2001, AJ, 121, 740
- Meurer et al. (1995) Meurer, G. R., Heckman, T. M., Leitherer, C., Kinney, A., Robert, C. & Garrett, D. R. 1995, AJ, 110, 2665
- Mezger & Henderson (1967) Mezger, P. G. & Henderson, A. P. 1967, ApJ, 147, 471
- Mihos & Hernquist (1994) Mihos, J. C. & Hernquist, L. 1994, ApJ, 425, L13
- Mohan, Anatharamaiah & Goss (2001) Mohan, N. R., Anatharamaiah, K. R. & Goss, W. M. 2001, astro-ph/0104407
- O’Connell, Gallagher & Hunter (1994) O’Connell, R. W., Gallagher III, J. S. & Hunter, D. A. 1994, ApJ, 433, 65
- Padin et al. (1991) Padin, S., Scott, S. L., Woody, D. P., Scoville, N. Z., Seling, T. V., Finch, R. P., Ciovanine, C. J., & Lowrance, R. P. 1991, PASP, 103, 461
- Petitpas & Wilson (1998) Petitpas, G. R. & Wilson, C. D. 1998, ApJ, 496, 226
- Pollack et al. (1994) Pollack, J. B., Hollenbach, D., Beckwith, S., Simonelli, D. P., Roush, T. & Fong, W. 1994, ApJ, 421, 615
- Recchi, Matteucci, & D’Ercole (2001) Recchi, S., Matteucci, F., & D’Ercole, A. 2001, MNRAS, 322, 800
- Reike, Lebofsky & Walker (1988) Reike, G. H., Lebofsky, M. J. & C. E. 1988, ApJ, 325, 679
- Rogstad, Lockhart & Wright (1974) Rogstad, D. H., Lockhart, I. A. & Wright, M. C. H. 1974, ApJ, 193, 309
- Rubio, Lequeux & Boulanger (1993) Rubio, M., Lequeux, J. & Boulanger, F. 1993, A&A, 271, 9
- Sage & Galletta (1993) Sage, L. J. & Galletta, G. 1993, ApJ, 419, 544
- Sage et al. (1992) Sage, L. J., Salzer, J. J., Loose, H.-H. & Henkel, C. 1992, A&A, 265, 19
- Saha et al. (1995) Saha, A., Sandage, A., Labhardt, L., Schwengler, H., Tammann, G. A., Panagia, N. & Macchetto, F. D. 1995, ApJ, 438, 8
- Sakamoto (1996) Sakamoto, S. 1996, ApJ, 462, 215
- Scoville et al. (1994) Scoville, N. Z., Carlstrom, J., Padin, S., Sargent, A., Scott, S. & Woody, D. 1994, Astronomy with Millimeter and Submillimeter Wave Interferometry, IAU Colloquium 140, ASP Conference Series, Vol. 59, 1994, M. Ishiguro and J. Welch, Eds., p.10
- Strickland & Stevens (1999) Strickland, D. K. & Stevens, I. R. 1999, MNRAS, 306, 43
- Strong et al. (1988) Strong, A. W. et al., 1988, A&A, 207, 1
- Taylor et al. (1999) Taylor, C. L., Hüttemeister, S., Klein, U., & Greve, A. 1999, A&A, 349, 424
- Taylor, Kobulnicky & Skillman (1998) Taylor, C. L., Kobulnicky, H. A. & Skillman, E. D. 1998, AJ, 116, 2746
- Tilanus & Allen (1993) Tilanus, R. P. J. & Allen, R. J. 1993, A&A, 274, 707
- Thronson & Telesco (1986) Thronson, H. A. & Telesco, C. M. 1986, ApJ, 311, 98
- Tremonti et al. (2001) Tremonti, C. A., Calzetti, D. L., Leitherer, C. & Heckman, T. M. 2001, ApJ, 555, 322
- Turner (2002) Turner, J. L. 2002, to appear in Hot Star Workshop III: The Earliest Stages of Massive Starbirth, ed. P. A. Crowther, (San Francisco: ASP)
- Turner et al. (2001) Turner, J. L., Crosthwaite, L. P., Meier, D. S., & Beck, S. C. 2001, BAAS, 33, 799
- Turner, Beck & Ho (2000) Turner, J. L., Beck, S. C. & Ho, P. T. P. 2000, ApJ, 532, L109
- Turner, Beck & Hurt (1997) Turner, J. L., Beck, S. C. & Hurt R. L. 1997, ApJ, L474, 11
- Turner, Ho & Beck (1998) Turner, J. L., Ho, P. T. P. & Beck, S. C. 1998, AJ, 116, 1212
- van den Bergh (1980) van den Bergh, S. 1980, PASP, 92, 122
- Verter and Hodge (1995) Verter, F. & Hodge, P. 1995, ApJ, 446, 616
- Wakamatsu (1993) Wakamatsu, K. 1993, AJ, 105, 1745
- Walsh & Roy (1989) Walsh, J. R. & Roy, J.-R. 1989, MNRAS, 239, 297
- Walter et al. (2001) Walter, F., Taylor, C. L., Hüttemeister, S., Scoville, N. Z. & McIntyre, V. 2001, AJ, 121, 727
- Weingartner & Draine (2001) Weingartner, J. C. & Draine, B. T. 2001, ApJ, 548, 296.
- Wilson (1994) Wilson, C. D. 1994, ApJ, L434, 11
- Wilson (1995) Wilson, C. D. 1995, ApJ, L448, 97
- Whitmore (2001) Whitmore, B. C. 2001, in “A Decade of HST Science”, ed. M. Livio, K. Noll & M. Stiavelli (Cambridge: Cambridge Univ. Press)
- Whitmore & Schweizer (1995) Whitmore, B. C., & Schweizerm F. 1995, AJ, 109, 960
- Yun, Ho & Lo (1994) Yun, M. S., Ho, P. T. P. & Lo, K. Y. 1994, Nature, 372, 530
| TransitionbbPhase Center #1: (B1950)
Phase Center #2: (B1950) |
Frequency | Beamsize | Noise level | ||
|---|---|---|---|---|---|
| (GHz) | () | (MHz) | (arcsec; deg) | (mK / mJy Bm-1) | |
| CO(2-1) | 230.538 | 5.20ccThe CO(2-1) maps were smoothed to 5.2 km s-1 resolution from 2.6 km s-1. | 32 | ddThe CO(2-1) data was tapered with a 40k taper. | 50/0.10 |
| 3.1 mm | 96.5 | 1000 | 5.4/2.5 | ||
| 1.3 mm | 233.3 | 1000 | 5.9/7.5 |
| Parameter | Units | GMCs | ||||
|---|---|---|---|---|---|---|
| AaaFitted values for GMC A are more uncertain given that it is at the edge of the primary beam FWHM. Integrated intensities of this cloud make no attempt to correct for emission outside the field of view. | B | C | D | E | ||
| Right AscensionbbValues based on gaussian fits to the spectra. | ||||||
| DeclinationbbValues based on gaussian fits to the spectra. | 30 | 36 | 32 | 26 | 18 | |
| b,cb,cfootnotemark: | ||||||
| bbValues based on gaussian fits to the spectra. | 363 | 421 | 419 | 395 | 424 | |
| bbValues based on gaussian fits to the spectra. | 36 | 8.4 | 12 | 15 | 27 | |
| bbValues based on gaussian fits to the spectra. | Jy | 0.36 | 1.0 | 0.90 | 0.51 | 0.30 |
| ddFlux estimates are based on the assumption that the clouds are unresolved. The applied 1 clipping (§2) may cause a slight underestimate of cloud sizes, but fitting the GMCs with no clipping demonstrates that this does not increase any derived sizes greater than the quoted upper limits. | 16.9 | 12.7 | 14.3 | 6.9 | 7.6 | |
| () | 0.86 | 0.65 | 0.73 | 0.36 | 0.38 | |
| () | 4.6 |
Note. — Uncertainties are conservately estimated as for the position centroids, 8 for cloud sizes, 3 km s-1 for the linewidth and line centroid, 0.1 Jy for the peak intensity, 3 Jy km s-1 for the flux density and approximately a factor of two for the masses.