Spatially resolved STIS spectra of the gravitationally lensed BAL quasar APM08279+5255: the nature of component C and evidence for microlensing
Abstract
While gravitationally lensed quasars are expected to display an odd number of images, invariably systems are observed with an even number of quasars. For this, lensing galaxies must have very small core radii; this provides strong demagnification of one of the images. High resolution imaging of the gravitationally lensed BAL quasar, APM08279+5255, reveals three point-like images. As these images possess similar colours, it has been suggested that each represents a lensed image. Here, spatially resolved spectra of the individual components, obtained with STIS on the HST, are presented, clearly revealing that each is an image of the quasar. This confirms that APM08279+5255 represents the first example of an odd-image gravitationally lensed system. The implications for the properties of the lensing galaxy are discussed. It is also found that the individual images possess spectral differences indicative of the influence of gravitational microlensing in this system.
keywords:
gravitational lensing – quasars: individual: APM08279+52551 Introduction
The broad absorption line (BAL) quasar APM08279+5255 was identified serendipitously within a survey of carbon stars in the Galactic halo (Irwin et al. 1998). The optical emission is coincident with a Jy IRAS source at 100m and was also found to be a significant submillimetre source, with a flux of 75mJy at 850m (Lewis et al. 1998); the inferred bolometric luminosity is , making APM08279+5255 one of the most luminous sources known. The discovery images revealed that APM08279+5255 is not a single point-like source, rather it is extended (Irwin et al. 1998). Adaptive optics with the CFHT clearly displayed APM08279+5255’s compound nature, revealing a pair of point-like images separated by 0.4 arcsec (Ledoux et al. 1998). Further observations, using NICMOS on the Hubble Space Telescope (Ibata et al. 1999) and the Keck telescope (Egami et al. 2000), uncovered a fainter third image between the brighter two, the colours of which suggest that it represents a third image of the quasar.
Paradoxically, this conclusion is somewhat problematic. Although one of the fundamental predictions of gravitational lens theory is that there should always be an odd number of lensed images (e.g. Burke 1981), in practice all lensed QSOs known to date exhibit an even number of images. Narasimha, Subramanian, & Citre (1986) have shown that this is in fact expected if the lensing galaxies have very small core radii; the core ‘captures’ one of the images and strongly demagnifies it. The fact that APM 08279+5255 apparently defies this trend is reflected in the mass models for the lens which require unphysically large cores to explain the brightness of image C, if the latter is indeed an image of the QSO (Ibata et al. 1999; Egami et al. 2000; Munoz et al. 2001). This led Ibata et al. (1999) to also propose an alternative model where component C is actually the lensing galaxy responsible for the observed configuration; this model possesses more ‘typical’ galaxy parameters. Recent observations of the nuclear CO(1-0) emission in APM08279+5255 reveals a complex morphology which suggests that the lens in this system is a highly flattened system, such as an edge-on spiral galaxy (Lewis et al. 2002). With this model, component C is an image of the quasar and the ternary configuration of the quasar source lying in the vicinity of a ‘naked cusp’ (e.g. Bartelmann & Loeb 1998).
The situation is complicated by the presence of two very strong MgII systems at z=1.062 and 1.181. A detailed study of the corresponding absorption spectrum shows that these systems are damped with a very high HI column density (, Petitjean et al. 2000). The objects associated with these two systems could both contribute to the lensing of the quasar.
Given the extreme apparent properties of APM08279+5255, an accurate lens model is essential for the determination of its true intrinsic properties. This paper presents new spatially resolved spectra of the various components in this lensing system, with the goal of determining the nature of component C. Section 2 presents a description of the observing and data reduction, reviewing the nature of component C in Section 3. This section also discusses the implications of this study. Finally, the conclusions are presented in Section 4.
2 Observations and Reduction
2.1 Observations
The aim of the observing program was to obtain a spatially resolved, high resolution spectrum of the BAL quasar, APM 08279+5255. While being triply imaged, the image separations in this system are small, ranging from 0.15 arcsecs to a maximum of 0.38 arcsecs. Ground-based observations of this bright source have revealed a rich absorption spectrum caused by both intervening material and the complex QSO environment (Ellison et al. 1999a,b; Srianand & Petitjean 2000; Petitjean et al. 2000).
The Space Telescope Imaging Spectrograph (STIS) on-board the Hubble Space Telescope (HST) was employed in this endeavor. The principal aim was to probe the numerous intervening systems on sub-kpc scales, to investigate the structure of intervening galaxy halos and metal line systems on scales of 0.2 – 1.6 kpc h-1, as well as their kinematics and spatial extents. A further goal was to obtain multiple sightlines through the complex BAL flow on parsec scales, yielding information on ionization, kinematics and metal enrichment; these will be the topics of forthcoming articles. Here we present an initial investigation of the spectra in the individual lensed images, with the goal of establishing the nature of image C.
The STIS G750M grating was used in five different (primary) wavelength settings so as to achieve complete coverage from – 8600 Å (see Table 1). Acquisition was achieved using the brightest component A. The 52 0.2 arcsec slit was then oriented along the major axis between the two brightest components (A and B) and then offset perpendicularly by 0.02 arcseconds to achieve improved centring on the faint component C. The STIS spatial pixel scale is 0.051 arcsecs/pixel, with a typical dispersion of 0.56Å/pixel. In addition to the standard calibrations (including spectra of the He-Ar arc lamp for wavelength calibration), extra flat field images were obtained for the three reddest settings in order to correct for significant fringing at these wavelengths. Multiple exposures were obtained for each setting, subsequent exposures stepped along the slit by 1 arcsecond.
Due to a combination of narrow scheduling windows and backlog from previous cycles, only a subset of the orbits has so far been completed, see Table 1. While we defer a comprehensive analysis of the absorption spectra until the full data set has been acquired, there is sufficient information in the first wavelength setting, at Å (first line of Table 1) to confirm the nature of component C. The data considered in this paper consist of five individual spectroscopic exposures; each exposure was offset by 20 pixels (one arcsecond) relative to the previous one, so as to maintain optimal spatial resolution and minimise the effects of CCD and camera artifacts.
| Wavelength | Total | Completed |
|---|---|---|
| Range (Å) | Integration (s) | Integration (s) |
| 5965 – 6538 | 14 900 | 14 900 |
| 6482 – 7054 | 11 800 | 0 |
| 6997 – 7569 | 11 800 | 8 700 |
| 7509 – 8081 | 14 900 | 14 900 |
| 8025 – 8597 | 21 100 | 6 200 |
2.2 Data Reduction
The extraction of the individual spectra is slightly complicated by the fact that the spectra are not completely separated, especially components A and C, even with the superb resolution afforded by STIS. The extraction was performed in a straightforward, but non-standard way, which we now detail. The adopted procedure is similar to that undertaken for the complex gravitational lens Q2237+0305 by Lewis et al. (1998).
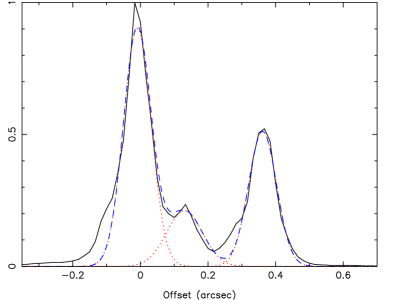
The first step we took was to trace the spectrum of of component A (the brightest QSO component) with a straight line fit; this gives the spatial offset between the spectral images to pixels. After correcting for the slope of the spectrum on the image, we obtain the distribution of flux in the spatial direction, integrated over the wavelength range, Å to Å(Figure 1). To aid the visual interpretation of this diagram, we have overlaid a three component Gaussian fit. The three quasar components are clearly distinguished in this single spectroscopic exposure; also evident is the peculiar asymmetric profile (seen as an excess over the Gaussian fit to the left side of components A and B).
We constructed a model point-spread function using an archival spectrum of the star 51 Peg (HST root name O6IH50050) taken in approximately the same wavelength range, only a day prior to the observations described here. By fitting this PSF to the data in Figure 1, we are able to define suitable extraction bands for each one of the components. These bands are listed in Table 2, with positions relative to the centre of component A. Estimates of the cross-contamination from the other quasar components and the fraction of the flux missed are also given in the table (assuming the model PSF derived from the 51 Peg observation). The worst case is clearly image C, where the extracted spectrum has a total of % contamination from components A and B, and is missing % of the flux.
| Image | Lower | Upper | cross- | flux |
|---|---|---|---|---|
| band edge | band edge | contamination | missed | |
| A | 2% | 7% | ||
| B | 1% | 1% | ||
| C | 10% | 30% |
He-Ar arc-lamp spectra were also extracted from the arc-lamp spectral image from identical regions as the object spectra. These arc-lamp spectra were used to wavelength calibrate the observed QSO spectra which were then rebinned onto the interval Å to Å with linear wavelength steps. Finally, the five spectral observations of the three QSO images were combined using a median-combining algorithm. Figure 2 displays the three spectra obtained in this manner.

3 Discussion
3.1 The nature of component C
A cursory examination of the individual spectra of the three images presented in Figure 2 clearly reveals that each is of the quasar source, and, therefore, image C represents a third image of the quasar and is not the lensing galaxy. This confirms earlier interpretations of the available photometric data (Ibata et al. 1999; Egami et al. 2000; Munoz et al. 2001).
3.2 Spectral differences
A more detailed examination of the three spectra in Figure 2, however, also reveals that they are not identical. Even accounting for the strong Mg II doublet lines near 6100 Å (at ), probably due to the presence of the lensing galaxy, and for the Ly and N V BAL features below Å, it is evident that the equivalent width of the Ly+N V emission line blend near 6050 Å is different in each of the three images. Relative to the continuum, the emission lines are strongest in image C and weakest in B.
These differences are summarised in Table 3 (where we have corrected for the missing flux in the spectrum extraction procedure). For the continuum level we adopted the mean observed flux in the wavelength interval 6250–6350 Å which, at , corresponds to rest wavelengths 1273–1293 Å; this is a region free of prominent emission lines and provides a good measure of the QSO continuum (Francis et al. 1991). The peak emission line flux was measured between 6040 Å and 6060 Å (1230–1234 Å in the rest frame of APM 08279+5255) after subtracting the underlying continuum. It can be seen from Table 3 that the contrast of image C relative to A and B is more pronounced in the continuum than in the emission lines; when viewed in the emission line light, images B and C are of comparable brightness.
| Image | Flux (continuum) | Flux (Lyα & N V) |
|---|---|---|
| A | 1.00 | 1.00 |
| B | 0.63 | 0.40 |
| C | 0.23 | 0.38 |
Such spectral differences are a natural consequence of differential microlensing effects, with the small continuum emitting source being more severely influenced by the action of microlensing than the larger line emitting region (e.g. Saust 1994). In fact, it is generally thought that the scale of the broad emission line region is sufficient for it to be immune from significant microlensing influences (Nemiroff 1988; Schneider & Wambsganss 1990), and hence it reflects the magnification due to the macrolens. While unresolved photometric monitoring of APM08279+5255 reveals that this system has exhibited pronounced variability over several tenths of a magnitude (Lewis, Robb & Ibata 1999; see also the continuing monitoring program at the Wise Observatory at http://wise-obs.tau.ac.il/eran/LM/), the spectroscopic evidence presented here points to the variation being potentially due to gravitational microlensing.
Hence, we conclude that the macrolensing magnifications of images B & C, based on the emission lines, are comparable, and it is these that should be used in gravitational lens modeling of this system, rather than the continuum flux. We note that a similar conclusion was reached by Lewis et al (2002) who, based on extended CO emission in this system, demonstrated that the likely lens is a highly flattened object, such as an edge-on spiral. While their model predicted that these images should be the brightness of image A, they do concede that currently there are not enough constraints to uniquely tie-down a model. The magnifications presented in this paper, therefore, will aid in the modeling of this unique ternary gravitational lens system. It is important to note, however, that dust in the lensing galaxy may result in extinction of some of the quasars flux, especially image C which may be viewed through the disk of a spiral system, and the values presented in Table 3 may not truly reflect the magnifications of the macromodel. While dust can extinct the quasar images, it cannot be responsible for the differing line-to-continuum ratios observed in the STIS spectra, and hence the conclusion of gravitational microlensing in this system is robust.
It is also interesting to note that, compared to the emission line flux, while the continuum in image B appears to be enhanced, the continuum in image C appears to be depressed. Such a situation occurs during a microlensing demagnification and is seen dramatically in image D of the quadruple lens Q2237+0305 (Lewis et al. 1998). With such a delineation in microlensing effects, an estimate of the size of the emission regions can be made. Regions significantly smaller than the gravitational microlensing scale-length, the Einstein radius, (i.e. the continuum emitting region) can be significantly influenced during microlensing, while regions significantly larger (e.g. the broad emission line region) are not. The source plane Einstein radius, , is given by
| (1) |
where are the angular diameter distances between an observer (o), lens (l) and source (s). For APM08279+5255, for an cosmology, where is the typical microlensing mass. Of course, confirmation of the gravitational lens nature of these spectral features, and hence the applicability of this delineation scale-length, requires further time resolved spectroscopy. While spatially resolved spectroscopy, as presented in this paper, would be ideal, variability in the equivalent widths of the emission lines should be apparent in unresolved ground-based spectra.
3.3 Where is the lensing galaxy?
The spectra were examined for a signature of the lensing galaxy. The models of Ibata et al. (1999), Egami et al. (2000) and Munoz et al. (2001) all place the lensing galaxy in the close vicinity of the quasar images, although to account for the relative image brightnesses, this lensing galaxy possesses an implausibly large core. Using a flattened potential and explaining the relative image brightnesses as due to the influence of a ‘naked cusp’, Lewis et al. (2002) find that the lens galaxy is offset by arcsec from the quasar images.
The data were examined for evidence of the lensing galaxy. Unfortunately, it was found that it is not possible to place any stringent constraints on the lensing galaxy from these observations. The reason for this is that the PSF model we employed does not give an accurate representation of our observations (the spatial profile of the 51 Peg spectra is not as strongly asymmetric as the profile shown in Figure 1), and it was not possible to subtract off the bright quasar images to better than using that model PSF. By considering the residual luminosity in dark troughs in a Keck HIRES spectrum of this system (Ellison et al. 1999a,b), Ibata et al. (1999) showed that the lensing galaxy must be at least seven magnitudes fainter than image A, so the present constraint contributes no additional useful information.
4 Conclusions
In this paper we have presented spatially resolved spectra of the gravitationally lensed BAL quasar APM08279+5255 obtained with STIS on the HST. They clearly show that each of the three point-like sources are images of the background quasar, confirming that APM08279+5255 represent the first truly odd-image lens system.
An examination of the spectra reveals significant differences in the equivalent widths of the LyN V emission feature between the images. Such differences are naturally explained by the differential magnification influence of gravitational microlensing, which affects the small continuum source but not the larger broad emission line region of the QSO. While further spectroscopic monitoring is necessary to confirm this microlensing hypothesis, unresolved ground-based observations should be adequate for this purpose (as they will still show variations in the equivalent widths of the emission lines).
Finally, the spectra where examined for evidence of the lensing galaxy. While the HST resolution allowed us to extract the spectra of individual quasar images, uncertainties in the point spread function of the instrument limited the accuracy of the subtraction to %. Available imaging and spectroscopy data show that the lensing galaxy must be significantly fainter than 2% of the QSO images, so that we cannot detect it in the present set of observations.
References
- [Bartelmann & Loeb 1998] Bartelmann M., Loeb A., 1998, ApJ, 503, 48
- [Burke 1981] Burke W. L., 1981, ApJ, 244, L1
- [Egami et al. 2000] Egami E., Neugebauer G., Soifer B. T., Matthews K., Ressler M., Becklin E. E., Murphy T. W., Dale D. A., 2000, ApJ, 535, 561
- [] Ellison S. L., Lewis G. F., Pettini M., Sargent W. L. W., Chaffee F. H., Foltz C. B., Rauch M., Irwin M. J., 1999a, PASP, 111, 946
- [] Ellison S. L., Lewis G. F., Pettini M., Chaffee F. H., Irwin M. J., 1999b, ApJ, 520, 456
- [Francis et al.(1991)] Francis, P. J., Hewett, P. C., Foltz, C. B., Chaffee, F. H., Weymann, R. J., & Morris, S. L. 1991, ApJ, 373, 465
- [] Ibata R. A., Lewis G. F., Irwin M. J., Lehár J., Totten E. J., 1999, AJ, 118, 1922
- [] Irwin M. J., Ibata R. A., Lewis G. F., Totten E. J., 1998, ApJ, 505, 529
- [Ledoux et al. 1998] Ledoux C., Theodore B., Petitjean P., Bremer M. N., Lewis G. F., Ibata R. A., Irwin M. J., Totten E. J., 1998, A&A, 339, L77
- [] Lewis G. F., Carilli, C., Papadopoulos, P., Ivison, R. J., 2002, MNRAS, 330, L15
- [] Lewis G. F., Chapman S. C., Ibata R. A., Irwin M. J., Totten E. J., 1998, ApJ, 505, L1
- [Lewis et al. 1998] Lewis G. F., Irwin M. J., Hewett P. C., Foltz C. B., 1998, MNRAS, 295, 573
- [Lewis et al. 1999] Lewis G. F., Robb R. M., Ibata R. A., 1999, PASP, 111, 1503
- [sd] Munoz, J. A., Kochanek, C. S., Keeton, C. R., 2001, ApJ, 558, 657
- [Narasimha et al. 1986] Narasimha D., Subramanian K., Chitre S. M., 1986, Nature, 321, 45
- [Nemiroff 1988] Nemiroff R. J., 1988, ApJ, 335, 593
- [Petitjean et al. 2000] Petitjean P., Aracil B., Srianand R., Ibata R., 2000, A&A, 359, 457
- [Saust(1994)] Saust, A. B. 1994, A&A Supp, 103, 33
- [Schneider & Wambsganss 1990] Schneider P., Wambsganss J., 1990, A&A, 237, 42
- [Srianand & Petitjean 2000] Srianand R., Petitjean P., 2000, A&A, 357, 414