Abstract
In April-May 1998 the blazar ON 231 (W Com, B2 1219+28) showed an extraordinary optical outburst alerted by the Perugia Astronomical Observatory. The source reached the most luminous state, observed at least since the beginning of the previous century. BeppoSAX observed ON 231 in the band from 0.1 up to 100 keV, detecting an X-ray spectrum with a peculiar concave profile, that could be considered as a signature of the intermediate blazar subclass. The spectral energy distributions (SED) of blazars were studied with a time dependent synchrotron self-Compton (SSC) model, tested here on this object. Even with the preliminary “toy” model of a single flaring region, emitting by means of mere SSC process, the X-ray spectrum is reasonably reproduced. The SED was calculated with a hard spectrum of the injected electrons and with other physical parameters comparable to previous works, validating a base consistence of the method.
1 Introduction
The overall spectral energy distribution (SED) of blazars show a two-bump structure where the lower frequency hump is peaked either in the IR/optical (low frequency peaked LBL or “red” blazar) or in the UV/X-ray bands (high frequency peaked HBL or “blue” blazars), (Padovani & Giommi 1995, Ghisellini et al. 1998, Urry 1999) and is believed to be produced by synchrotron emission, while the higher frequency component should be given by inverse Compton (IC) scattering. Synchrotron radiation and IC scattering was usually interpreted as due to diffusive shock acceleration of charged particles within a plasma jet, which itself moves at relativistic speed and point toward the observer. ON 231 is one of the best examples in which both the synchrotron decline tail and the further rise of the IC bump in the broadband spectrum, were observed simultaneously at the X-ray wavelengths. The consequent concave shape of the X-ray spectrum detected by BeppoSAX (Tagliaferri et al. 2000) could be the important signature of the intermediate blazar subclass (i.e. the transition from LBL to HBL). Detailed studies on intermediate objects are fundamental to probe the continuous spectral sequence of blazars “flavours” resulting from the source power dependence and from the distribution of the intrinsic physical parameters (Fossati et al. 1998).
2 The outburst of April-May 1998
The blazar ON 231 (W Com, B2 1219+28; z=0.102) was one of the first radio sources classified as a classical BL Lacertae object (Biraud 1971; Browne 1971). Perugia Observatory, equipped with a 0.4 m robotic telescope (Tosti et al. 1996), since 1994 is carrying out an intensive optical monitoring of ON 231. The optical flux was at an higher level respect to historical mean value, showing in each season a superimposition of many flares with different amplitudes and time ranges (Tosti et al. 1998). In April 1998 the source had an extraordinary outburst (Massaro et al. 1999) and reached the highest brightness level ever recorded since the Wolf’s discovery of the optical counterpart (Wolf 1916). In the maximum phase the magnitude of ON 231 was R(Cousins)=12.2 (density flux mJy, or erg s-1 cm-2, corrected for Galactic extinction). The linear optical polarization also increased suddenly, giving evidence of the pure non-thermal origin of the flare. 1999 VLBI maps displayed a new prominent two-sided structure, suggesting a relation between the optical enhanced activity and changes in the innermost radio structure (Massaro et al. 2001). The subsequent optical behaviour showed a slow decline in the mean luminosity (Tosti et al. 2002). BeppoSAX observed ON 231 in May 1998 with a good sensitivity and spectral resolution, following the extraordinary optical outburst and detecting the unexpected hollow X-ray spectrum between the two bumps of the SED. This data was used to test and probe the parameter plausibility and the robustness of a mere synchrotron self-Compton (SSC) time-dependent model. In fact this spectrum shape is difficult to fit for a preliminary “one–zone–one–process” implementation, without any external IC contributes.
3 Model and simulations
An electron plasma confined by a magnetic field into a non-thermal flaring knot in blazar jets, can be described, in accord to a statistical reduced description, with a density operator or a one–particle distribution function giving the particle number density in the phase space. An appropriate truncation of the exact kinetic relations and a diffusion approximation for system of particles moving under stochastic forces that keep producing small changes in particles dynamics can used to further simplify the kinetic equations (Chandrasekhar 1943). Taking an isotropic and space homogeneous distribution function and integrating in volume and angular momentum-space coordinates, the dependency from pitch angle, spatial and spherical momentum–space coordinates can be removed. Thus may be used a simple one–dimensional and modified Fokker–Planck equation for the number particle density [cm-3] (Lorentz is the dimensionless factor) in order to describe the time–dependent evolution of the electron distribution in the flaring volume. This equation can be though as a random walk in the energy space of electrons and can be written as
| (1) |
where represent the sum of the various energy diffusion coefficients; is the advective term contains energy gains and losses; is the probability of particle disappearance by escape, [cm-3 s-1] is the source term, while is a scaling factor for the volume element. The solutions of this type of equations are very sensitive to initial and boundary conditions and to injection and losses forms.
In this preliminary SSC model, a single homogeneous one–particle plasma region was considered (as done in Chiaberge & Ghisellini 1999), subordinated to injection of accelerated relativistic electrons with a power-law energy distribution and to pure radiation cooling. An uniform tangled magnetic field B was considered, even if a superposed small-amplitude plasma turbulence (Böttcher et al. 1997), needs to be implemented for more realistic simulations. The ensemble synchrotron spectrum was integrated by the calculated electron distribution at any given time. The IC spectrum result as the interaction of the energetic electron distribution with the synchrotron photons using a standard technique (Band & Grindlay 1985, Li & Kusunose 2000). The produced spectra were transformed to the observer using the Doppler beaming factor (where is the bulk Lorentz factor of the emitting region, the angle respect to the observer) and using the luminosity distance of the source.

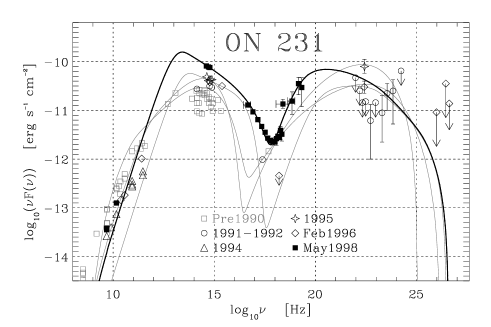
The concave X-ray spectrum of ON 231 measured from 0.1 keV up to 100 keV by BeppoSAX in May 11-12, 1998, and the simultaneous optical multiband data of Perugia Observatory (May 11 , May 12 ) was fitted with the physical parameters reported in the caption of Figure 1, that are in rough agreement with the value calculated in the paper of Tagliaferri et al. (2000). Only the flaring region dimension was taken almost one order of magnitude greater than the value reported in the paper. A single no-break power-law for the injected electron energy distribution is able to reproduce the X-ray spectrum, with a very steep power index ( between and ). This reflects the common behaviour of harder injection spectrum during flaring states. The steeper index counterbalances the larger volume of the flaring region, giving the same global energetics. The IC gamma–ray part of the SED is into some limits and detections of EGRET in 1991–1992 and February 1996, even if this data are indeed weak constraints for the May 1998 behaviour. A weakest point of the simulation, could be the predicted relevant synchrotron peak at mid–IR wavelength, because it assumes a flux much higher than the unique available far–IR data (IRAS) about ON 231. On the other hand this could be the result of the April exceptional outburst that raised the non-thermal IR-optical-UV synchrotron continuum to the highest level recorded since the beginning of the previous century ( mJy in band in April 23, 1998). This is witnesses by the flattest optical spectral distribution ever observed during the maximum (Massaro et al. 1999), that may be extended to IR wavelengths. The subsequently faster cooling of the optical emission respect to the mid–IR photons, should have dropped the optical flux until the photometric values registered almost 20 days later, contemporary with the SAX detections, while a larger amount of infrared flux could have survived for more time.
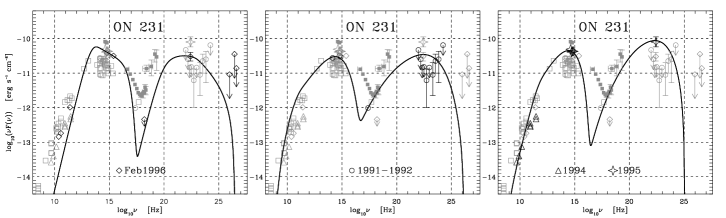
At longer wavelengths the “toy” model of a single flaring blob, with this hard injection, do not reproduce the spectrum, probably due also to stationary radio–emission in the the underlying jet. In Figure 2 is shown an example of plain cooling, plus escape, temporal evolution for the May 1998 SED and the 1991-1992 spectrum (see Figure 3), calculated by the time–dependent simulation. In Figure 3 are displayed three spectra for simultaneous data of February 1996 and for other not contemporary observations. Here the profiles of the SED are more similar to the HBL spectrum shapes, generally simpler to simulate with a plain SSC model. All this other SEDs passes through the IRAS data and were produced with plausible parameters. The model seems physically acceptable also in this cases, even if this data have a little means, compared to the strict constraints given by the excellent observations of BeppoSAX.
References
- 1 Band, D. L., Grindlay, J. E. 1985, Astrophys. J. 298, 128
- 2 Biraud F. 1971, Nature 232, 178
- 3 Böttcher M., Mause H., Schlickeiser R. 1997, Astron. Astrophys. 324, 395
- 4 Browne I.W.A. 1971, Nature 231, 515
- 5 Chandrasekhar S. 1943, Rev. Mod. Phys. 15, 1
- 6 Chiaberge, M., Ghisellini, G. 1999, Mon. Not. R. Astr. Soc. 306, 551
- 7 Fossati G., Maraschi L., Celotti A. et al. 1998, Mon. Not. R. Astr. Soc. 299, 433
- 8 Ghisellini G., Celotti A., Fossati G. et al. 1998, Mon. Not. R. Astr. Soc. 301, 451
- 9 Li H., Kusunose M. 2000, Astrophys. J. 536, 729
- 10 Massaro E., Maesano M., Montagni F. et al 1999, Astron. Astrophys. Lett. 342, L49
- 11 Massaro E., Mantovani F., Fanti R. et al. 2001 Astron. Astrophys. 374, 435
- 12 Padovani P., Giommi, P. 1995, Astrophys. J. 444, 567
- 13 Tagliaferri G., Ghisellini G., Giommi P. et al. 2000, Astron. Astrophys. 354, 431
- 14 Tosti G., Fiorucci M., Luciani M. et al. 1998, Astron. Astrophys. Suppl. Ser. 130, 109
- 15 Tosti G., Massaro. E., Nesci R. et al. 2002, Astron. Astrophys., submitted
- 16 Tosti G., Pascolini S., Fiorucci M. 1996, Publ. Astr. Soc. Pacific 108, 706
- 17 Urry, C. M. 1999, Astropart. Phys. 11, 159
- 18 Wolf M. 1916, Astron. Nach. 202, 415
- 19