High Velocity Cloud Edges and Mini-HVCs
Abstract
Arecibo mapping is reported of the neutral hydrogen distribution along selected directions out from the centers of two examples of small High Velocity Clouds (HVC). One HVC (W486) is selected from the class of Compact HVCs (CHVCs) thought by some researchers to be good candidates for having distances characteristic of the Local Group; the other (W491) is a bit more extended and possibly nearer. Both HVCs have a small inner region where the neutral hydrogen column density decreases slowly and a larger outer region where declines more rapidly, smoothly and exponentially from down to . Line widths, and presumably temperature and turbulence, do not increase in the outermost regions. Therefore pressure decreases smoothly, making confinement by dark matter gravity more likely than confinement by external pressure.
The more extended HVC, W491, has a superimposed small cloud (which we dub a “mini-HVC”), offset by in velocity along the line of sight. The peak column density of the mini-HVC is about . Preliminary data toward future mapping of two more HVCs reveals two more mini-HVCs of similarly small size and central column density a bit less than , offset by an even larger velocity, . We suggest that these three mini-HVCs are not physically associated with the HVCs on which they are superimposed, but are either very small outlyers of the extended Magellanic Stream HVC complex or more distant and/or smaller isolated CHVCs.
The importance of the edge column density , the value of at the point where the neutral and ionized column densities are equal, is discussed. With for the two mapped HVCs, the angular scalelength of the total hydrogen is appreciably larger than the observed H I scalelength. Previous distance estimates, related to absolute size and mass of the total hydrogen cloud, may have to be scaled down because of the undetected, more extended ionized hydrogen.
1 Introduction
This paper is mainly concerned with Arecibo111The Arecibo Observatory is part of the National Astronomy and Ionosphere Center, which is operated by Cornell University under a management agreement with the National Science Foundation. H I observations of two High Velocity Clouds (HVC) and three smaller high velocity features found serindipitously. While there is controversy about the location and nature of the various types of HVCs (Richter et al., 1999; Wakker et al., 1999; Putman et al., 2002; Richter et al., 2001), the Compact HVCs (CHVCs) as defined by Braun & Burton (1999) are thought by many researchers to be metal-poor and associated with the Local Group of galaxies as a whole rather than with the immediate vicinity of the Milky Way disk (Blitz et al., 1999; Braun & Burton, 1999, 2000, 2001; Putman et al., 2002). Even if this hypothesis is correct in general, there is still controversy as to whether distances to the CHVCs are mostly of order 650 kpc to 1 Mpc (about the distance to Andromeda) or of order one-third that value (still affiliated with the Local Group, but closer than its barycenter). One of the two selected HVCs is a fairly typical CHVC; the other is somewhat more extended. We shall use the term CHVC throughout for clouds such as both of these, extending the definition of Braun & Burton (1999) to include more extended — and possibly closer — sources.
The H I mapping of the two CHVCs reported here gives data relevant to three questions: (1) Does the column density decrease roughly exponentially below atoms , or is there a sudden change in slope somewhere between and atoms ? (2) Are the cloud edges relatively smooth or severely corrugated on scales? (3) Does the gas temperature and/or turbulence increase at the outermost points, as might be expected if the clouds are surrounded by an outside very hot medium? The present data does not address a fourth question: How asymmetric are the clouds? The three observational questions are related to the following theoretical controversies.
A few bright spiral galaxies have been mapped in H I with good sensitivity to large radial distance from the center. These show an “outer H I edge” in the sense that the exponential decrease of the neutral hydrogen column density (as distinct from the total hydrogen column density ) shows a sudden steepening beyond some radius (Corbelli, Schneider & Salpeter, 1989; van Gorkom, 1993). The rapid decrease in outside the edge is due to a rapid increase in the ionized fraction of hydrogen, in agreement with theoretical models (Corbelli & Salpeter, 1993; Maloney, 1993; Dove & Shull, 1994). We shall denote the theoretical value of the edge column density, defined as the neutral gas column density in the region where the neutral and ionized fractions are equal, as . The value of is close to the observed column density where the H I scalelength decreases rapidly, although the exact relation depends on the assumed morphology of gas and dark matter and on the spectrum of the external ionizing flux. For galaxies is and the central column density is orders of magnitude larger, so the observed scalelength far inside the edge gives a reliable value for the scalelength everywhere. Incidentally, observations of Lyman Limit Systems at intermediate redshifts give an independent estimate of (Corbelli, Salpeter & Bandiera, 2001), which is similar (slightly larger than atoms , but the UV flux at that time was also larger).
Qualitatively similar arguments must apply to the hydrogen in CHVCs (earlier claims of some “sharp” edges on - scales are reviewed by Wakker & van Woerden (1997)). However, the value of (and the observed edge column density, close to that value) depends on gas density and on the ionizing flux, and could therefore be different for CHVCs. If were appreciably smaller for a CHVC than for a galaxy (as in question 1 above) one could again get the scalelength from the observed scalelength. However, we shall see that is also typical for CHVCs, but that the central column density is larger by only a factor of a few and the small intervening region is further complicated by the transition from cold to warm neutral hydrogen (Braun & Burton, 2000). As a consequence, the observed H I scalelengths and masses may or may not greatly underestimate the size and mass of total hydrogen. Numerical modelling will be needed to settle this issue, but we give some conjectures in Sect. 5.
Murphy, Lockman & Savage (1995) and Lockman et al. (2002) (We shall refer to these papers jointly as the “Murphy-Lockman Survey,” abbreviated MLS.) report that 37% of sightlines to quasars (randomly selected with respect to known HVCs) show H I emission at velocities typical of HVCs, with column densities atoms and above when averaged within the beam of the Green Bank 43m telescope. Such column densities are far below the suggested atoms , and most of the hydrogen must be ionized if the column density is uniform over the beam. While most of the MLS sources are evidently extended outskirts of major HVC complexes, a few of the more isolated sources might be highly clumpy, consisting of much smaller “mini-HVCs” which have central column densities closer to than to atoms but which cover much less than the full beam. We hope to map (with Arecibo resolution) some of the more isolated MLS sightlines in the future, but serendipitously our present observations have found three “mini-HVCs” with angular sizes larger than the Arecibo beam but smaller than .
Our Arecibo mapping procedures are detailed in Sect. 2. Results are presented in Sect. 3 for W486 and W491 and in Sect. 4 for the three mini-HVCs. The CHVC distance controversy is discussed in Sect. 5, along with the relation of the mini-HVCs to that controversy, likely values of , and the question of pressure vs. gravity confinement. Sect. 6 restates our conclusions succinctly.
2 Arecibo Observations
We selected two HVCs from the compilation of Wakker & van Woerden (1991) for study: one object, entry number 486 (hereafter referred to as W486) in that list, is considered a typical Compact HVC (CHVC) by Braun & Burton (1999); a map at the resolution of the Dwingeloo 25 m radio-telescope was given there. The second HVC, W491, is somewhat more extended and possibly nearer, but more likely to have properties similar to the CHVC than to the large complexes. Throughout this paper we will broaden the definition of the term CHVC beyond the strict definition of Braun & Burton (1999) to include somewhat larger and somewhat less isolated HVCs like W491 — all HVCs that are not more than in diameter as listed in Wakker & van Woerden (1991) and not clearly associated with any of the major complexes. A map of W491 using the NRAO 43m telescope was given by Wright (1979). W486 is part of Wakker & van Woerden’s Anti-Center Very High Velocity (ACVHV) complex in Population AC (clouds near the Galactic anticenter with ) while W491 is a member of Population EN (extreme negative-velocity clouds that are not associated with the Magellanic Stream nor the Galactic Center nor Anti-Center populations). Both have , well removed in velocity from emission from the Galactic disk. Both are at southern Galactic latitudes and were observed during nighttime at Arecibo in order to have the quietest possible spectral baselines.
Observations were conducted in July/August 1999 and August 2000. We used the Gregorian feed system with the “L narrow” receiver in total power (position-switched) mode, with 3.05 kHz (about ) channel spacing. The reference beams trailed the on-source beam positions by in right ascension ( at the declinations of these sources), in all cases well outside the contours of the clouds in the available lower resolution maps. Calibration was accomplished by observing several continuum sources from the VLA calibrator list, chosen to have small size compared to the beam. In addition, we reobserved a few spiral galaxies for which we had high signal-to-noise pre-upgrade H I measurements and which were known to be in extent. After calibration, each spectrum was baselined and smoothed with a Savitsky-Golay filter.
Short-integration mapping a few beamwidths around the nominal HVC centers served to locate the highest column density cores of the clouds more precisely. Armed with that information, we proceeded to map along a straight line (i.e., a “spoke,” analogous to a spoke of a wheel) from the center toward the nearest edge of each cloud (as indicated in the coarser maps cited above) with beam positions separated by a beamwidth. Integration times ranged from 5 min ON at inner positions to 50 min ON at the outermost positions, approximately from the center. To set limits on possible sidelobe contributions, we first mapped several bright continuum sources of negligible extent at declinations comparable to those of our two HVC, then observed beam positions with perpendicular separation from the positions along the spoke, as indicated on Fig. 3 for W486. (Fig. 5 shows the points to the west of the spoke for W491; corresponding points to the east are not shown.) This placed the off-spoke points near the peak of the first sidelobe ring for the next outermost point on the chosen spoke. In the follow-up mapping, conducted in August 2000, we added more points off-spoke in both directions for W486 (shown in Fig. 3 below), to investigate how corrugated the edge might be at the atoms level, and we mapped the full extent of a cloudlet (“mini-HVC” in the language of the Introduction) discovered superimposed on the western off-spoke points for W491 (see Fig. 5 below).
The sidelobe was found to peak at a level of dB on average, in a slightly elliptical ring about in diameter, with the minimum between the main beam and the sidelobe being similarly elliptical, about in diameter (see also Heiles et al. (2001)). The strength varies considerably with azimuth and zenith angle, however; in some orientations the maximum sidelobe response is as high as dB, in others the response is below dB. On average (appropriate when repeated scans on each point occur in different orientations of the Gregorian subreflector), each octant of the sidelobe ring contributes about 4.7% of the response of the main beam, each sextant about 6.2%. For a complete map, these figures would allow us to approximately subtract sidelobe contributions iteratively. Since we do not have complete maps of these clouds, we estimated sidelobe contributions by assuming approximate symmetry about the centers of the clouds. In this way, we determined that the first sidelobe ring contributes about 20% to each spectrum (i.e., about half the response it would give for a completely uniform source much more extended than the sidelobe ring) for these observations. Since reduction of each flux by a fixed percentage does not affect the derived scalelength, and to avoid compounding uncertainties, we present the spectra without any correction for sidelobes.
“Far” sidelobes (i.e., all those beyond the first sidelobe ring discussed above, including what is sometimes called “stray radiation”), due to scattering off the triangular platform and the support cables as well as diffraction through the partially blocked aperture, are known to exist (Perillat & Howell, 2001). In at least one pathological orientation of the Gregorian subreflector, there is a spot in the “far” sidelobes which rises almost to the level of the first sidelobe ring. However, in most orientations the “far” sidelobes are down by at least another 3 or 4 dB from the first sidelobe ring. The average integrated response of the “far” sidelobes is unknown at this point. For observations on the outskirts of a very strong source like DDO 154, “far” sidelobes can contribute noticeably (Hoffman et al., 2001) in integrations as long as the ones employed here. The core of W491 is weaker by a factor of 5 than DDO 154, that of W486 by a factor of 10. That should reduce the “far” sidelobe contributions to the noise level in these observations, except in pathological orientations.
3 Results for the Targetted HVCs
3.1 W486 = CHVC 39 = HVC 158-39-285
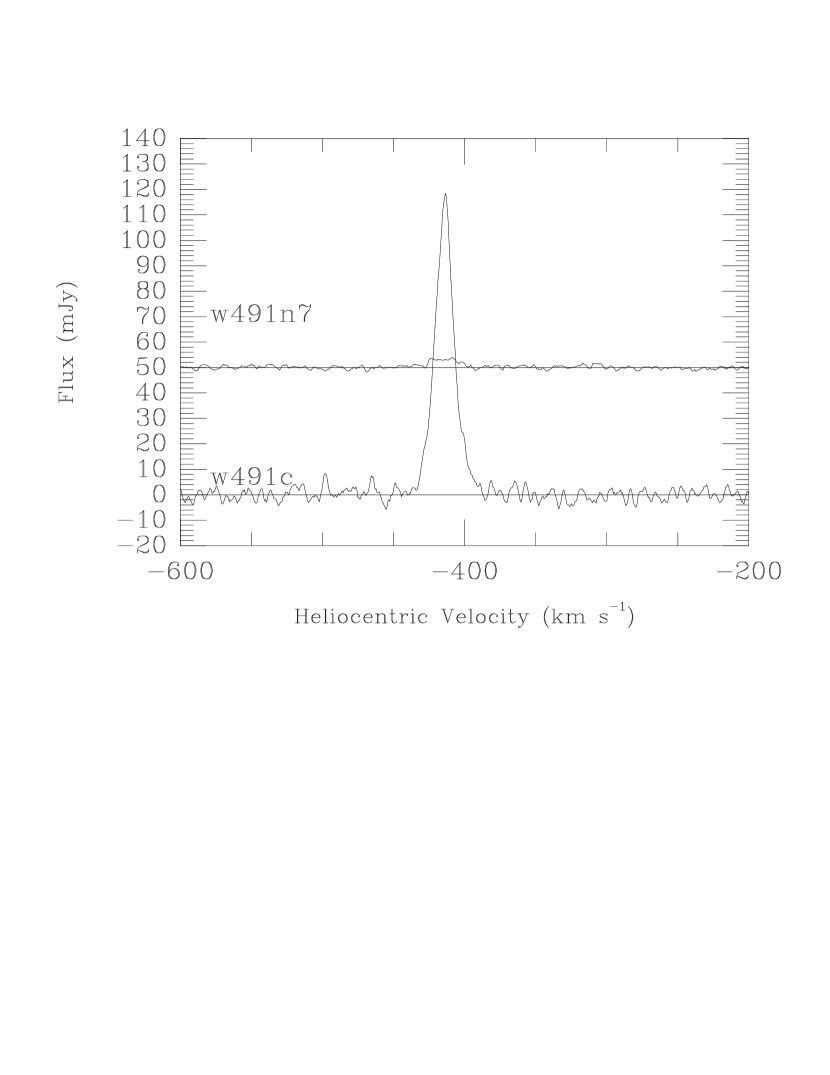
Representative spectra for the CHVC W486 (with no correction for sidelobes) are shown in Figure 1. The figure includes a spectrum (labelled W486C — C for “center”) from the core of the cloud, integrated 5 min ON, and one (labelled W486R7 — R7 for “seventh beamwidth out along the radius”) from a point out from the core along the mapped spoke. The latter was integrated 50 min ON and has rms noise 0.7 mJy after smoothing, typical of the outermost spectra on each cloud. The displacement in velocity by is characteristic of the trend along the spoke: profile center velocities (defined to be the midpoint between the points at 50% of peak on either side of the feature) rise monotonically from (heliocentric; , , ) at the core to at the outermost points. Whether this represents systematic rotation or a shear (tidal or otherwise) remains to be determined, but Braun & Burton (2000) report similar velocity gradients for the cores of the six CHVC they have mapped at Westerbork. Velocity corrections to GSR and LGSR follow the conventions of Braun & Burton (1999). Profile widths (FWHM) remain essentially constant along the spoke, ranging between 23 and for the core through R6. The outer, noiser points appear slightly broader (The spectrum from a point 7 beamwidths out from center measures FWHM) but that is likely to be an artifact of the noise.
The neutral hydrogen column density along the mapped spoke is shown in Fig. 2. It is fairly constant near for about out from the center, then tails off smoothly and exponentially from down to at a radius of . Sidelobe corrections, if we could apply them accurately, might shift all points downward by 0.10 in with no significant change in slope. The scalelength is . That is a bit smaller than might be inferred from the constant declination cut presented by Burton, Braun & Chengalur (2001a), consistent with our choice of mapping along the spoke with the greatest gradient in column density as suggested by the map of Braun & Burton (1999) and confirmed by the more detailed map of Burton, Braun & Chengalur (2001a). The steady shift in centroid velocity of our profiles is consistent with the velocity field for the higher column density parts of the cloud in Burton, Braun & Chengalur (2001a). There are no signs of the outer edge being broken up into cloudlets on the scale of the Arecibo beam ().
The fluxes, integrated over velocity, for each observed beam position are shown in Fig. 3. Each observed point has been convolved with a beam, and each beam position is marked by a small cross. The greyscale is logarithmic. Some asymmetry perpendicular to the chosen spoke is evident, and the edge is not perfectly smooth, but the beam-to-beam variations perpendicular to the spoke do not exceed a factor of a few.
3.2 W491 = HVC 102-40-409
Representative spectra for W491 (no correction for sidelobes) are shown in Fig. 4. The centroid velocity is , , , . In this case no systematic velocity gradient is evident along the chosen spoke although the profile width increases slightly, from at the center of the cloud to at a point out, and then remains approximately constant at from that point on out. The narrower profiles at the core of the cloud are consistent with there being a cold core similar to those observed with synthesis arrays for other CHVCs (Braun & Burton, 2000).
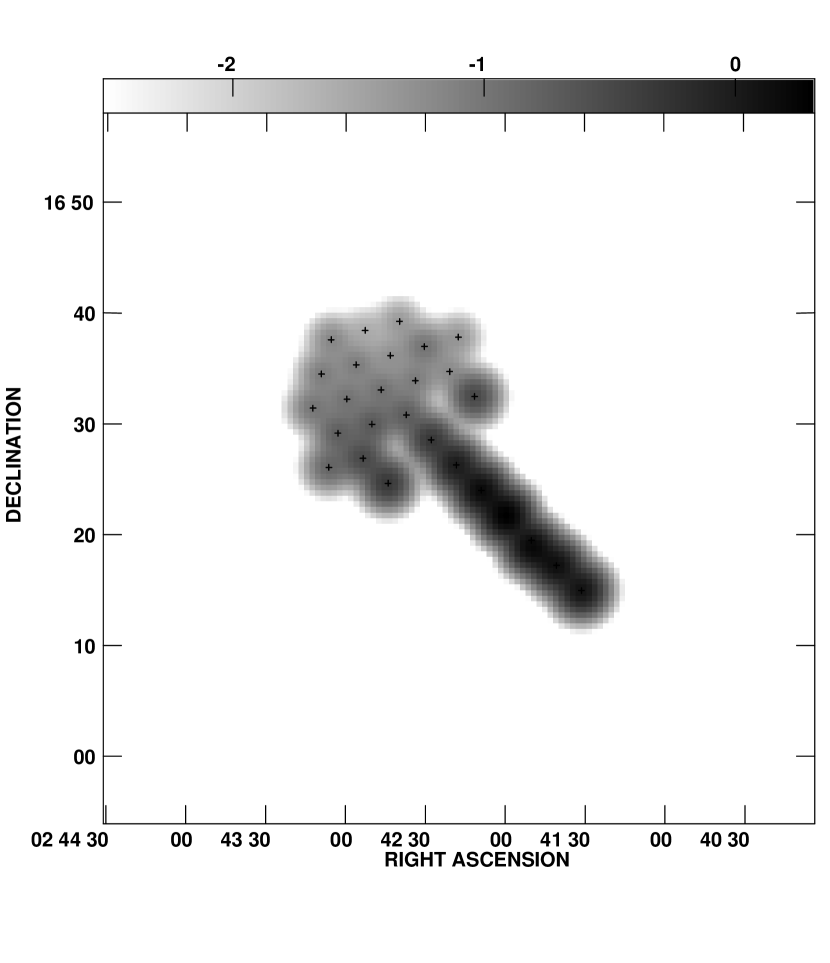
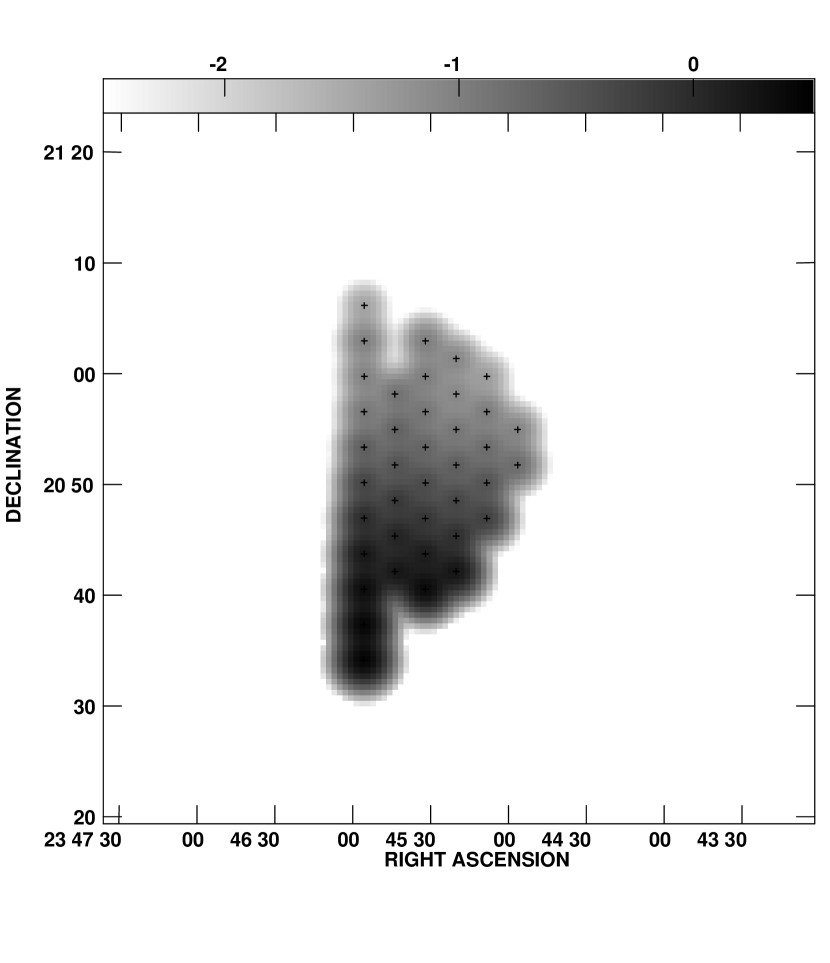
The fluxes, integrated over velocity separately for the main cloud and the mini-HVC discussed below, are shown in Fig. 5. Convolution and greyscale are the same as for W486 (Fig. 3). For the main cloud we were not able (due to time constraints) to map to as low a column density over as wide a range of positions as for W486, but as best we can tell there are no significant corrugations of the portion of the edge that we have mapped.
The column density vs. radius for the main cloud of W491 is shown in the righthand panel of Fig. 2. The central region has nearly constant column density, with a slow decline from to . After that the decline is more rapid; it is not quite so smooth as for W486, but it is still best characterized as exponential from down to the lowest column density observed, just less than , with a slightly larger scalelength . In detail, on the chosen spoke the decline is more nearly exponential, with a scalelength of , to , then there is a wide plateau before the decline resumes with approximately the same scalelength as before. A better sense of the decline can be gotten from Fig. 6, in which the column density for the main cloud alone (i.e., excluding the velocity range in which the mini-HVC appears) is plotted as a function of the distance from our fiducial cloud center as if the cloud were spherical. Here the point to point variations wash out the “plateau,” leaving on average a simple exponential decline with a scalelength of about . There are no indications of corrugation of the edge of W491 either. As for W486, sidelobe corrections would shift all data points downward by 0.1 in without significantly changing the derived scalelength.
4 Low Column Density Mini-HVCs
4.1 A Mini-HVC Superimposed on W491
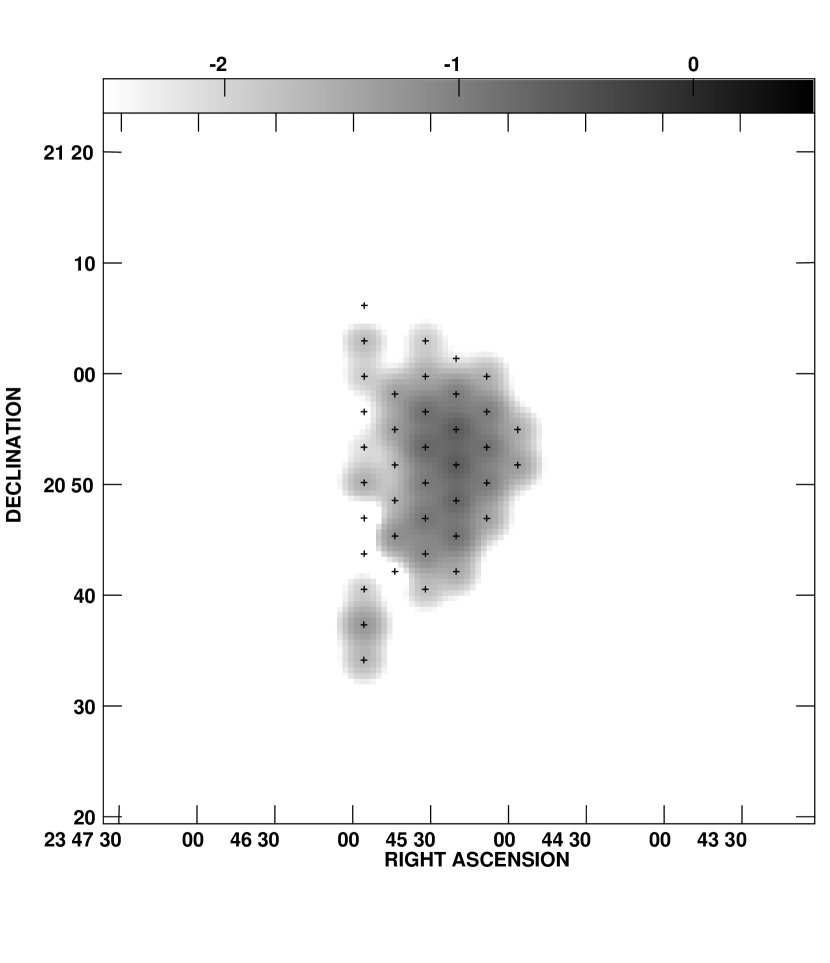
Points to the west of the spoke mapped in W491, observed to check sidelobe contamination, exhibited emission displaced higher in velocity. The emission shows up as a distinct feature (see Fig. 4, righthand panel) in every spectrum in which it appears since both the main cloud and the mini-HVC have quite narrow profiles ( and at 50% of peak, respectively, at positions where the mini-HVC appears). We can trace the signal contiguously over a roughly elliptical shape, in extent, aligned very nearly NS as shown in the righthand panel of Fig. 5. There is no trace of signal at this position and velocity in the less-resolved and less sensitive Leiden/Dwingeloo Survey (Hartmann & Burton, 1997). Nor does it appear in the map published by Wright (1979), based on NRAO 43m data. We shall call this small cloud, displaced in velocity from the chosen CHVC, a “mini-HVC” no matter whether it is a part of some other extended HVC complex or a distinct smaller or more distant CHVC.
Column density as a function of radius is shown for the mini-HVC in Fig. 7. The center is taken to be the point for which the spectrum is shown in Fig. 3 (right-hand panel), which is close to the point of highest column density in the cloudlet. Spokes in different directions, spaced by , are shown with different symbols. Upper limits are shown in the figure by downward arrows. Our spatial resolution is poor, but as best we can tell the column density falls exponentially in all directions, from a peak to in 8 or . The H I scalelength along the major axis is thus of order , slightly smaller than for the CHVCs W491 or W486 themselves. Both the peak column density and the extent of the mini-HVC are much less than those for the CHVCs, so sidelobe corrections should not exceed the noise in the spectra for the mini-HVC.
4.2 Two More Mini-HVCs
In preliminary data for future mapping of two more small HVCs, we have uncovered two additional mini-HVCs, both superimposed on W479 = HVC 132-37-334. The peak column densities are for each, a bit higher than for the mini-HVC superimposed on W491. The angular displacements from the center of W479 are and ; the angular sizes are comparable to that of the mini-HVC superimposed on W491 although we will need mapping with longer integration at each point to know the full extents. Each has heliocentric velocity (, , ), above the velocity of W479 itself. The profile widths (at 50% of peak) are about , comparable to that of the W491 mini-HVC. The preliminary mapping of W413, the second of those two additional HVCs, did not reveal any mini-HVCs with peak column density .
Fig. 8 plots heliocentric velocity as a function of the angle between the line-of-sight and the direction to the Local Group center, for our four CHVCs and the three mini-HVCs. The four CHVCs were chosen for their particularly large negative velocities (and, indirectly, small ). The three mini-HVCs all have appreciably less negative velocities than the CHVCs, and we think it is likely that they are chance superpositions rather than physical associations. The radial components of their velocities are close to that for the end of the Magellanic Stream (which Lockman et al. (2002) and Stanimirović et al. (2002) argue is more extended than previously thought), but also close to that of the Local Group barycenter, with deviations of only , , and , respectively.
The area on the sky of each mini-HVC is about one-tenth that of a typical CHVC ( vs. or more). The average of the peak column density is about one-fifth that of an average CHVC, vs. . The three mini-HVCs in total cover about 10% of the area we have mapped so far in studying the four HVCs. As mentioned, these three cloudlets could be either distant and/or smaller CHVCs or some small structures associated with extensions of the Magellanic Stream. The latter possibility is perhaps more likely, partly because of the low central density and partly because of the greater extension of the Magellanic Stream mentioned above.
5 Discussion
5.1 Edge Column Density and Ionized Hydrogen
We have defined the edge column density, , as the column density of neutral atomic hydrogen where the neutral and ionized column densities are equal. As mentioned in the Introduction, is of order for nearby spiral galaxies, as observed by the shortening of the scalelength when and confirmed by theoretical modelling (Corbelli & Salpeter, 1993; Maloney, 1993; Dove & Shull, 1994). Theoretical models have also been carried out for gas clouds representing Lyman Limit Systems (Corbelli, Salpeter & Bandiera, 2001; Corbelli & Bandiera, 2002). The middle curve of Fig. 3 in Corbelli, Salpeter & Bandiera (2001) shows a likely relation. Their analysis of the distribution function for at intermediate redshifts gave a value of only slightly larger than for nearby galaxies, which may reflect the increase of the extragalactic UV flux with redshift. As shown in Fig. 2 for the two CHVC main clouds which we mapped in detail, W486 and W491, there is a change of slope near in the H I column density as a function of radius, and drops smoothly and approximately exponentially from to . Discounting the unlikely possibility of , a value of near is thus likely for CHVCs, similar to that for galaxies and Lyman Limit Systems.
With the hydrogen at the center of W486 and W491 is mostly neutral, but further out the undetected contribution of ionized hydrogen is uncertain and likely to be large. In the absence of explicit numerical modelling, we have estimated as follows: We adopt the relation for almost spherical clouds from Corbelli, Salpeter & Bandiera (2001), using the middle curve of their Fig. 3 which corresponds to . We can then construct a curve for vs. radius from our Fig. 2 or 6 out to radius . With these theoretical assumptions, we estimate that the scalelength for total hydrogen is 3 or 4 times larger than the observed scalelength for H I ( for W491). Allowing for the mostly neutral core (radius ), we estimate a larger total mass . For comparisons with structure formation calculations, the ratio of baryon mass to dark mass is important. This is now times larger than estimates in the literature which use only . For comparison with Lyman Limit Systems, the radius where drops to is important (Charlton, Churchill & Rigby, 2000). Using the same relation, we estimate this to be compared with the observed radius in Fig. 2.
The increases in scalelength and mass to account for the unobserved ionized hydrogen, as estimated above, are uncertain and may not be quite as large for typical CHVCs which tend to have larger central than W486 and W491, but the increases are still likely to be appreciable. The earlier papers on the CHVC distance scale (Blitz et al., 1999; Braun & Burton, 1999, 2000; Burton, Braun & Chengalur, 2001a, b) showed that typical distances to 1 Mpc led to physical scalelengths and baryon fractions consistent with those for dwarf galaxies if ionized hydrogen were neglected. The scalelength and baryon fraction both scale as , so the increase from H I to will give consistency for somewhat smaller distances . The scarcity of starless gas clouds in other galaxy groups (Zwaan, 2001; Zwaan & Briggs, 2000; de Blok et al., 2002) has been used as an argument against kpc. The shortening of the distance scale, along with some recalibration, tends to remove the discrepancy (Braun & Burton, 2001; Putman et al., 2002). Similarly, arguments about distant CHVCs contributing too many Lyman Limit Systems (Charlton, Churchill & Rigby, 2000) are ameliorated by a shorter distance scale.
5.2 Confinement, Clumpiness, and Other Uncertainties
There is still some controversy as to whether HVCs, CHVCs in particular, are confined by dark matter gravity or by pressure from an external very hot gas. Both our observations of CHVCs and those by Burton, Braun & Chengalur (2001a) have shown that (i) decreases smoothly and appreciably with distance from the cloud center, and (ii) linewidths (and hence thermal plus turbulent energy) do not increase with . The total gas pressure therefore decreases with , as it should if the cloud is confined by dark matter gravity, in contrast to the constant pressure that pressure equilibrium would produce. The thermal conductivity of an external very hot gas is still controversial (see Narayan & Medvedev (2001)), but confinement by hot gas might also heat and perturb the outer layers of a CHVC too much.
The importance of ionized hydrogen would be less if the H I in HVCs were highly clumpy, so that much of the overall cloud area had very low column density (see Charlton, Churchill & Rigby (2000)). For W486 and W491 we have not found any strong irregularities on the scale of , which is quite a bit smaller than the cloud diameters. Braun & Burton (2000) and Burton, Braun & Chengalur (2001a) also do not find very pronounced holes. Thus, strong clumpiness is not likely to be important for column density distributions in the HVCs that have been mapped to date, although volume density fluctuations on smaller scales cannot be excluded.
For the main portions of the extended HVC complexes, is larger than for CHVCs and the contribution from ionized hydrogen should be unimportant. On the other hand, the sources described by Murphy, Lockman & Savage (1995) and Lockman et al. (2002), while mostly outlyers of extended HVC complexes, mostly have , and ionized hydrogen is likely to dominate over the neutral phase. A small number, up to 7%, of these sources seem to be smaller than the beam and might be small enough for the actual central to be of order or only slightly smaller, similar to the three mini-HVCs described above. Such compact sources contribute little to the total gas mass, and even less to obscuration of UV from quasars, but their distribution function is important whether the sources are isolated or extensions of HVC complexes. Better statistics in this range of could pin down a global value of the edge column density or find evidence for variations in (see the discussion in Corbelli & Bandiera (2002)). The value of may well vary from place to place because the flux of ionizing radiation may vary for two reasons: (i) More than 37% of directions on the sky have above (unit UV optical depth at the Lyman edge — Murphy, Lockman & Savage (1995)), so the extragalactic flux may be highly obscured in some places and less so in others; and (ii) in some galaxy group environments the extragalactic ionizing UV flux may be greatly enhanced by some UV leaking out of galaxies (Bland-Hawthorn, Freeman & Quinn, 1997; Castellanos, Díaz & Tenorio-Tagle, 2002; Ciardi, Bianchi & Ferrara, 2002).
Quite apart from the CHVC distance controversy, it is puzzling why there are so few starless clouds compared with dwarf galaxies in other galaxy groups if is universal: is then much less than the minimum for star formation to occur, and one should expect there to be hydrogen clouds with a few times larger than , mostly neutral and easily detected, but starless. The puzzle could be relieved if were appreciably larger in many galaxy groups, since most clouds would be either highly ionized or rich in stars.
6 Conclusions and summary
High sensitivity Arecibo mapping along a radial spoke in each of two Compact High Velocity Clouds (CHVCs, defined as a slightly broader class than the very compact and very isolated examplars catalogued by Braun & Burton (1999)) along with preliminary work on two more CHVCs has led to the following conclusions:
(1) The neutral hydrogen column density falls exponentially, with scalelengths of and for W486 and W491, respectively. The exponential decline continues as far as we can trace the gas, from column densities near to below .
(2) The most reasonable explanation of these results is that the exponential decline we observe is the truncation edge itself, with the edge column density , defined as the neutral gas density where the neutral and ionized fractions are equal, around , similar to values for nearby galaxies and for Lyman Limit Systems. The cores of the CHVCs we mapped are only slightly above this value. The bulk of the gas in these CHVCs must be ionized rather than neutral, the scalelengths must be larger for total hydrogen (ionized plus neutral) than for H I alone, and the baryon fraction must be larger than the H I mass fraction alone.
(3) The cloud edges are relatively smooth on the scale of the beam. There is little sign of clumpiness and the linewidths are fairly constant.
(4) W491 has a superimposed mini-HVC, displaced in velocity by , with a peak column density only . Preliminary data toward future mapping of two more CHVCs has revealed two more mini-HVCs of similar size and similarly low central column density, displaced even more in velocity.
To date there has been very little mapping of the HVC population with the sensitivity and resolution required to detect cloudlets like the mini-HVC superimposed on W491. Nor do we know whether the smoothness of the edges of W486 and W491 is typical of the general CHVC population. Mapping of a statistically significant sample of CHVCs, with further exploration around the edges of each, will be required before we know whether or not there are differences in the corrugation of the edges of more-isolated and less-isolated CHVCs that might indicate different exposures to Galactic and extragalactic UV. Mapping of some sightlines independent of known CHVCs with sufficient sensitivity to detect low column density gas is also needed to assess whether the three mini-HVCs really are independent of the CHVCs against which they are seen. The few isolated beam positions at which low column density emission was found by Lockman et al. (2002) might be fruitful starting points. It will also be important to map some sightlines further removed from the Magellanic Stream to ascertain that the mini-HVCs are not related solely to that tidal feature. Arecibo resolution is important since the mini-HVCs we have detected to date subtend only a few Arecibo beams (and only a single Green Bank Telescope beam). A statistical sample of mini-HVCs will be needed before we can assess (a) the likelihood that they are candidates for the Local Group wide infalling gas clouds for which Blitz et al. (1999) (and others before them) have argued, and (b) implications for the total hydrogen column density distribution (Corbelli & Bandiera, 2002).
References
- Bland-Hawthorn, Freeman & Quinn (1997) Bland-Hawthorn, J., Freeman, K. C., & Quinn, P. J. 1997, ApJ, 490, 143
- Blitz et al. (1999) Blitz, L., Spergel, D., Teuben, P., Hartmann, D., & Burton, W. B. 1999, ApJ, 514, 818
- Braun & Burton (1999) Braun, R., & Burton, W. B. 1999, A&A, 341, 437
- Braun & Burton (2000) Braun, R., & Burton, W. B. 2000, A&A, 354, 853
- Braun & Burton (2001) Braun, R., & Burton, W. B. 2001, A&A, 375, 219
- Burton, Braun & Chengalur (2001a) Burton, W. B., Braun, R., & Chengalur, J. N. 2001a, A&A, 369, 616 (BBC)
- Burton, Braun & Chengalur (2001b) Burton, W. B., Braun, R., & Chengalur, J. N. 2001b, A&A, 375, 227
- Castellanos, Díaz & Tenorio-Tagle (2002) Castellanos, M., Díaz, Á., & Tenorio-Tagle, G. 2002, ApJ, 565, L79
- Charlton, Churchill & Rigby (2000) Charlton, J. C., Churchill, C. W., & Rigby, J. R. 2000, ApJ, 544, 702
- Ciardi, Bianchi & Ferrara (2002) Ciardi, B., Bianchi, S., & Ferrara, A. 2002, MNRAS, 331, 463
- Colgan, Salpeter & Terzian (1990) Colgan, S. W. J., Salpeter, E. E., & Terzian, Y. 1990, ApJ, 351, 503
- Corbelli & Bandiera (2002) Corbelli, E., & Bandeira, R. 2002, ApJ, 567, 712
- Corbelli & Salpeter (1993) Corbelli, E., & Salpeter, E. E. 1993, ApJ, 419, 104
- Corbelli, Salpeter & Bandiera (2001) Corbelli, E., Salpeter, E. E., & Bandiera, R. 2001, ApJ, 550,26
- Corbelli, Schneider & Salpeter (1989) Corbelli, E., Schneider, S. E., & Salpeter, E. E. 1989, AJ, 97, 390
- de Blok et al. (2002) de Blok, W. J. G., Zwaan, M. A., Dijkstra, M., Briggs, F. H., & Freeman, K. C. 2002, A&A, 382, 43
- Dove & Shull (1994) Dove, J. B. & Shull, J.M. 1994, ApJ, 423, 196
- Hartmann & Burton (1997) Hartmann, D., & Burton, W. B. 1997, Atlas of Galactic Neutral Hydrogen (Cambridge: Cambridge University Press)
- Heiles et al. (2001) Heiles, C., et al. 2001, PASP, 113, 1247
- Hoffman et al. (2001) Hoffman, G. L., Salpeter, E. E., & Carle, N. J. 2001, AJ, 122, 2428
- Lockman et al. (2002) Lockman, F. J., Murphy, E. M., Petty-Powell, S., & Urick, V. J. 2002, ApJS, in press (astro-ph/0201039)
- Maloney (1993) Maloney, P. 1993, ApJ, 414, 41
- Murphy, Lockman & Savage (1995) Murphy, E. M., Lockman, F. J., & Savage, B. D. 1995, ApJ, 447, 642 (MLS)
- Narayan & Medvedev (2001) Narayan, R., & Medvedev, M. V. 2001, ApJ, 562, L129
- Perillat & Howell (2001) Perillat, P., & Howell, E. 2001, private communication
- Putman et al. (2002) Putman, M. E., et al. 2002, AJ, 123, 873
- Richter et al. (1999) Richter, P., de Boer, K. S., Widmann, H., Kappelmann, N., Gringel, W., Grewing, M., & Barnstedt, J. 1999, Nature, 402, 386
- Richter et al. (2001) Richter, P., Sembach, K. R., Wakker, B. P., Savage, B. D., Tripp, T. M., Murphy, E. M., Kalberla, P. M. W., & Jenkins, E. B. 2001, ApJ, 559, 318
- Shull et al. (2000) Shull, J. M., et al. 2000, ApJ, 538, L13
- Stanimirović et al. (2002) Stanimirović, S., Dickey, J.M., Krčo, M., & Brooks, A.M. 2002, submitted to ApJ
- van Gorkom (1993) van Gorkom, J. 1993, in The Environment and Evolution of Galaxies, ed. J.M. Shull & H.A. Thronson, 345 (Dordrecht: Kluwer)
- Wakker et al. (1999) Wakker, B. P., Howk, J. C., Savage, B. D., van Woerden, H., Tufte, S. L., Schwarz, U. J., Benjamin, R., Reynolds, R. J., Peletier, R. F., & Kalberla, P. M. W. 1999, Nature, 402, 388
- Wakker & van Woerden (1991) Wakker, B. P., & van Woerden, H. 1991, A&A, 250, 509
- Wakker & van Woerden (1997) Wakker, B. P., & van Woerden, H. 1997, ARA&A, 35, 217
- Wright (1979) Wright, M. C. H. 1979, ApJ, 234, 27
- Zwaan (2001) Zwaan, M. A. 2001, MNRAS, 325, 1142
- Zwaan & Briggs (2000) Zwaan, M. A., & Briggs, F. H. 2000, ApJ, 530, L61