First results from the Very Small Array – I. Observational methods
Abstract
The Very Small Array (VSA) is a synthesis telescope designed to image faint structures in the cosmic microwave background on degree and sub-degree angular scales. The VSA has key differences from other CMB interferometers with the result that different systematic errors are expected. We have tested the operation of the VSA with a variety of blank-field and calibrator observations and cross-checked its calibration scale against independent measurements. We find that systematic effects can be suppressed below the thermal noise level in long observations; the overall calibration accuracy of the flux density scale is 3.5 percent and is limited by the external absolute calibration scale.
keywords:
cosmology:observations – cosmic microwave background1 INTRODUCTION
Sensitive measurements of the cosmic microwave background (CMB) radiation are increasingly important in cosmology and astrophysics. Observations of both the primary imprints on the CMB originating at the surface of last scattering and secondary imprints such as the Sunyaev-Zel’dovich effect contain a wealth of information, if they can be made with sufficient sensitivity and freedom from systematic errors. We have constructed a telescope, the Very Small Array (VSA), for measuring intensity structures in the CMB on degree and sub-degree angular scales. The telescope itself is described in detail in Rusholme et al. (in prep.). The present paper discusses the observational methods underlying VSA observations, and the procedures used to eliminate systematic errors from the data (such as contaminating emission from the Sun). In three accompanying papers we then present results from the first year’s observations with the VSA. Paper II (Taylor et al., 2002) describes the first season’s observations and issues of foreground removal; Paper III (Scott et al., 2002) presents the power spectrum results and analysis, while Paper IV (Rubiño-Martin et al., 2002) derives cosmological parameters from the VSA results and other data.
Many different experimental approaches have been used to measure features in the CMB, mostly using switched- or swept-beam systems with total power detectors. Such systems can be made with very high sensitivity, particularly when using broad-band bolometric detectors, and progress in the field has mostly been due to improved techniques for suppressing unwanted signals such as atmospheric emission and differential emission from the telescope optics. An alternative approach, which we have adopted, is to use interferometers. These provide excellent rejection of systematics, since only signals entering both antennas with the correct path and phase modulation are detected while signals such as ground radiation and atmospheric emission are strongly suppressed (eg Church (1995)). For similar reasons they are relatively insensitive to receiver gain fluctuations. Interferometric systems also offer the opportunity to target a specific range of angular scales on the sky, determined by the spacing and the size of the elements of the array, and are well-suited to measuring the power spectrum of the CMB since they directly sample the Fourier modes on the sky which can then be converted to a power spectrum. Their main disadvantages are the restricted bandwidth compared to bolometers, due to the need for coherent receivers, and the relative complexity and expense of the correlator. We have previously demonstrated the success of the interferometric approach with the detection of CMB fluctuations with the Cosmic Anisotropy Telescope (CAT) from a sea-level site (Scott et al. (1996), Baker et al. (1999)); the VSA is a direct descendant of CAT.
2 THE INSTRUMENT
In this section we briefly describe the VSA and its capabilities, and compare it with other current CMB telescopes.
2.1 VSA main array
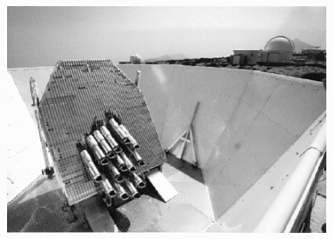
The VSA is a 14-element heterodyne interferometer array, tuneable between 26 and 36 GHz with a 1.5 GHz bandwidth and a system temperature of approximately , sited at 2400 m altitude at the Teide Observatory in Tenerife. Each receiving element consists of a corrugated horn-reflector antenna (CHRA) feeding a cooled HEMT amplifier, measuring one linear polarisation. The CHRA (Yassin et al., 1993) consists of a conical corrugated horn feeding a section of a paraboloidal mirror at to the horn axis. This arrangement gives a compact antenna with an unblocked aperture, and hence low sidelobes. The mirror can be rotated about the axis of the feedhorn, allowing tracking in one dimension. The receivers are mounted on a tilting table hinged along its northern edge, providing tracking in a second dimension (see Figure 1). In order to achieve close packing of the antenna apertures, the receivers are mounted at an angle of to the table; the elevation range of the table is – and thus gives a range of zenith angle of in the north-south direction, with the rotating mirrors providing approximately in the other diection. The array is surrounded by an aluminium ground screen to limit interference and groundspill; the internal sides are sloped to direct rays from the table into the sky.
The antennas used for the observations reported here and in papers II–IV have illuminated apertures of 143 mm diameter, giving a primary (envelope) beam of FWHM at 34 GHz and are designed for use in a “compact array”, for observations up to a maximum spherical harmonic multipole of about . For subsequent observations at higher the antennas have been modified by increasing the length of the horn and fitting a larger mirror, giving an aperture of 322 mm and a beam of FWHM; observations are currently underway with this “extended array”.
The signals are downconverted at the antennas to a first IF frequency centred at 9 GHz, and again at a point just outside the enclosure to a centre frequency of 1 GHz. This double downconversion allows the RF band to be tuned by changing the first local oscillator frequency without the need for high-Q tunable image filters. The first LO is also phase-switched with orthogonal switching functions at each antenna to allow subsequent phase-sensitive detection in the correlator. The second downconversion uses LOs in quadrature to produce real and imaginary channels for each antenna.
The second IF signals are carried on cables inside a screened enclosure within the control building. To compensate for the changing path to the source as the antennas track, lengths of delay line are switched into each IF channel, eight units providing up to 1.8 m delay in steps of 7 mm. After further gain, equalisation, and automatic gain control, the signals are split with a cascade of power splitters and fed into the corrrelators. Each real or imaginary correlation is done on a separate board, where the product of the inputs is formed and detected synchronously with the first LO switching functions. The data are integrated in an analogue integrator for 1 s before being sampled and read out into the control computer. The synchronous detection circuit also includes a switch which reduces the correlator gain by a factor of about 20, increasing the dynamic range of the correlator for observation of very bright calibrators such as the Moon.
2.2 Source subtraction baseline
The most important foreground contaminant for CMB observations at these angular scales and frequency is radio sources. The effect of sources on the power spectrum increases as , but even at the lower ’s sampled by the compact array sources are significant (Taylor et al., 2001). Ideally one would survey the CMB fields at the same frequency as the CMB observations with sufficiently high sensitivity and resolution to detect all the sources that would contaminate the power spectrum. This would require a telescope rather more expensive than the VSA itself. Instead, we adopt a two-part strategy based on existing facilities; VSA fields are surveyed at 15 GHz with the Ryle Telescope (RT) (Waldram et al., 2002), and then each of the sources found is monitored at 34 GHz by a source subtractor interferometer located next to the VSA. More details of the source subtraction procedure are given in Paper II.
The source subtraction interferometer consists of two 3.7-m diameter dishes fitted with the same receivers as the main array, and equipped with identical IF and correlator. The dishes are mounted such that they track with the same rotation of parallactic angle as the main array, so that polarized sources will be observed in the same orientation with respect to the polarization of the feeds. The antennas are housed in separate ground screens identical to the main array ground screen, to limit ground pickup and to provide shielding from the wind. The baseline is 9 m, giving a resolution of 4 arcmin in a 9 arcmin field, which will not resolve any of the sources we observe, while completely resolving out the CMB.
2.3 The site
The VSA is located at the Teide Observatory, Tenerife at an altitude of 2400 m. The observatory is well established and, although on-site support is always available, we are able to control both the telescope and observations remotely. The site provides excellent observing conditions and has been well-tested for atmospheric seeing over a 15-year period. The inversion layer lies below the observatory for 75 per cent of the year; the twice-daily meteorological balloon flights show that the precipitable water vapour is as low as 2 mm for 30 per cent of the launches. For observations in the region GHz, the typical transparency is 95 per cent. Correlated signals due to atmospheric emission decrease with higher angular resolution. For example, at 33 GHz, the Tenerife beam-switch experiment (for example, Davies et al. (1996)) was affected by water vapour fluctuations for 80 per cent of the time while the Jodrell Bank-IAC 33 GHz interferometer (Melhuish et al., 1999) was affected for 20 per cent of the time at resolution () and percent at resolution (). On the VSA baselines () we expect even less loss of data due to atmospheric effects. In fact, during our first season of observations (September 2000 – September 2001), the site proved to have exceptional conditions; only 5 percent of the data were rejected due to weather.
2.4 Comparison with other CMB instruments
An important factor in assessing the confidence we can place in measurements as difficult, yet as important, as the CMB power spectrum, is the agreement between experiments with different methods that are susceptible to different systematic effects. The VSA is similar in its sensitivity and angular coverage to several other CMB experiments that have reported results recently; BOOMERanG (Netterfield et al., 2002), MAXIMA (Hanany et al., 2000), DASI (Halverson et al., 2002) and CBI (Padin et al., 2001). Here we consider briefly the important systematic effects in the VSA in comparison to these experiments.
BOOMERanG and MAXIMA are focal-plane arrays of bolometers on small, off-axis telescopes suspended from stratospheric balloons. They have very high instantaneous sensitivity at frequencies where the total galactic and extragalactic foregrounds are at their minima, and they operate above most of the atmosphere, eliminating that as a source of contaminating emission. Their main problems are concerned with calibration; the uncertainties in the shapes and areas of the beams from each detector, and their pointing on the sky, limit the ability to recover the power spectrum at resolutions close to the beam size. Recovery of the power spectrum at very low is limited by receiver stability during each scan of the telescope. There is also an overall uncertainty in the temperature scale due to the lack of knowledge of the beam areas and, particularly for BOOMERanG, the lack of good flux calibration sources observed during the flight. The quoted uncertainty for the BOOMERanG power spectrum due to the temperature calibration is 20 percent, in addition to the beam uncertainty (Netterfield et al., 2002). Foreground contamination at 150 GHz is small, and dominated by galactic dust emission, the effect of which declines at higher .
Calibration of instruments such as the VSA is much less problematic. Flux calibrators with well-studied properties are available (such as Cas A or Jupiter) and these can be observed repeatedly, and cross-checked with other secondary calibrators. Overall calibration error is dominated by the uncertainty in the absolute temperature of Jupiter, which is about 3.5 percent (Mason et al., 1999), leading to a 7 percent error in the power spectrum. The VSA is much less sensitive than the balloon experiments, however, with slightly worse random errors from 500 hours observation than MAXIMA’s from 3 hours. The main foreground contaminant is extragalactic point sources, whose effect increases as . The dominant errors and contaminants are thus quite different from the balloon experiments, so agreement between VSA, BOOMERanG and MAXIMA would be a very good sign of the believability of the current power spectrum measurements.
Much the same arguments apply to the results from the other interferometers, DASI and CBI, which are very similar to the VSA in many respects, having similar numbers of antennas and the same observing frequency. However, there are significant differences between the three interferometer experiments which also allow for independent cross-checks of calibration and systematics. The VSA and CBI use the same primary flux calibrators; DASI, located at the south pole, is unable to see these and instead uses an absolute measurement of system temperature based on hot and cold loads. CBI, and DASI in its first season, had no ground screen, and hence suffered from significant pick-up of correlated emission from the ground, which had to be removed by differencing fields observed at the same ground angles. The VSA avoided this problem but suffered from a spurious correlated signal related to cross-coupling between the closest-spaced antennas, which is removed by Fourier filtering of the time-ordered data (see section 4.2).
The biggest design difference between the CBI and DASI on one hand and the VSA on the other is that the VSA has semi-independent tracking rather than fully co-mounted antennas. The resulting variation of path length to a source as the earth rotates imposes a modulation on the signal which can be used to very effectively reject signals from elsewhere in the sky, for example from the Sun or the Moon. This allows the VSA to observe during daylight, improving the observing efficiency. (Note that on a typical baseline there are 50 fringes during an observation of a primordial field.)
All of the current CMB experiments thus have different calibration and systematic problems, markedly so in the case of the interferometers versus the balloons, and therefore agreement between them is essential to establish the reliability of the power spectrum measurements.
3 CALIBRATION AND DATA REDUCTION
3.1 Amplitude and phase calibration
Absolute flux calibration of VSA observations is based on the flux scale of Mason et al. (1999). Our primary flux calibrator is Jupiter, for which the brightness temperature is taken to be 154.5 K at our observing frequency of 34 GHz. The solid angle of the planet is calculated at the epoch of each calibration observation and the flux determined. Jupiter is unresolved on all VSA baselines (including the source subtractor baseline) so no further correction is made for the angular size. We also observe Tau A and Cas A, whose fluxes are determined via our primary calibration of Jupiter. Transferring our calibration scale to both Cas A and Tau A ensures that an alternative bright calibrator source is always available should a Jupiter observation be lost due to, for example, bad weather, or obscured by the Sun or Moon. Care has to be taken, however, when transferring our flux calibration to Tau A, since it is known to be polarized (approximately 8 percent at 34 GHz, (Johnston & Hobbs, 1969)), and hence the flux as observed by the VSA changes with the hour angle of observation. To ensure that this does not introduce any systematic error, our calibration observations of Tau A are short and are made at the same hour angle each day.
We also make daily observations of two fainter sources, 3C48 and NGC7027, allowing us to check the quality of observations throughout the observing day. The measured flux ratios of these sources to our primary calibrators agree well with those reported by Mason et al., suggesting that the accuracy of our flux calibration is dominated by the error estimate of the absolute temperature of Jupiter, which is approximately 3.5 percent. Further to this, we have cross-checked our calibration with that used by the CBI instrument (Padin et al., 2001). CBI also uses Jupiter as one of its primary calibrators and, since they have a bandwidth of 10 GHz centred on 31 GHz, this has enabled them to estimate the spectral index of Jupiter and Saturn over the frequency range 26-36 GHz and hence cross-check our calibration at 34 GHz. We have cross-calibrations based on Jupiter and Saturn which agree to 1 percent.
Phase calibration of the VSA is also applied on a daily basis using the same three calibrators, Cas A, Tau A and Jupiter. The telescope is sufficiently phase stable that a single phase calibration made within hours of a CMB observation is adequate to calibrate the phases to . In the same process, errors in the quadrature of up to between the real and imaginary parts of each visibility are corrected for. These quadrature errors arise due to path differences in the cables going to the correlator boards. Consider two measured components of a visibility and at angles and respectively from the theoretical fringe-rotated components and . The quadrature error is . Components and which are orthogonal to each other can be synthesised by rotating by in opposite directions. These can then be rotated by to give visibilities corresponding to the appropriate phase centre. Thus:

Figure 2 shows this scheme. Correcting for quadrature errors necessarily results in a loss of signal to noise by a factor and the data must be down-weighted appropriately.
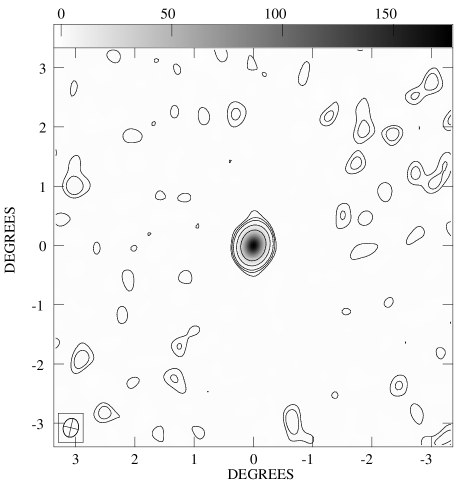
Figure 3 shows a typical CLEANed map of a calibrator, in this case Jupiter. Such maps are made daily to check the performance and stability of the telescope; the amplitude and phase stability are such that any un-CLEANed artefacts are below the thermal noise level. Since this observation has a higher signal-to-noise ratio than any CMB measurement, we can be confident that our CMB measurements are unaffected by dynamic range limitations.
3.2 Pointing and geometry accuracy
The pointing accuracy of the VSA is primarily determined by mechanical alignment tolerances, but we frequently make long observations of unresolved calibrators in order to check both the pointing and geometry of the array. Pointing is checked with two sets of observations. Firstly, the antennas in turn are offset in the antenna tracking co-ordinate on either side of the calibration source; secondly, the whole table is offset in the table tracking co-ordinate. These allow us to fit for offsets in the table and antenna encoders, and to check the co-alignment of the antennas. Alignment is better than 5 arcmin, about 1.5 percent of the beamwidth.
Geometry is checked using long observations of two or more calibrators at different declinations. In conjunction with a model of the telescope, we employ a maximum-likelihood technique to fit simultaneously for 400 parameters. These include the , and co-ordinate of each antenna, complex gains for each of the 182 correlator channels and the effective observing bandwidth and frequency of each baseline. These parameters can be determined accurately enough to ensure that in subsequent CMB observations, phase and amplitude errors due to geometry errors are always less than the thermal noise.
3.3 System temperature calibration
The overall gain of each antenna is monitored via a noise injection system. A modulated noise signal is injected into each antenna via a probe in the horn, and is later measured using phase-sensitive detection after the automatic gain control stage in the IF system. The relative contribution of the constant noise source to the total output power from each antenna varies inversely with system temperature, and thus a correction can be made to the overall flux calibration. Assuming that the receiver temperature is constant, this system allows us to account for variations in atmospheric attenuation of the astronomical signal. It provides an excellent indication of the weather conditions and is used as a primary indicator for flagging data. For good observing conditions, the gain corrections applied using this system are typically less than a few percent.
3.4 Calibration of the source subtractor
Calibration of the source subtraction baseline is similar to that of the VSA main array. The primary flux calibrator for the source subtractor is NGC7027, whose flux is taken to be 5.45 Jy at 34 GHz. Observations of NGC7027 are made each day, in addition to observations of 3C48, 3C273 and Jupiter. The much higher flux sensitivity of the source subtractor makes it difficult to observe the same bright calibrators as the main array without using the low-gain setting of the correlator. Cross-calibration of the VSA and source subtractor is therefore achieved by low-gain observations of Jupiter; the gain switch is calibrated by observations of 3C273 in both gain states. Agreement between the VSA and source suntractor is found to be better than 3 percent.
Phase calibration of the source subtractor differs slightly from that for the main array. Since the source subtractor continually slews between pointed observations of point sources in the VSA fields, it is important to check the phase and pointing stability of source observation throughout an observing run. For this reason, between each set of 10 pointed source observations, we observe a phase calibrator source. The sources chosen to be phase calibrators need only be bright enough to get good signal-to-noise ratios in a 400 second integration, and are typically chosen to be the brightest sources already identified within a VSA field.
As with the main array, the long-term pointing accuracy and stability of the source subtractor baseline is monitored via long calibrator runs utilising the full range of hour angles.
3.5 Data reduction
The correlated signal from each of the 91 VSA baselines is sampled each second and, before the raw data are calibrated and smoothed, a series of preliminary flagging operations are performed. These are based on the status of the telescope each day, for which our main diagnostic tools are the system temperature monitor and automatic gain control levels, both of which monitor the power level from each antenna during an observation. This information can be used to flag for bad weather or warm cryostats. We also independently monitor the temperature of each cryostat, but the system temperature can be more sensitive and is useful as an early warning of problems with the cryogenics. Pointing errors are recorded throughout each observation, and the data are automatically flagged if the pointing error is greater than 0.5∘. Missing or repeated data samples, due to communication glitches between the correlator readout micro and the data recording computer, are also corrected. Finally, times at which the field centre is within 40∘ of the Sun or within 30∘ of the Moon are flagged, and a pre-analysis cut on the data at a 10- level is applied. Typically, up to 3 percent of the data on each field is flagged in this manner.
As well as the fast ( kHz) phase switching that is demodulated in hardware in the correlator, we also employ a slow phase switching sequence with a cycle time of 16s that is demodulated in software and removes any offsets in the hardware integration and sampling. After the initial flagging, the data are demodulated and smoothed over 16 seconds. Since this smoothing occurs before the data have been fringe rotated, a small amplitude correction must be applied to compensate for the reduction in amplitude of the raw fringes. The data can then be filtered for contaminating signals. As described in Section 4.2, the effects of contaminating signals, weather and bright sources outside the beam, can be effectively removed via the application of a high pass Fourier filter. For a typical VSA field observation, up to 20 percent of the data can be lost due to filtering, the majority of which is on baselines shorter than 30 . After filtering, the data are fringe-rotated to the centre of the field and calibrated. Phase calibration and quadrature correction are also implemented at this point. The system temperature correction is applied after the primary calibration, correcting for variations in the gain of each antenna and for changes in the atmospheric attenuation. Finally, the data are averaged to 64-second samples and a post-analysis chop at the 5- level ( Jy) is applied.
Although each day’s data must be examined and flagged individually, the basic data-reduction process outlined above can be applied automatically to the data for each field. As a further check on the data analysis, maps are made of both the calibrator and field observations for each day. The noise level on each map is checked to be consistent with that expected, and errors in the data analysis are easily detected.
4 CONTAMINANTS
As well as the CMB signal and thermal noise, the VSA data also include several types of contaminating signals, including bright sources such as the Sun and Moon, as well as instrumental artefacts. Here we describe the techniques for eliminating these from the data and checking the data for residual contaminants.
4.1 Spurious signal
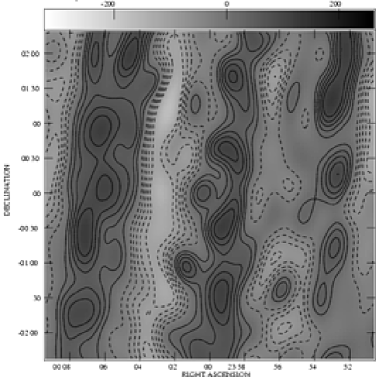
Commissioning observations of blank fields showed that the VSA was detecting a correlated signal which did not originate from the sky (see Figure 4 for an example of this signal and its power spectrum).


Further investigation determined the following characteristics for the signal:
-
1.
It is reasonably constant if the telescope is held stationary.
-
2.
It is broad-band.
-
3.
Its strength varies dramatically with baseline, peaking at approximately 1 mK on the shortest baselines but being undetectable on most longer baselines.
-
4.
The signal vanishes if a large aluminium sheet is inserted between the antennas, indicating that the signal enters through the antennas and is related to coupling between them.
-
5.
The signal does not vary when the tilt-table is driven in elevation, showing that the signal source is on the table rather than, for example, being radiation diffracting over the ground screen.
-
6.
If the antennas are driven, the signal is modulated at a rate consistent with the rate of change of path between adjacent edges of the antennas. This means that during an observation of an astronomical source the maximum possible rate of change for the spurious signal is about 2 cycles per hour.
This spurious signal is not consistent with radiation from the receivers being coupled between the antennas, as the measured coupling even at the shortest spacings is less than dB, which would imply a correlated noise temperature of several hundred Kelvin being emitted by the receivers. Comparable levels of coupling have been measured by Padin et al. (2000) for the CBI telescope. Possible explanations for the source include thermal radiation from the antenna surface, or scattering of ambient radiation off one antenna that couples to another, an effect seen in the Australia Telescope Compact Array (R. Subrahmanyan, priv comm). However, the signal can be effectively removed from the data by suitable Fourier filtering of the time-ordered data.
4.2 Filtering according to astronomical fringe rate
Because of the semi-independent tracking of the VSA antennas, the correlated astronomical signal is modulated as the relative path length to the antennas changes. This modulation is typically much faster than the observed rate of change of the spurious signal. We can therefore filter out the spurious signal using a high-pass Fourier filter on the time-ordered data. We use a Hanning (cosine-edged) filter in order to minimise ringing, ie long-period correlations, in the time domain (Fig. 5).
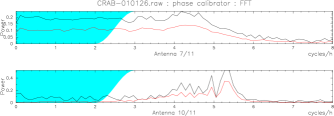
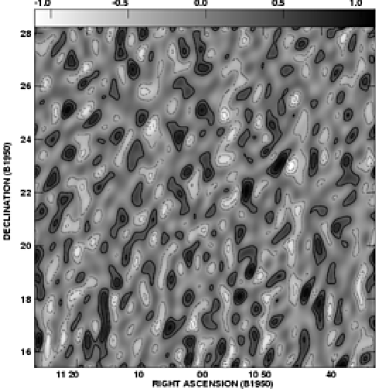
Although most of the time the astronomical signals are modulated faster than the filter frequency and are thus not affected by it, at some times the fringe rate drops into the filter stop band; this depends on the baseline orientation, source position and hour angle. We flag out any data taken when the astronomical fringe rate lies within the cutoff range of the filter; in general this leads to approximately 20 percent of the visibilities for an observation being discarded. Figure 6 shows a single observation of a blank field with and without filtering; the filtered map is consistent with the thermal noise level.
We have studied the effect of this filtering on the data analysis by simulating CMB observations from sky realisations with CDM power spectra, following exactly the procedure used for real observations all the way through to maps and recovered power spectra, and have shown that any correlations introduced in the data by the filtering have negligible effect on the results.
4.3 Filtering of the Sun and Moon
It is possible to use the technique described above to remove the effects of very bright sources which lie well away from the field of view but are still detected in the sidelobes of the telescope beam. The source will in general have a different astronomical fringe rate to the field being observed. We therefore fringe rotate the data to the bright source, apply a high pass Fourier filter, fringe rotate back to the field centre, and flag any data where the fringe rate of the field lies within the range of the filter.
For the VSA the only sources that are bright enough to affect observations when they fall in distant sidelobes are the Sun and the Moon, which have approximate flux densities of 10 MJy and 0.3 MJy respectively at 34 GHz. For our observations of the CMB we do not observe any fields within of the Sun or of the Moon, and apply the above filtering technique whenever these sources are above the VSA ground screen.
The power of the technique is demonstrated in Figure 7 where Jupiter, with flux density of approximately 90 Jy, is observed within of the Sun.
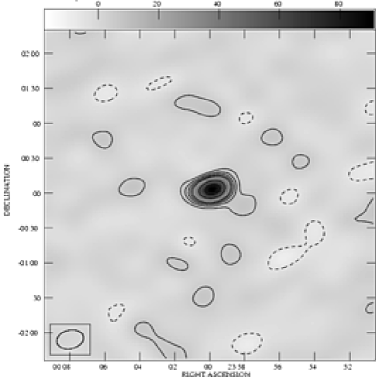
The filtered map shows that the contaminating effect of the Sun has been successfully removed and that the only significant feature in the map is a point source corresponding to Jupiter. Its flux density is as expected and the rms on the map is consistent with the thermal noise. We have examined the rms noise level on maps as a function of distance from the Sun with and without filtering. Figure 8 shows the rms noise levels per unit observation time on a sequence of 6-hour blank field observations at various distances from the Sun, both with and without filtering. Excess noise due to the Sun can be seen at angles less than in the unfiltered case, but no excess noise is seen in the filtered data (although of course more and more data has to be flagged the closer the observation is to the Sun). For CMB observations, we do not use data taken less then from the Sun, and we employ filtering.

5 Final commissioning observations
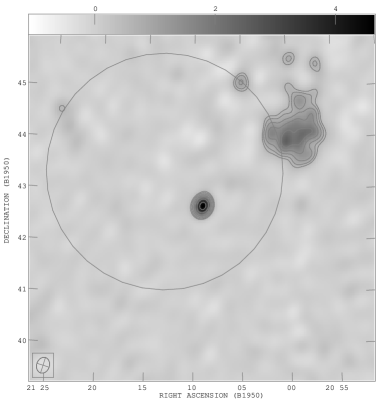
As a final checks of the telescope function we observed two regions in the Galactic plane. We observed the source NGC7027 with the telescope pointing and phase centres offset from the source position. This tests all the fringe rotation, calibration and mapping algorithms, as well as confirming the expected attenuation due to the primary beam. Also visible in the image (Figure 9) is some diffuse galactic emission (part of a larger structure that is cut off by the primary beam attenuation). This emission lies well outside of the primary beam of the source subtraction telescopes, which use NGC7027 as their primary calibrator.
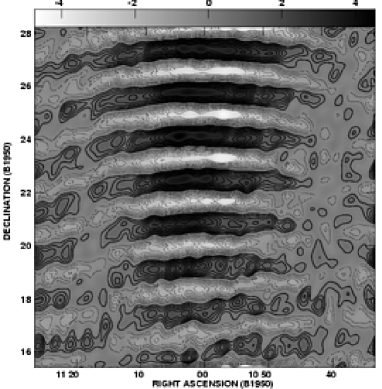
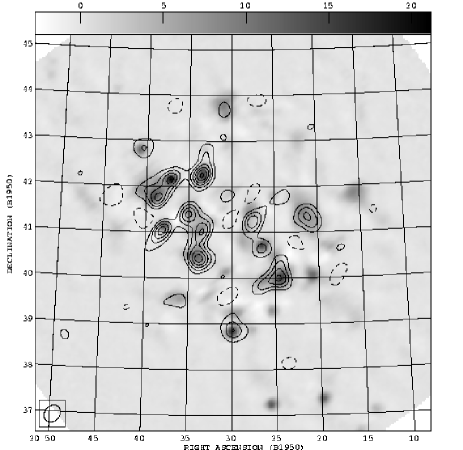
We also observed the Cygnus-X region, an area of bright free-free extended emission, for which an independent observation with similar resolution at a close frequency was available. Fig 10 shows our observed 34 GHz contours are overlaid on 14.35 GHz Green Bank data (Langston et al., 2000). There is very good agreement between the structure observed at the two frequencies.
6 CONCLUSIONS
We have tested the operation of the VSA by observations of calibrators, blank sky, and extended galactic structure. The telescope has been demonstrated to work according to specification. In particular, we have shown that systematic effects such as the effects of the Sun and Moon, and coupling between the antennas, can be removed from the data to a very low level, allowing reliable long integrations on CMB fields. We have also shown that the data can be calibrated to an accuracy limited only by the absolute flux measurement of our primary calibrator, and that our separate telescope for observing point radio sources can be accurately cross-calibrated with the main array.
ACKNOWLEDGEMENTS
We thank the staff of the Mullard Radio Astronomy Observatory, Jodrell Bank Observatory and the Teide Observatory for invaluable assistance in the commissioning and operation of the VSA. The VSA is supported by PPARC and the IAC. Partial financial support was provided by Spanish Ministry of Science and Technology project AYA2001-1657. A. Taylor, R. Savage, B. Rusholme, C. Dickinson acknowledge support by PPARC studentships. K. Cleary and J. A. Rubiño-Martin acknowledge Marie Curie Fellowships of the European Community programme EARASTARGAL, “The Evolution of Stars and Galaxies”, under contract HPMT-CT-2000-00132. K. Maisinger acknowledges support from an EU Marie Curie Fellowship. A. Slosar acknowledges the support of St. Johns College, Cambridge. We thank Professor Jasper Wall for assistance and advice throughout the project.
References
- Baker et al. (1999) Baker J. C., Grainge K., Hobson M. P., Jones M. E., Kneissl R., Lasenby A. N., O’Sullivan C. M. M., Pooley G., Rocha G., Saunders R., Scott P. F., Waldram E. M., 1999, MNRAS, 308, 1173
- Church (1995) Church S. E., 1995, MNRAS, 272, 551
- Davies et al. (1996) Davies R. D., Gutierrez C. M., Hopkins J., Melhuish S. J., Watson R. A., Hoyland R. J., Rebolo R., Lasenby A. N., Hancock S., 1996, MNRAS, 278, 883
- Halverson et al. (2002) Halverson N. W., et al., 2002, ApJ, 568, 38
- Hanany et al. (2000) Hanany S., et al., 2000, ApJ, 545, L5
- Johnston & Hobbs (1969) Johnston K. J., Hobbs R. W., 1969, ApJ, 158, 145
- Langston et al. (2000) Langston G., Minter A., D’Addario L., Eberhardt K., Koski K., Zuber J., 2000, AJ, 119, 2801
- Mason et al. (1999) Mason B. S., Leitch E. M., Myers S. T., Cartwright J. K., Readhead A. C. S., 1999, AJ, 118, 2908
- Melhuish et al. (1999) Melhuish S. J., Dicker S., Davies R. D., Gutierrez C. M., Watson R. A., Davis R. J., Hoyland R., Rebolo R., 1999, MNRAS, 305, 399
- Netterfield et al. (2002) Netterfield C. B., et al., 2002, ApJ, 571, 604
- Padin et al. (2000) Padin S., Cartwright J. K., Joy M., C. M. J., 2000, IEEE Trans. Antennas Propagat., 48, 836
- Padin et al. (2001) Padin S., Cartwright J. K., Mason B. S., Pearson T. J., Readhead A. C. S., Shepherd M. C., Sievers J., Udomprasert P. S., Holzapfel W. L., Myers S. T., Carlstrom J. E., Leitch E. M., Joy M., Bronfman L., May J., 2001, ApJ, 549, L1
- Rubiño-Martin et al. (2002) Rubiño-Martin J. A., et al., 2002, First results from the Very Small Array IV: Cosmological Parameter Estimation, submitted to MNRAS
- Scott et al. (2002) Scott P. F., et al., 2002, First results from the Very Small Array III: The CMB Power Spectrum, accepted for publication in MNRAS
- Scott et al. (1996) Scott P. F., Saunders R., Pooley G., O’Sullivan C., Lasenby A. N., Jones M., Hobson M. P., Duffett-Smith P. J., Baker J., 1996, ApJ, 461, L1
- Taylor et al. (2002) Taylor A. C., et al., 2002, First results from the Very Small Array II: observations of the CMB, accepted for publication in MNRAS
- Taylor et al. (2001) Taylor A. C., Grainge K., Jones M. E., Pooley G. G., Saunders R. D. E., Waldram E. M., 2001, MNRAS, 327, L1
- Waldram et al. (2002) Waldram E. M., Pooley G. G., Grainge K. J. B., Jones M. E., Saunders R. D. E., Scott P. F., Taylor A. C., 2002, A Survey of Radio Sources at 15 GHz with the Ryle Telescope: Techniques and Properties, submitted to MNRAS
- Yassin et al. (1993) Yassin G., Robson M., Duffett-Smith P. J., 1993, IEEE Ant. & Prop., 41, 357