11email: pen@ifa.au.dk 22institutetext: European Southern Observatory, Karl-Schwarzschild Str. 2, D–85748 Garching b. München, Germany
22email: fprimas@eso.org 33institutetext: Uppsala Astronomical Observatory, Box 515, SE–751 20, Sweden
44institutetext: Present address: Research School of Astronomy and Astrophysics, Australian National University, Mount Stromlo Observatory, Cotter Road, Weston, ACT 2611, Australia
44email: martin@mso.anu.edu.au 55institutetext: Department of Astronomy, University of Texas, Austin, TX 78712–1083
55email: dll@anchor.as.utexas.edu
O/Fe in metal-poor main sequence and subgiant stars ††thanks: Based on observations collected at the European Southern Observatory, Chile (ESO No. 65.L-0131, 65.L-0507, and 67.D-0439)
A study of the O/Fe ratio in metal-poor main sequence and subgiant stars is presented using the [O i] 6300 Å line, the O i 7774 Å triplet, and a selection of weak Fe ii lines observed on high-resolution spectra acquired with the VLT UVES spectrograph. The [O i] line is detected in the spectra of 18 stars with , and the triplet is observed for 15 stars with [Fe/H] ranging from to . The abundance analysis was made first using standard model atmospheres taking into account non-LTE effects on the triplet: the [O i] line and the triplet give consistent results with [O/Fe] increasing quasi-linearly with decreasing [Fe/H] reaching [O/Fe] at [Fe/H] = . This trend is in reasonable agreement with other results for [O/Fe] in metal-poor dwarfs obtained using standard atmospheres and both ultraviolet and infrared OH lines. There is also broad agreement with published results for [O/Fe] for giants obtained using standard model atmospheres and the [O i] line, and the OH infrared lines, but the O i lines give higher [O/Fe] values which may, however, fall into place when non-LTE effects are considered. When hydrodynamical model atmospheres representing stellar granulation in dwarf and subgiant stars replace standard models, the [O/Fe] from the [O i] and Fe ii lines is decreased by an amount which increases with decreasing [Fe/H]. These 3D effects on [O/Fe] is compounded by the opposite behaviour of the [O i] (continuous opacity effect) and Fe ii lines (excitation effect). The [O/Fe] vs [Fe/H] relation remains quasi-linear extending to [O/Fe] +0.5 at [Fe/H] = , but with a tendency of a plateau with [O/Fe] +0.3 for [Fe/H] , and a hint of cosmic scatter in [O/Fe] at . Use of the hydrodynamical models disturbs the broad agreement between the oxygen abundances from the [O i], O i and OH lines, but 3D non-LTE effects may serve to erase these differences. The [O/Fe] values from the [O i] line and the hydrodynamical model atmospheres for dwarfs and subgiant stars are lower than the values for giants using standard model atmospheres and the [O i] and O i lines.
Key Words.:
Stars: abundances – Stars: atmospheres – Stars: fundamental parameters – Galaxy: evolution –1 Introduction
The oxygen abundance of metal-poor stars is intimately linked to several outstanding questions in astrophysics. Questions of current interest include the following three: How old are the oldest (i.e., the most metal-poor) stars? Can the observed chemical evolution of oxygen in the early Galaxy be interpreted using current predictions for the yields from metal-poor massive stars exploding as supernovae? What conclusions may be drawn from the abundance ratios of lithium, beryllium, and boron relative to oxygen about the synthesis of these three light elements by collisions involving high energy particles in interstellar circumstellar gas? For these and other reasons, accurate determinations of the growth of the oxygen abundance of the Galaxy are desirable.
Oxygen, the most abundant element after hydrogen and helium, affects the opacity and, hence, the structure and evolution of low mass stars. Globular clusters are considered to contain some of the oldest stars in the Galaxy. Oxygen affects the shape of a cluster color-magnitude diagram, and, hence, a cluster’s age as it is determined from the fit of a theoretical to the observed diagram. VandenBerg & Bell (vandenberg01 (2001)) estimate that ‘each increase of 0.3 dex in [O/Fe] implies a 1 Gyr age reduction at a fixed turnoff luminosity’. In the case of the most metal-poor stars, current estimates of the [O/Fe] differ by as much as 0.7 dex or ages differ by 2 to 3 Gyr, a not insignificant difference for cosmologists.
Compositions of metal-poor unevolved stars are presumed to reflect the composition of the gas from which they formed. In the case of the most metal-poor stars, that gas may have been primordial gas mixed with ejecta from just one or two Type II supernovae. Hence, the predicted compositions of the ejecta may be tested against observed compositions. Predictions appeared not to have a problem in matching observations that suggested [O/Fe] 0.4, as well as [/Fe] 0.4, where denotes Mg, Si, and Ca. With some observers now reporting much higher oxygen abundances, [O/Fe] 1 for very metal-poor stars, serious challenges may face the modelers of the Type II supernova (see particularly Goswami & Prantzos goswami00 (2000)). Recent claims that hypernovae, i.e. supernovae with very high explosion energies, at low metallicities could account for the high values of [O/Fe] (Israelian et al. israelian01 (2001)) appear not to be supported by the most recent theoretical investigations of such events. On the contrary, detailed nucleosynthetic calculations reveal significantly lower O/Fe ratios than in normal core-collapse supernovae (Nakamura et al. nakamura01 (2001)).
Beryllium is identified as solely a product of spallation of nuclei in interstellar or circumstellar gas traversed by energetic particles: for example, the process + O splits 9Be nuclei from the oxygen 16O nucleus. Spallation also makes a contribution to the synthesis of lithium and boron. Under quite simple but reasonable assumptions concerning the nucleosynthesis of oxygen and the origin of the energetic particles (here referred to as cosmic rays, or CR for short), if beryllium synthesis is controlled by a CR proton (or -particle) colliding with an interstellar oxygen nucleus, one expects the beryllium abundance to grow as the square of the oxygen abundance. If the roles are reversed and a cosmic ray oxygen nucleus collides with an interstellar proton (or -particle), the beryllium and oxygen abundances are linearly related. In the present interstellar medium, this latter process is a minor contributor to beryllium synthesis because the fragments of the spallation of the oxygen nuclei have high energies and are themselves spallated as they are thermalized. In the former process, the fragments have much lower energies and a higher survival rate in thermalization. These relative roles may be reversed in the early Galaxy when the interstellar oxygen abundance was much lower than in the interstellar medium at present. By determining the Be/O ratio for metal-poor (and metal-rich) stars, it is possible to gain insight into the spallation processes. Uncertainty about the oxygen abundance necessarily compromises this exercise. Substitution of iron for oxygen is unsatisfactory because very little beryllium is produced from iron, and also the predicted oxygen to iron ratio in ejecta of Type II supernovae is uncertain.
Spectra of metal-poor stars offer several potential indicators of the oxygen abundance: ultraviolet OH lines, the [O i] 6300 Å and 6363 Å lines, the O i triplet at 7774 Å, and infrared vibration-rotation lines from the OH molecule’s ground state. A selection of these lines is available for both metal-poor dwarfs and giants. A problem of great current concern is that the various indicators may give different results. An abbreviated discussion suffices here, and a fuller discussion is postponed to Section 5.
The problem became strikingly evident with the publication of analyses of the ultraviolet OH lines in dwarfs (Israelian et al. israelian98 (1998); Boesgaard et al. boesgaard99 (1999)). These independent but quite similar analyses showed that [O/Fe] rose linearly with [Fe/H] from zero at [Fe/H] = 0 to about 1.2 at [Fe/H] = , about the metallicity of the most metal-poor stars studied. Accounting for non-LTE effects on the reference Fe i lines diminishes the slope somewhat to but still with a monotonic trend (Israelian et al. israelian01 (2001)). The linear increase to lower metallicities anticipated by Abia & Rebolo (abia89 (1989)) from the O i lines was confirmed by some but not all analyses of these lines. A quite different relation for [O/Fe] versus [Fe/H] had been derived prior to the OH analyses from the [O i] lines in giants: [O/Fe] 0.4 independent of [Fe/H] for giants with [Fe/H] (Barbuy barbuy88 (1988)). At [Fe/H] = , the OH in dwarfs and the [O i] in giants results for [O/Fe] differ by about 0.6 dex.
A strong a priori claim may be advanced that the [O i]-based analysis is the least sensitive to systematic errors: the lines are formed in or very close to local thermodynamic equilibrium (LTE); essentially all of the oxygen atoms in the dwarf and giant atmospheres are in the ground configuration providing the lower and the upper level of the forbidden lines. Even the sensitivity of the [O i]-based results to the assumed surface gravity is effectively mitigated by determining the iron abundance from Fe ii lines. This pairing also ensures the non-LTE effects affecting the iron abundance are minimal; stronger non-LTE effects are predicted for Fe i lines (e.g. Thévenin & Idiart thevenin99 (1999)). Dependence of [O/Fe] on effective temperature is also quite insignificant when the combination of [O i] and Fe ii lines is used, whereas the dependence on the atmospheric structure in general cannot be neglected, as will be discussed later, but at least it is smaller than in the case where OH lines are used.
By sharp contrast, the number of OH molecules (and of O i atoms in the lower state of the 7774 Å transitions) is a very small fraction of the total number of oxygen atoms, a fraction that is highly sensitive to the adopted values of effective temperature and surface gravity. Furthermore, LTE is far from guaranteed for either the OH UV lines (Hinkle & Lambert hinkle75 (1975); Asplund & García Pérez asplund01 (2001)) or the O i 7774 Å lines (Kiselman kiselman01 (2001) and references therein).
The view has been expressed that the [O i]-based results for the giants are in error on two accounts (Takada-Hidai et al. takada-hidai01 (2001); Israelian et al. israelian01 (2001)): (i) oxygen is reduced in the atmospheres of giants because the convective envelope has mixed very oxygen-poor material to the surface from the ON-cycled interior, and (ii) the [O i] line is partially filled in by emission. These are suspicions without firm supporting observational evidence. Reduction of oxygen by mixing must lead to a severe enhancement of the nitrogen abundance, a result not suspected from examination of spectra and not yet confirmed by quantitative analysis. If emission is the culprit, is it not surprising that the [O i] lines have never been seen in emission in metal-poor giants, and that the absorption line profile has not been reported as distorted or shifted in radial velocity?
A new way to approach the problem of the oxygen-to-iron ratio in metal-poor stars is to determine the abundances from observations of the [O i] and Fe ii lines in metal-poor ([Fe/H] ) main sequence and subgiant stars. Mixing in these stars is not predicted. Emission in the [O i] lines would seem highly improbable. The difficulty is that the [O i] lines are very weak in the spectra of such stars, and up to now only 4 dwarfs (Spiesman & Wallerstein spiesman91 (1991); Spite & Spite spite91 (1991)) and 2 subgiants (Fulbright & Kraft fulbright99 (1999); Cayrel et al. cayrel01 (2001); Israelian et al. israelian01 (2001)) have been studied. It is our goal in this paper to provide a more extensive study of the [O i] 6300 Å, the stronger of the 2 lines, in metal-poor main sequence and subgiant stars based on new VLT/UVES spectra. At the same time, we determine the iron abundance from weak Fe ii lines, which makes the derived O/Fe ratio practically independent of non-LTE effects, uncertainties in the assumed surface gravity, and only weakly dependent on errors in the effective temperature, . Furthermore, we compare the [O i] based abundances with non-LTE oxygen abundances derived from the O i 7774 Å triplet.
2 Observations and data reduction
The oxygen and iron abundances have been derived from spectra obtained with UVES, the Ultraviolet and Visual Echelle Spectrograph (Dekker et al. dekker00 (2000)) at the ESO VLT 8m Kueyen telescope, during three observing runs: April 8-12, 2000, July 22-24, 2000 and April 10-12, 2001. The main purpose of the April observations was to determine beryllium abundances from the Be ii lines at 3130 Å as observed in the blue arm of UVES. Using a dichroic filter the spectral range 4800-6800 Å region was observed simultaneously in the red arm of UVES with a resolution of 55 000 and about 4 pixels per spectral resolution element. The July 2000 observations were primarily conducted to determine the / isotopic ratio from the profile of the Li i resonance line at 6708 Å. The spectra were obtained with a narrow slit (0.3 arc sec) in combination with an image slicer and have a resolution of 120 000 with two pixels per spectral resolution element. Only the red arm of UVES was used and the spectral ranges covered were 6000 - 7000 Å with the EEV CCD and 7100-8200 Å with the MIT chip.
The spectra have been reduced using MIDAS for the April spectra and IRAF for the July spectra. Extensive testing has been performed between these two data reduction packages, showing that the final spectra are indeed of similar quality. In both cases the reduction includes definition of the echelle orders, background subtraction, flat-field division, extraction of orders, wavelength calibration and continuum normalization. The of the resulting spectra are very high: 300-400 per pixel for the April spectra and 400-600 for the July spectra. The continuum was fitted using cubic spline functions with a wavelength scale of about 5 Å. As the spectrum of a metal-poor star contains many good continuum regions this ensures that the continuum is well defined except in the vicinity of broad spectral features like the H line and the bandhead of telluric O2 lines.
Depending on the radial velocity of the star, the [O i] line may be blended by telluric O2 and H2O lines. In order to be able to remove these lines, several rapidly rotating B-type stars were observed. The IRAF task telluric was then used to optimize the fit between the telluric lines of the program star and the B-type star by allowing a relative scaling in airmass and a wavelength shift. The procedure worked well for the July 2000 observations due to the high resolution and a stable spectral PSF of UVES as defined by the output from the image slicer and the 0.3 arcsec entrance slit, but was less succesfull for the April observations, apparently because the PSF in this case is defined by a convolution of the entrance slit (0.7 arcsec) and the variable seeing profile of the star. Hence, we were not able to use the [O i] line in the April spectra if it was significantly overlapped by telluric lines.

Figure 1 shows some representative spectra. The first two are from the April 2000 observations and have close to 400, whereas the last two are from July 2000 and have . We note that in the case of HD 140283 the [O i] line was blended by a weak telluric H2O line ( mÅ). Care was taken to remove this line by a proper scaling of the B-type calibration spectrum based on numerous other H2O lines, but the presence of the blending H2O line adds to the uncertainty of the oxygen abundance derived for HD 140283.
3 Stellar parameters
On the basis of available Strömgren photometry and other literature data the programme stars were selected to lie rather close to the turnoff region of halo stars and to span the metallicity range . The oxygen abundance could not be determined for all stars because either the [O i] 6300 Å line was too weak to be detected or it was blended with telluric lines. Still, we want to derive stellar parameters, , log and [Fe/H] for all program stars. These parameters will also be needed in connection with the study of Li and Be abundances.
3.1 Effective temperature
was determined from the and colour indices using the IRFM calibrations of Alonso et al. (1996a ). Strömgren - photometry was taken from Schuster & Nissen (schuster88 (1988)) for the large majority of the stars supplemented with unpublished photometry of Schuster et al. (schuster02 (2002)) for the remaining stars. The calibration of Schuster & Nissen (schuster89 (1989)) (including a zero-point correction of +0.005 mag, Nissen nissen94 (1994)) was used to derive the interstellar reddening excess. If , the reddening is considered significant and the V magnitude as well as the and the indices are corrected according to the relations = , and . These values and the reddening estimates are given in Table 1.
| Star | [Fe/H] | Note | ||||||||||||
|---|---|---|---|---|---|---|---|---|---|---|---|---|---|---|
| HD 3567 | 9.255 | 0.332 | 0.087 | 0.334 | 2.598 | 0.002 | 1.369 | 6041 K | 5958 K | 1.16 | 3.86 | 4.16 | 0.31 | |
| HD 19445 | 8.053 | 0.352 | 0.051 | 0.203 | 2.583 | 0.001 | 1.394 | 5877 | 5942 | 2.04 | 5.14 | 5.12 | 0.10 | |
| HD 76932 | 5.801 | 0.354 | 0.117 | 0.297 | 2.581 | 0.017 | 1.445 | 5885 | 5829 | 0.86 | 4.42 | 4.16 | 0.04 | |
| HD 97320 | 8.168 | 0.338 | 0.081 | 0.303 | 2.614 | 0.014 | 1.364 | 5985 | 5968 | 1.21 | 4.20 | 4.42 | 0.09 | |
| HD 97916 | 9.209 | 0.293 | 0.104 | 0.407 | 2.638 | 0.002 | 1.173 | 6361 | 6296 | 0.86 | 3.59 | 3.64 | 0.35 | |
| HD 99383 | 9.076 | 0.343 | 0.063 | 0.275 | 2.593 | 0.006 | 1.390 | 5945 | 5934 | 1.6: | 4.43 | 4.28 | 0.29 | SB2 |
| HD 103723 | 9.947 | 0.329 | 0.104 | 0.306 | 2.625 | 0.027 | 6064 | 0.79 | 4.37 | 4.36 | 0.46 | |||
| HD 106038 | 10.179 | 0.342 | 0.092 | 0.264 | 2.583 | 0.018 | 1.408 | 5939 | 5897 | 1.37 | 4.69 | 4.99 | 0.36 | |
| HD 111980 | 8.366 | 0.369 | 0.106 | 0.292 | 2.574 | 0.008 | 1.585 | 5777 | 5610 | 1.07 | 4.37 | 3.85 | 0.24 | |
| HD 113679 | 9.627 | 0.386 | 0.136 | 0.320 | 2.579 | 0.017 | 1.560 | 5708 | 5649 | 0.66 | 4.21 | 3.80 | 0.42 | |
| HD 116064 | 8.700 | 0.324 | 0.057 | 0.273 | 2.603 | 0.025 | 1.345 | 6100 | 6025 | 2.0: | 4.60 | 4.66 | 0.20 | SB2 |
| HD 121004 | 9.031 | 0.395 | 0.140 | 0.268 | 2.588 | 0.012 | 1.557 | 5618 | 5653 | 0.75 | 4.89 | 5.15 | 0.18 | |
| HD 122196 | 8.632 | 0.320 | 0.062 | 0.335 | 2.597 | 0.023 | 6137 | 1.70 | 3.75 | 3.58 | 0.29 | |||
| HD 126681 | 9.300 | 0.400 | 0.130 | 0.191 | 2.553 | 0.013 | 1.640 | 5532 | 5515 | 1.17 | 5.50 | 5.71 | 0.16 | |
| HD 132475 | 8.377 | 0.360 | 0.075 | 0.277 | 2.578 | 0.041 | 1.463 | 5829 | 5808 | 1.45 | 4.39 | 3.55 | 0.23 | |
| HD 140283 | 7.213 | 0.380 | 0.033 | 0.284 | 2.564 | 0.015 | 1.580 | 5734 | 5646 | 2.42 | 3.53 | 3.42 | 0.12 | |
| HD 160617 | 8.733 | 0.347 | 0.051 | 0.331 | 2.584 | 0.011 | 1.408 | 5953 | 5909 | 1.79 | 3.27 | 3.42 | 0.31 | |
| HD 166913 | 8.230 | 0.327 | 0.074 | 0.309 | 2.598 | 0.003 | 6069 | 1.56 | 4.18 | 4.26 | 0.14 | |||
| HD 175179 | 9.072 | 0.384 | 0.146 | 0.268 | 2.582 | 0.004 | 1.594 | 5690 | 5597 | 0.70 | 4.89 | 4.44 | 0.28 | |
| HD 188510 | 8.834 | 0.416 | 0.100 | 0.163 | 2.553 | 0.010 | 1.669 | 5423 | 5481 | 1.61 | 5.83 | 5.85 | 0.10 | |
| HD 189558 | 7.735 | 0.386 | 0.111 | 0.284 | 2.572 | 0.003 | 1.607 | 5665 | 5561 | 1.11 | 4.47 | 3.58 | 0.16 | |
| HD 195633 | 8.472 | 0.343 | 0.121 | 0.368 | 2.606 | 0.018 | 6017 | 0.54 | 3.60 | 3.15 | 0.29 | |||
| HD 205650 | 9.052 | 0.375 | 0.093 | 0.231 | 2.569 | 0.005 | 1.490 | 5707 | 5759 | 1.17 | 5.02 | 5.40 | 0.14 | |
| HD 213657 | 9.658 | 0.322 | 0.050 | 0.337 | 2.597 | 0.007 | 6144 | 1.94 | 3.55 | 3.43 | 0.59 | |||
| HD 298986 | 10.049 | 0.324 | 0.080 | 0.301 | 1.312 | 6081 | 6061 | 1.35 | 4.35 | 4.48 | 0.40 | |||
| HD 338529 | 9.370 | 0.308 | 0.045 | 0.366 | 2.600 | 0.006 | 1.260 | 6278 | 6200 | 2.34 | 3.22 | 3.57 | 0.46 | |
| CD | 9.859 | 0.302 | 0.053 | 0.340 | 2.606 | 0.021 | 1.214 | 6288 | 6260 | 1.91 | 3.93 | 4.18 | 0.46 | |
| CD | 10.568 | 0.321 | 0.040 | 0.293 | 2.603 | 0.010 | 6147 | 2.34 | 4.24 | |||||
| CD | 9.527 | 0.343 | 0.113 | 0.271 | 1.418 | 5944 | 5873 | 0.89 | 4.66 | 4.67 | 0.19 | |||
| G 013009 | 9.916 | 0.292 | 0.054 | 0.369 | 2.609 | 0.019 | 1.219 | 6402 | 6275 | 2.30 | 3.68 | 3.71 | 0.59 | |
| G 020024 | 10.764 | 0.278 | 0.059 | 0.357 | 2.627 | 0.084 | 1.132 | 6469 | 6411 | 1.78 | 4.33 | |||
| G 075031 | 10.521 | 0.333 | 0.093 | 0.330 | 2.597 | 0.005 | 1.421 | 6035 | 5870 | 1.04 | 3.96 | |||
| G 088032 | 10.780 | 0.311 | 0.039 | 0.356 | 2.591 | 0.002 | 1.235 | 6251 | 6252 | 2.41 | 3.26 | |||
| G 126062 | 9.478 | 0.330 | 0.063 | 0.327 | 2.588 | 0.004 | 1.455 | 6058 | 5824 | 1.58 | 3.75 | 4.11 | 0.37 | |
| G 183011 | 9.861 | 0.319 | 0.050 | 0.310 | 2.602 | 0.006 | 1.354 | 6170 | 6015 | 2.10 | 4.08 | |||
| G 271162 | 10.264 | 0.306 | 0.055 | 0.355 | 2.602 | 0.020 | 1.275 | 6289 | 6170 | 2.31 | 3.61 | |||
| LP 81543 | 10.774 | 0.272 | 0.054 | 0.376 | 2.623 | 0.032 | 1.140 | 6558 | 6471 | 2.72 | 4.17 |
The photometry was taken from Carney (1983a ), Alonso et al. (alonso94 (1994)) and The Two Micron All Sky Survey (2MASS) data base (Finlator et al. finlator00 (2000)). Furthermore, Dr. A. Alonso kindly supplied unpublished magnitudes for a few additional stars and Dr. G. Simon sent us photometry for a number of southern stars observed in connection with the DENIS project (Epchtein et al. epchtein99 (1999)). In general, the photometry of the various sources agree within a typical scatter of mag for stars in common and no obvious systematic differences are seen. A straight mean value of from the various sources has therefore been adopted. Table 1 lists the corresponding index corrected for interstellar reddening according to the relation (Savage & Mathis savage79 (1979)) if .
When deriving from it was noted that the calibration equation of Alonso et al. (1996a , Eq. 9) contains a quadratic term in [Fe/H], which introduces a tendency for to diverge towards high values at very low metallicities. As pointed out by Ryan et al. (ryan99 (1999)) this behaviour (see their Fig. 5d) is likely to be a numerical artifact of the calibration. We have investigated the problem by comparing derived from the Alonso et al. calibration with original IRFM temperatures from Alonso et al. (1996b ) for a sample of 49 stars with Strömgren photometry and . Indeed, there is a trend that stars with are assigned too high a from the Alonso et al. calibration. To avoid this problem we have simply adopted a lower limit of in their Eq. (9). The calibration of (Alonso et al. 1996a , Eq. 7) has also a square term in [Fe/H]. The coefficient is, however, very small and the term is quite insignificant even at the lowest metallicities, .
The typical observational error of is 0.007 mag, which corresponds to an error of K in . The error of may be as high as 0.05 mag, but due to the high sensitivity of to this also leads to an error of K only. An independent estimate of the error may be obtained by comparing derived from and , respectively. Table 1 lists the data and Fig. 2 shows the comparison. As seen, is on the average 60 K higher than . We have not found any explanation of this offset, but we note that there are no significant correlations between the deviation and , absolute magnitude, or [Fe/H]. Hence, we adopt the mean value of and . For the six stars missing , a value K has been adopted.
The rms scatter of the difference shown in Fig. 2 is 68 K. This corresponds to a statistical error of about K on and assuming that they have the same error. If both and are available we should then be able to reach a statistical error of of about K, which is comparable to the accuracy claimed by Ryan et al. (ryan99 (1999)) in their study of Li abundances of metal poor halo stars. This is, however, an optimistic estimate of the error. Several of the stars, especially the most metal-poor ones, are distant enough to be significantly reddened, and considering that the reddening estimate is hardly better than an error of 70 K is introduced in both and . Furthermore, may be affected by systematic errors, which could depend on [Fe/H] and the position of the star in the HR diagram.

3.2 Surface gravity
The surface gravity was determined from the fundamental relation
where is the mass of the star and the absolute bolometric magnitude.
The absolute visual magnitude was determined from a new calibration of the Strömgren indices derived by Schuster et al. (schuster02 (2002)) on the basis of Hipparcos parallaxes, and also directly from the Hipparcos parallax (ESA esa97 (1997)) if available with an accuracy . Column 12 and 13 of Table 1 lists the photometric and the parallax based values of and in Fig. 3 the values are compared. As seen the agreement is quite satisfactory considering the estimated error bars. For two stars, HD 132475 and HD 189558, has a 3 deviation from of the order mag, which suggests that these stars are binaries consisting of two almost equal components. There is, however, no indication of double or asymmetric lines in their spectra, so we reject the binary hypothesis and consider the deviation in Fig. 3 as accidental. Two other stars, HD 99383 and HD 116064, have double lines, clearly indicating the presence of a fainter and cooler component to the main star. These spectroscopic binaries (SB2) stars were excluded from further analysis.

In calculating log we adopted the mean value of and if the parallax is available, otherwise . The bolometric correction is taken from Alonso et al. (alonso95 (1995), Table 4). The mass was derived by interpolating in the – diagram between the -element enhanced evolutionary tracks of VandenBerg et al. (vandenberg00 (2000)). The internal precision of the mass is estimated to be better than .
The error of the derived value of log is dominated by the error of ; corresponds to dex. In addition there could be a small systematic error of log but in view of the good overall agreement between and this systematic error is probably less than dex. Altogether we estimate that the error of log is on the order of dex.
The final values of and log are given in Table 2 together with values for [Fe/H] and the microturbulence as derived from Fe ii lines (Sect. 4). In addition, the absolute magnitude and the mass are given. As the calibration of and hence also log depend somewhat on [Fe/H] the determination of the three parameters is an iterative process.
| Star | log | [Fe/H] | Mass | |||
|---|---|---|---|---|---|---|
| [K] | [cgs] | [km/s] | [] | |||
| HD 3567 | 6000 | 4.07 | 1.16 | 1.5 | 4.01 | 0.82 |
| HD 19445 | 5910 | 4.40 | 2.04 | 1.3 | 5.13 | 0.70 |
| HD 76932 | 5857 | 4.15 | 0.86 | 1.2 | 4.29 | 0.85 |
| HD 97320 | 5976 | 4.16 | 1.21 | 1.3 | 4.31 | 0.78 |
| HD 97916 | 6328 | 4.11 | 0.86 | 1.5 | 3.61 | 1.02 |
| HD 103723 | 6034 | 4.26 | 0.79 | 1.3 | 4.36 | 0.88 |
| HD 106038 | 5918 | 4.31 | 1.37 | 1.2 | 4.84 | 0.70 |
| HD 111980 | 5694 | 3.99 | 1.07 | 1.2 | 4.11 | 0.79 |
| HD 113679 | 5678 | 4.04 | 0.66 | 1.2 | 4.00 | 0.96 |
| HD 121004 | 5635 | 4.34 | 0.75 | 1.1 | 5.02 | 0.80 |
| HD 122196 | 6107 | 3.93 | 1.70 | 1.5 | 3.66 | 0.78 |
| HD 126681 | 5524 | 4.48 | 1.17 | 0.7 | 5.61 | 0.70 |
| HD 132475 | 5818 | 3.95 | 1.45 | 1.4 | 3.97 | 0.75 |
| HD 140283 | 5690 | 3.69 | 2.42 | 1.5 | 3.47 | 0.75 |
| HD 160617 | 5931 | 3.77 | 1.79 | 1.5 | 3.35 | 0.82 |
| HD 166913 | 6039 | 4.11 | 1.56 | 1.3 | 4.22 | 0.73 |
| HD 175179 | 5643 | 4.20 | 0.70 | 1.0 | 4.66 | 0.80 |
| HD 188510 | 5452 | 4.53 | 1.61 | 0.8 | 5.84 | 0.68 |
| HD 189558 | 5613 | 3.91 | 1.11 | 1.2 | 4.03 | 0.76 |
| HD 195633 | 5987 | 3.95 | 0.54 | 1.4 | 3.38 | 1.10 |
| HD 205650 | 5733 | 4.39 | 1.17 | 1.0 | 5.21 | 0.70 |
| HD 213657 | 6114 | 3.85 | 1.94 | 1.5 | 3.49 | 0.77 |
| HD 298986 | 6071 | 4.21 | 1.35 | 1.3 | 4.41 | 0.76 |
| HD 338529 | 6239 | 3.87 | 2.34 | 1.5 | 3.40 | 0.79 |
| CD $-30°18140$ | 6274 | 4.12 | 1.91 | 1.5 | 4.06 | 0.75 |
| CD $-35°14849$ | 6117 | 4.12 | 2.34 | 1.5 | 4.24 | 0.70 |
| CD $-57°1633$ | 5909 | 4.32 | 0.89 | 1.2 | 4.66 | 0.84 |
| G 013-009 | 6338 | 4.00 | 2.30 | 1.5 | 3.70 | 0.76 |
| G 020-024 | 6440 | 4.30 | 1.78 | 1.5 | 4.33 | 0.78 |
| G 075-031 | 5952 | 4.07 | 1.04 | 1.3 | 3.96 | 0.87 |
| G 088-032 | 6251 | 3.81 | 2.41 | 1.5 | 3.26 | 0.80 |
| G 126-062 | 5941 | 3.98 | 1.58 | 1.3 | 3.93 | 0.76 |
| G 183-011 | 6092 | 4.04 | 2.10 | 1.5 | 4.08 | 0.70 |
| G 271-162 | 6230 | 3.93 | 2.31 | 1.5 | 3.61 | 0.75 |
| LP 815-43 | 6514 | 4.23 | 2.72 | 1.5 | 4.17 | 0.75 |
4 O and Fe abundances
The determination of abundances is based on -element enhanced ([/Fe]= +0.4, = C, O, Ne, Mg, Si, S, Ca, and Ti) 1D model atmospheres with , log and [Fe/H] values as given in Table 2 and a microturbulence of 1.0 km s-1. The models were computed with the MARCS code using updated continuous opacities (Asplund et al. asplund97 (1997)) and including UV line blanketing by millions of absorption lines. LTE is assumed both in constructing the models and in deriving abundances. We first discuss the determination of Fe abundances from Fe ii lines and then O abundances derived from the [O i] 6300 Å line and the O i triplet at 7774 Å.
4.1 Iron abundance
By inspecting the spectra of typical program stars as well as the solar spectrum, 13 apparently unblended Fe ii lines from Biémont et al. (biemont91 (1991), Table 2) were selected as suitable for determining the Fe abundance. The lines are listed in Table 3. The log values given are those of Biémont et al., i.e. based on theoretical transition probabilities and a normalization ( dex) from lifetime measurements. The lifetime measurements reported by Biémont et al. agree well with the re-analysis by Allende Prieto et al. (prieto02 (2002)) of published experimental data, including more recent results.
| Wavelength | exc.pot. | log | Solar flux | HD 189558 | HD 160617 | HD 140283 |
|---|---|---|---|---|---|---|
| A | eV | (mÅ) log(Fe) | (mÅ) [Fe/H] | (mÅ) [Fe/H] | (mÅ) [Fe/H] | |
| 4993.35 | 2.81 | 3.54 | 40.5 7.33 | 13.5 1.10 | 3.8 1.81 | |
| 5100.66 | 2.81 | 4.19 | 19.6 7.46 | 4.5 1.12 | 1.2 1.81 | |
| 5197.58 | 3.23 | 2.28 | 88.4 7.52 | 53.3 1.13 | 29.7 1.81 | 10.2 2.47 |
| 5234.62 | 3.22 | 2.20 | 90.5 7.46 | 56.4 1.09 | 33.4 1.76 | 12.7 2.39 |
| 5325.55 | 3.22 | 3.27 | 43.0 7.50 | 15.1 1.09 | 4.9 1.76 | |
| 5414.08 | 3.22 | 3.80 | 27.0 7.65 | 7.2 1.09 | 2.5 1.68 | |
| 5425.26 | 3.20 | 3.42 | 44.0 7.66 | 14.6 1.14 | 4.4 1.84 | 1.4 2.42 |
| 6084.10 | 3.20 | 3.86 | 21.3 7.52 | 5.5 1.07 | 1.4 1.80 | |
| 6149.25 | 3.89 | 2.77 | 38.0 7.51 | 11.8 1.10 | 3.9 1.76 | 1.2 2.33 |
| 6247.56 | 3.89 | 2.38 | 56.2 7.53 | 23.4 1.12 | 8.7 1.80 | 2.1 2.49 |
| 6416.93 | 3.89 | 2.79 | 42.4 7.62 | 11.8 1.19 | 4.2 1.83 | |
| 6432.68 | 2.89 | 3.76 | 43.0 7.65 | 14.8 1.13 | 4.6 1.81 | 1.3 2.46 |
| 6456.39 | 3.90 | 2.13 | 66.5 7.50 | 33.0 1.09 | 14.2 1.77 | 4.3 2.39 |
| Average: | 7.53 | 1.11 | 1.79 | |||
| Dispersion: | 0.08 | 0.03 | 0.04 | 0.06 |
Using the MARCS solar model and assuming a microturbulence of 1.15 km s-1 the equivalent widths of the lines as measured in the solar flux spectrum of Kurucz et al. (kurucz84 (1984)) were first analyzed. The results are given in Table 3. The average logarithmic solar abundance, log(Fe) = 7.53, is close to the commonly adopted meteoritic value of 7.50 (Grevesse & Sauval grevesse98 (1998)), but the dispersion is quite high (0.08 dex). We note that there is no significant correlation between the Fe abundance and the equivalent width of the lines suggesting that the chosen value of the microturbulence is approximately correct. Furthermore, it is seen that when determining differential Fe abundances for each line for three representative stars, HD 140283, HD 160617 and HD 189558, an amazingly small line-to-line scatter of [Fe/H] (0.03 - 0.06 dex) is obtained. This suggests that the scatter of the solar log(Fe) values is mainly due to errors in the -values. By working differentially with respect to the Sun this problem is avoided. For the whole set of program stars the scatter in [Fe/H] ranges from 0.03 to about 0.08 dex, and since at least four Fe ii lines are measured even in the most metal-poor stars (see Table A1 111Table A1 with equivalent widths of all lines measured is only available in electronic form at the CDS via anonymous ftp to cdsarc.u-strasbg.fr (130.79.128.5) or via http://cdsweb.u-strasbg.fr/Abstract.html), the statistical error of [Fe/H] is less than 0.05 dex.
In calculating abundances from the Fe ii lines we adopted the Unsöld (unsold55 (1955)) approximation to the Van der Waals interaction constant with an enhancement factor . We note that a decrease of to 1.0 leads to an increase of the solar iron abundance of +0.04 dex, whereas the Fe ii lines in the stars are weak enough to make the derived iron abundance practically independent of . Hence, the adopted value of has no more than a small systematic effect on the metallicity scale of the metal-poor stars and the derived [O/Fe] values.
In the more metal-poor stars, , the Fe ii lines are weak and hence the derived metallicity is practically independent of the microturbulence. For such stars we have assumed km s-1. For the more metal-rich stars has been derived by requesting that the derived [Fe/H] values should be independent of equivalent width. The two medium strong lines, 5197.58 Å and 5234.62 Å, get high weight in this determination. The error of is about km s-1. Due to the dominance of weaker lines the corresponding error of the mean value of [Fe/H] is negligible. It should be noted, by the way, that the derived microturbulence increases in a systematic way along the main sequence of stars in the HR-diagram, i.e. from about 0.8 km s-1 at K to km s-1 for turnoff stars at K.
The error of [Fe/H] induced by the uncertainty in is small, i.e. less than 0.02 dex. An error in log () corresponds, however, to an error of dex in [Fe/H]. Added (quadratically) to the error indicated by the line-to-line scatter from equivalent width measurements and the -values, we get a typical error of dex for [Fe/H].
4.2 Oxygen abundance from the [O i] 6300.3 Å line
The equivalent width of the 6300.3 Å spectral feature was measured relative to the continuum defined by the cubic spline fitting procedure described in Sect. 2 and by integrating the line depth over an interval of 0.35Å centered on 6300.31 Å. From the photon statistics we estimate an error mÅ for the April spectra and mÅ for the July spectra. As described later this is confirmed by a fitting between observed and synthetic spectra. The total equivalent width of the 6300.3 Å feature is given in Table 4 for all stars in which the line is detectable ( mÅ).
As recently shown by Allende Prieto et al. (prieto01 (2001)), the [O i] line at 6300.304 Å is significantly blended by a Ni i line at 6300.339 Å with eV. From a 3D model atmosphere synthesis of the 6300.3 Å feature in the solar flux spectrum of Kurucz et al. (kurucz84 (1984)) they estimate the oscillator strength of the Ni line to be log for an adopted solar Ni abundance of log(Ni) = 6.25. The corresponding (3D) oxygen abundance of the Sun is log(O) = 8.69 when using the accurate oscillator strength of the [O i] line, log (Allende Prieto et al. prieto01 (2001)).
The 6300.3 Å feature in the solar flux spectrum has an equivalent width of 5.5 mÅ. Subtracting the calculated equivalent width of the Ni line (1.4 mÅ), we determine a (1D) oxygen abundance of the Sun, log(O) = 8.74, in quite good agreement with the 3D result of Allende Prieto et al., but substantially lower than previous determinations that did not take the Ni line into account. Indeed, when accounting for the difference of 0.04 dex between 3D and marcs model atmosphere for the solar O abundance, our analysis agrees almost perfectly with that of Allende Prieto et al. (prieto01 (2001)).
Adopting now log for the Ni i line and assuming that the Ni abundance scales proportional to the Fe abundance (Edvardsson et al. edvardsson93 (1993)), the equivalent width of the Ni line (see Table 4) has been calculated and subtracted from the total equivalent width of the 6300.3 Å feature. The resulting is used to determine the oxygen abundances of the stars relative to that of the Sun, i.e. [O/H]. As seen from the table, the Ni line is rather weak in the metal poor stars and its inclusion decreases the derived oxygen abundance by less than 0.04 dex for stars with . For the Sun, however, the effect of including the Ni i line is a decrease of the oxygen abundance by 0.13 dex. Hence, the net effect of the Ni line for metal-poor halo stars is an increase of [O/Fe] with about 0.1 dex.
| Star | [Fe/H] | log(O) | [O/Fe] | ||||
|---|---|---|---|---|---|---|---|
| mÅ | mÅ | ||||||
| Sun (flux) | 0.00 | 5.5 | 1.4 | 8.74 | 0.00 | ||
| HD 3567 | 1.16 | 1.7 | 0.1 | 8.00 | 0.42 | +0.08 | 0.10 |
| HD 76932 | 0.86 | 3.3 | 0.2 | 8.32 | 0.44 | +0.06 | 0.06 |
| HD 97320 | 1.21 | 1.2 | 0.1 | 7.86 | 0.33 | +0.11 | 0.15 |
| HD 103723 | 0.79 | 1.7 | 0.2 | 8.13 | 0.18 | +0.09 | 0.10 |
| HD 111980 | 1.07 | 2.1 | 0.1 | 7.96 | 0.29 | +0.08 | 0.09 |
| HD 113679 | 0.66 | 4.5 | 0.4 | 8.39 | 0.31 | +0.05 | 0.05 |
| HD 121004 | 0.75 | 3.1 | 0.3 | 8.30 | 0.31 | +0.06 | 0.07 |
| HD 126681 | 1.17 | 1.8 | 0.1 | 8.03 | 0.46 | +0.09 | 0.10 |
| HD 132475 | 1.45 | 1.5 | 0.1 | 7.78 | 0.49 | +0.09 | 0.11 |
| HD 140283 | 2.42 | 0.5 | 0.0 | 7.09 | 0.77 | +0.15 | 0.22 |
| HD 160617 | 1.79 | 0.6 | 0.0 | 7.37 | 0.42 | +0.19 | 0.30 |
| HD 166913 | 1.56 | 0.6 | 0.0 | 7.57 | 0.39 | +0.18 | 0.30 |
| HD 189558 | 1.11 | 3.0 | 0.1 | 7.06 | 0.43 | +0.06 | 0.07 |
| HD 195633 | 0.54 | 3.0 | 0.4 | 8.28 | 0.08 | +0.07 | 0.07 |
| HD 205650 | 1.17 | 1.6 | 0.1 | 8.00 | 0.43 | +0.09 | 0.11 |
| HD 213657 | 1.94 | 0.4 | 0.0 | 7.31 | 0.51 | +0.18 | 0.30 |
| HD 298986 | 1.35 | 0.8 | 0.0 | 7.77 | 0.38 | +0.15 | 0.21 |
| G 075031 | 1.04 | 1.2 | 0.1 | 7.85 | 0.15 | +0.11 | 0.15 |
The effect of uncertainties in and log on [O/Fe] is small; K corresponds to dex, and most important, the effect of varying the gravity is very nearly the same on log(O) and log(Fe), when the two abundances are derived from the [O i] line and Fe ii lines, respectively. For example, an increase of the gravity of HD 132475 by as much as 0.3 dex changes [O/Fe] by less than 0.01 dex. Hence, [O/Fe] is not affected by errors in log . In practice, the error budget of [O/Fe] is totally dominated by the error of the equivalent width of the [O i] line. In order to check our estimate of this error source we have made a analysis of a comparison of synthetic spectra with some representative observed spectra.

The synthetic spectra are computed for the spectral region 6299 – 6302 Å. In addition to the [O i] and Ni i lines, Si i 6299.58 Å, Sc ii 6300.68 Å, and Fe i 6301.50 Å are included, see Fig. 4. The log values of these lines were set to get agreement between their calculated and observed equivalent widths, but they have practically no influence on the analysis, because the spectral regions of these lines are not included. The synthetic spectra are folded with a Gaussian profile representing the instrumental, macroturbulent and rotational broadening. The FWHM of this Gaussian is determined from the Fe i 6301.50 Å line, e.g. 5.8 km s-1 in the case of HD 3567. The analysis is then performed over the spectral regions indicated on Fig. 4, i.e. a total of 42 datapoints, of which the regions control the continuum setting and the region determines the O abundance. For each chosen oxygen abundance the continuum setting is optimized to get the smallest possible . In the case of HD 3567 the minimum is obtained for log(O) = 7.95 . The reduced is 0.88, and the quoted (one-sigma) error corresponds to . This oxygen abundance is 0.05 dex lower than the value determined from the measured equivalent width of the 6300.3 Å feature, but well within the estimated error bars. A similar analysis was performed for HD 160617 (July 2000 spectrum) and HD 132475 and HD 189558 (April 2000) confirming in all cases the oxygen abundances found from the measured equivalent widths of the 6300.3 Å spectral feature.
4.3 Oxygen abundance from the O i triplet
For the 15 stars belonging to the July 2000 program the O i triplet at 7774 Å was included in the UVES spectra. The triplet occurs in two consecutive echelle orders each with a S/N of 200-300 in the wavelength region of the triplet. Hence, two sets of equivalent widths could be measured and from the comparison, the error of the mean equivalent widths (given in Table 5) is estimated to be less than 1 mÅ. The high quality of the spectra is evident from Fig. 5, which shows the average spectra of the triplet for two representative stars.

From the equivalent widths of the triplet, LTE abundances were first derived using the model atmospheres employed in the [O i] analysis. The adopted -values are those recommended by Wiese et al. (wiese96 (1996)): = 0.369, 0.223, and 0.002. For a given star the three O i lines provide the same oxygen abundance to within about 0.03 dex except in the case of LP 815-43, for which the dispersion is around 0.09 dex due to the faintness of the lines. Estimated uncertainties of 70 K in , and 0.15 in correspond to (O) of 0.05 and 0.06, respectively. Uncertainties arising from the microturbulence and [Fe/H] may be neglected. We estimate the total error of (O) to be about 0.1 dex, whereas the error of [O/Fe] is in fact a bit smaller, because the gravity induced errors on the O and Fe abundances nearly cancel.
| Star | [Fe/H] | log(O) | log(O) | [O/Fe] | |||
|---|---|---|---|---|---|---|---|
| mÅ | mÅ | mÅ | LTE | n-LTE | n-LTE | ||
| HD 3567 | 1.16 | 49.2 | 41.0 | 29.5 | 8.14 | 7.94 | 0.36 |
| HD 19445 | 2.04 | 13.9 | 9.7 | 6.3 | 7.49 | 7.39 | 0.69 |
| HD 106038 | 1.37 | 39.5 | 32.1 | 22.9 | 8.10 | 7.94 | 0.57 |
| HD 140283 | 2.42 | 7.1 | 5.8 | 3.2 | 7.11 | 7.02 | 0.70 |
| HD 160617 | 1.79 | 19.9 | 14.9 | 9.7 | 7.46 | 7.34 | 0.39 |
| HD 213657 | 1.94 | 26.5 | 20.7 | 14.0 | 7.56 | 7.41 | 0.61 |
| HD 338529 | 2.34 | 16.7 | 13.3 | 7.4 | 7.20 | 7.06 | 0.66 |
| 1.91 | 27.2 | 21.5 | 14.7 | 7.56 | 7.41 | 0.58 | |
| 2.34 | 11.1 | 8.0 | 5.2 | 7.15 | 7.04 | 0.64 | |
| G 013009 | 2.30 | 14.8 | 12.4 | 7.8 | 7.15 | 7.01 | 0.57 |
| G 020024 | 1.78 | 26.8 | 20.6 | 13.6 | 7.49 | 7.34 | 0.38 |
| G 075031 | 1.04 | 55.7 | 44.4 | 34.3 | 8.28 | 8.06 | 0.36 |
| G 126062 | 1.58 | 38.4 | 30.1 | 21.0 | 7.96 | 7.79 | 0.63 |
| G 271162 | 2.31 | 13.2 | 9.5 | 5.9 | 7.08 | 6.96 | 0.53 |
| LP 81543 | 2.72 | 6.0 | 4.7 | 3.9 | 6.71 | 6.46 | 0.43 |
It is well established that the line formation process of the O i triplet in late-type stars is affected by departures from LTE (e.g. Kiselman 2001). To account for these important non-LTE effects, we have performed statistical equilibrium calculations using version 2.2 of the publicly available code MULTI (Carlsson 1986) for the stars listed in Table 5. For the purpose, a 23 level model atom (22 levels for O i plus the ground state of O ii) with 43 bound-bound and 22 bound-free radiative transitions has been adopted based on a model atom kindly provided by Dan Kiselman (2000, private communication). The radiative data comes mainly from Opacity Project calculations (Seaton 1987). As evidence is mounting that the simple-minded recipe of Drawin (drawin68 (1968)) to incorporate the effects of inelastic collisions with hydrogen overestimates the cross-sections by at least two orders of magnitude (Lambert lambert93 (1993); Belyayev et al. belyayev99 (1999); Kiselman kiselman01 (2001); Paul Barklem, 2001, private communication), such collisions are not included in the calculations. We have, however, performed test calculations with H collisions estimated following Drawin’s recipe multiplied with different factors for all stars, as discussed briefly below. Collisional excitation and ionization with electrons and charge transfer collisions with hydrogen and protons from the ground levels of O i and O ii are included. For details of the adopted atomic data we refer to Kiselman (1991, 1993) and Carlsson & Judge (carlsson93 (1993)). We note that the non-LTE results for O i are quite insensitive to including additional levels and transitions as the O i triplet line formation is well described by a two-level atom line source function with the line opacity remaining close to its LTE value (Kiselman kiselman93 (1993)). The important factors for the line formation instead is the line itself: the mean intensity dropping below the Planck function in the infrared, the collisional cross-sections and the line strength.
The 1D LTE abundances for the three O i triplet lines have been individually corrected for the predicted departures from LTE and the resulting mean non-LTE oxygen abundance and the corresponding [O/Fe] value are given in the last two columns of Table 5. In all cases the non-LTE effects have been estimated using MARCS model atmospheres (Asplund et al. asplund97 (1997)) with the stellar parameters listed in Table 2. The non-LTE abundance corrections amount to a 0.1-0.25 dex decrease of the LTE results, in agreement with previous calculations without large H collisional cross-sections (e.g. Kiselman 1991, 1993). The results remain largely intact also when including the effects of H collisions. With a factor of 0.01 times the Drawin estimates, the non-LTE abundance corrections are within 0.01 dex of the case without H collisions. Even when applying the Drawin values directly, the corrections only change by dex with the exception of LP 815-43 where the difference amount to 0.1 dex. We note that LP 815-43 has the largest non-LTE effect ( dex), which becomes even larger at yet smaller metallicities.
4.4 The influence of stellar granulation on [O i] and Fe ii lines
Although the [O i] and Fe ii lines are virtually immune to departures from LTE, the strengths of the lines depend on the detailed structure of the adopted atmospheric model. Properties of particular importance are the temperature gradient, the ratio of the line and continuous opacity and the atmospheric inhomogeneities and velocity fields introduced by convection in the surface layers, also known as stellar granulation. Since the [O i] and Fe ii lines are sensitive to different parts of the atmospheres due to the difference in excitation potential and ionization balance, it can not be taken for granted that the model atmosphere dependence cancels out when forming [O/Fe] abundance ratios, as is the case for analyses using 1D model atmospheres.
In order to estimate the effects of stellar granulation on our derived O and Fe abundances, the new generation of 3D, time-dependent hydrodynamical model atmospheres (e.g. Asplund et al. asplund99 (1999), 2000a,b,c) has been applied to study the line formation of the [O i] and Fe ii lines. The procedure is the same as that adopted for our recent investigation of the OH line formation (Asplund & García Pérez asplund01 (2001)): a strictly differential comparison has been performed between 1D marcs and 3D model atmospheres with identical stellar parameters. For details of the convection simulations the reader is referred to Asplund & García Pérez (asplund01 (2001)). The models employed here have a range of metallicities ( to and correspond to solar-like stars (, ) and turn-off stars (, ). In addition we have included the subgiant HD 140283 (, , ) using the 3D simulation presented in Asplund et al. (asplund99 (1999)). The same spectrum synthesis and atomic data (transition properties, continuous opacities, equation-of-state and chemical composition) have been employed in both 1D and 3D to isolate the impact of convection treatment from other possible sources of uncertainties. For all line calculations the assumption of LTE has been made, which, as noted before, is well justified. In the 3D case no macro- or microturbulence are needed while km s-1 has been adopted for the corresponding 1D calculations although only of some importance for the Fe ii lines in the solar metallicity models.
| log | [Fe/H] | [O/Fe]a | |||
|---|---|---|---|---|---|
| [K] | [cgs] | ||||
| 5767 | 4.44 | ||||
| 5822 | 4.44 | ||||
| 5837 | 4.44 | ||||
| 6191 | 4.04 | ||||
| 6180 | 4.04 | ||||
| 6178 | 4.04 | ||||
| 5690 | 3.67 | ||||
-
a
For these calculations and have been adopted for the Sun.
-
b
The impact of 3D model atmospheres on the derived stellar metallicities have been investigated for in total six Fe ii lines (6149, 6238, 6247, 6417, 6432 and 6456 Å). In all cases the different Fe ii lines give the same granulation corrections to within 0.03 dex.

The results for the [O i] line and a subset of the Fe ii lines utilized in Sect. 4.1 are summarized in Table 6. The impact on [O/Fe] is presented in Fig. 6 where the mean 3D granulation corrections for the different models are shown relative to the solar case 222The results shown in Fig. 6 supersede those presented in Asplund (asplund_ga01 (2001)) by the inclusion of Fe ii lines, use of additional and more temporally extended 3D model atmospheres and shown relative to the solar case.. Even if the influence of granulation on the derived O and Fe abundances are relatively small in most cases ( dex), the combined effects on [O/Fe] can be substantial amounting to dex at due to the opposite behaviour of the [O i] and Fe ii lines. In particular, the 3D correction to [O/Fe] is dex for HD 140283.
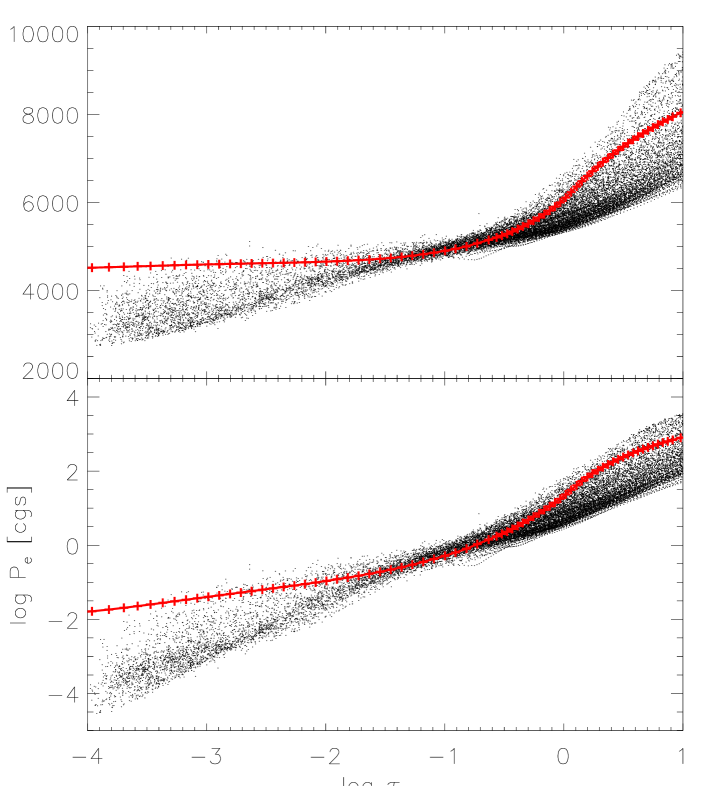
The selected Fe ii lines are predominantly sensitive to the temperature gradient in the deep atmospheric layers making them somewhat weaker in 3D at low [Fe/H] (Asplund et al. asplund99 (1999)). The [O i] line on the other hand feels the cool, sub-radiative equilibrium upper layers at low metallicities, making it significantly stronger in 3D than in 1D model atmospheres. At first sight, this behaviour may seem peculiar since the population of the lower level of the [O i] line is essentially insensitive to the temperature for these stars because it originates from the ground state of the dominant ionization stage. Instead the main effect on the line comes not from a change in line opacity but from differences in continuous opacities between 3D and 1D models. The strengths of weak lines like the [O i] (and Fe ii) lines depend on since the continuous opacity is provided mainly by H- around 630 nm and oxygen and hydrogen are predominantly in neutral form for these atmospheres. At low metallicities and the relevant temperatures, the number density of free electrons is very temperature sensitive. Thus, in order to compensate for the lack of electrons in the cool surface layers in the 3D model atmospheres, the abundance must be lowered to retain the same equivalent width as in the corresponding 1D model (Fig. 7).
This effect is not restricted to the [O i] line but applies equally well to any resonance line of a majority species, as illustrated in Fig. 8. For this comparison a number of fictitious lines of O i, Fe ii and S i with different excitation potentials have been computed for a few snapshots in the HD 140283 simulation as well as for the corresponding 1D marcs model atmosphere. The -values for the different transitions have been adjusted to produce a line of similar strength as the real [O i] line, i.e. mÅ. In all cases, the lines of O i, Fe ii and S i behave almost identically since all are majority species. For low excitation potentials the effect on the continuous opacities dominate while higher excitation lines, like the Fe ii lines utilized in the present study, are more sensitive to the effects on the line opacities and thus the temperature gradient in the deeper atmospheric layers.

For the discussion below in terms of the true mean trend in [O/Fe] as a function of [Fe/H] it is reasonable to approximate the 3D results according to the simple relation . We emphasize that this relation can not be assumed to be automatically valid for stellar parameters differing greatly from those given in Table 6. In particular, giants and subgiants, like BD $+23°3130$ which is discussed at some length below, may diverge from this relation given their lower and log . The sign is unlikely to change, however, and therefore [O/Fe] ratios based on [O i] and Fe ii lines should always become smaller in 3D than in 1D.
5 Discussion
5.1 [O i] and the oxygen problem
Our derived [O/Fe] values based upon the 1D hydrostatic model atmospheres are plotted versus [Fe/H] in Fig. 9 together with disk stars from Nissen & Edvardsson (nissen92 (1992)). Their [O/Fe] values were also obtained from the [O i] 6300.3 Å and Fe ii lines, but without any correction for the effect of the blending Ni i line. Hence, we calculated the equivalent width of the blend, subtracted it from the observed equivalent width of the 6300.3 Å feature, and recalculated the oxygen abundance. It is these new [O/Fe] values for the disk stars that are plotted in Fig. 9. No attempt has been made to correct for the small offset between the scale of Alonso et al. used here and that used by Nissen & Edvardsson, which was based on Edvardsson et al.’s (edvardsson93 (1993)) theoretical calibration of the index. Although an offset between the two sets of [O/Fe] values may be present, we expect it to be small due to the low sensitivity of [O/Fe] to .
We emphasise again that the combination of [O i] and Fe ii lines, as analysed with 1D model atmospheres yields a result for [O/Fe] which is insensitive to reasonable errors in the atmospheric parameters and to non-LTE effects. The [Fe/H] derived from the Fe ii lines is sensitive to the adopted surface gravity but insensitive to non-LTE effects. Our surface gravity estimates are not determined spectroscopically, as are many published values using the assumption of ionisation equilibrium. Although other spectroscopic indicators of the oxygen (and iron) abundances may be affected by multiple sources of uncertainty, the leading source of a systematic error in our abundance determinations is likely to arise from the simplifying assumptions entering into the calculation of the 1D model atmospheres.
As discussed in Sect. 4.4 and highlighted in Fig. 6, the effect of the stellar granulation as represented by the 3D hydrodynamic model atmospheres is significant for the most metal-poor stars. While emphasising that the grid of 3D models is as yet incomplete, we have interpolated corrections from Table 6 and constructed Fig. 10 as an approximation to the [O/Fe] versus [Fe/H] for the 3D model atmospheres.

Our sample is the first using accurate measurements of the [O i] line to provide extensive results for a large number of metal-poor (say, [Fe/H] ) dwarfs and subgiants. In light of the fact that published results using the [O i] line are mostly based on inferior spectra, a detailed comparison is not attempted; for example, Cavallo et al. (cavallo97 (1997)) draw from the literature two quite different measurements for the 6300 Å line in HD 76932 ( = 10 mÅ, and 1.8 mÅ) with neither one close to our measurement of 3.3 mÅ. Two metal-poor subgiants were analysed recently by Fulbright & Kraft (fulbright99 (1999)). Since one – BD $+23°3130$ – has been the object of several recent discussions, we discuss it in some detail later in this section. Results from the [O i] lines in giants are discussed separately.
Attention was sharply focussed on oxygen abundances in metal-poor stars by studies of the OH ultraviolet lines (Israelian et al. israelian98 (1998), israelian01 (2001); Boesgaard et al. boesgaard99 (1999)). These showed that [O/Fe] indices derived from the OH ultraviolet lines in metal-poor dwarfs were higher than the values obtained previously from [O i] lines in metal-poor giants. The latter results had shown that [O/Fe] was approximately constant () for [Fe/H] . In sharp contrast, the OH-based results showed [O/Fe] to increase quasi-linearly with decreasing [Fe/H]. The discrepancy between the abundance from OH in dwarfs and [O i] in giants was negligible for [Fe/H] but increased steadily to about 0.6 to 0.7 dex at [Fe/H] . Earlier, an analysis of the O i triplet lines near 7774 Å in metal-poor dwarfs had also given high [O/Fe] values indicating a sharp disagreement with results from the [O i] 6300 Å line in giants (Abia & Rebolo abia89 (1989)).
With our analyses of the [O i] line in dwarfs, we look afresh at the seemingly discrepant oxygen abundances. In particular, we focus on three key questions:
-
•
Do the [O i] line and the OH lines provide consistent oxygen abundances for dwarfs and subgiants?
-
•
Do the [O i] line and the O i 7774 Å triplet provide similar abundances for dwarfs and subgiants?
-
•
Is the oxygen abundance – metallicity dependence similar for dwarfs and giants?
5.2 [O i] and OH lines
How do our new [O i]-based abundances agree with those derived from the OH ultraviolet lines, when both are obtained from classical 1D model atmospheres? A comparison is illuminating given the heat the ‘oxygen problem’ has generated in recent times.
Eight of our programme stars were analysed by Israelian et al. (israelian98 (1998)) or Israelian et al. (israelian01 (2001)). Differences in adopted model atmosphere parameters are small: 103 K, g = 0.18 0.26, and [Fe/H] = 0.19 0.07 where the sense of the difference is ‘this paper Israelian et al.’. Israelian et al. chose their model atmosphere parameters and [Fe/H] from the literature. Different grids of 1D model atmospheres were used in the two studies.
For four of the eight common stars, we determined the oxygen abundance from the [O i] line. For this quartet which includes HD 140283 – the most metal-poor star in our sample – the average difference between our abundances ([O/H] not [O/Fe]) from the 1D model atmospheres (Table 4) and those from OH is dex. If adjustments are made for the use of different grids of model atmospheres and atmospheric parameters, the mean difference may increase to about dex for these stars with [O/H] between and . Israelian et al. (israelian98 (1998)) adjusted the -values of the OH lines to match the solar OH lines. In analysing spectra of the metal-poor stars, it seems preferable to adopt not solar -values but the reliable theoretical-experimental -values. Meléndez et al. (melendez01 (2001)) argue that were the latter -values adopted the published OH-based abundances would be lowered by 0.1 - 0.2 dex, and then the mean difference would increase from dex to between 0.0 and 0.1 dex.
Six of our stars are in the sample analysed by Boesgaard et al. (boesgaard99 (1999)), who presented OH-based results for two different scales. Their atmospheric parameters based on Carney’s (1983b ) scale are similar to ours: = 15 34 K, = 0.09 0.20, and [Fe/H] = 0.12 0.07. Of these six, we determined oxygen abundances for two (including HD 140283). After small corrections are applied for differences in the adopted model atmospheres, differences in [O/H] are +0.1 and dex. Since Boesgaard et al. also adjusted -values to fit solar lines, there will be, as in the case of Israelian et al., a slight revision downward of the published abundances when laboratory -values are used. 333The O abundance derived from OH UV and IR lines is dependent on the assumed dissociation energy of OH. Most analyses appear to adopt eV, a recommendation by Huber & Herzberg (huber79 (1979)) based on a spectroscopic estimate by Carlone & Dalby (carlone69 (1969)). A recent recommendation provides eV (Ruscic et al. ruscic02 (2002)) from new experimental and theoretical evidence and a reevaluation of the spectroscopic data. Use of the new will result in slightly lower O abundances. This revision is ignored here.
These two comparisons show that, where a direct comparison is possible, analyses of the ultraviolet OH and the 6300 Å [O i] lines using 1-D model atmospheres give consistent oxygen abundances for metal-poor dwarfs and subgiants. This result applies to stars with [Fe/H] .
Comparison of results is more commonly made in terms of the run of [O/Fe] versus [Fe/H], but this introduces other considerations. The adopted solar O and Fe abundances now enter the picture. Our adopted solar oxygen abundance is about 0.2 dex smaller than chosen in the papers covering OH. Since the OH analyses used solar -values, the lower solar abundance should not affect their [O/Fe] values but it likely accounts for the fact that the solar -values for OH lines were 0.1 - 0.2 dex smaller than the laboratory -values (see above). Additional effects should be noted. Kurucz models were used for the OH analyses but MARCS models for the [O i] line, but the effect on [O/Fe] indices is likely small ( 0.1 dex). Also, our [Fe/H] are systematically slightly larger than those adopted in the OH analyses. The net effect of these various factors may not exceed about 0.1 dex in [O/Fe].
The OH-based results imply a linear relation between [O/Fe] and [Fe/H] with a slope of 0.02 (Israelian et al. israelian01 (2001)), a relation which runs along the upper boundary of the points in Fig. 9 for [Fe/H] . In short, the two indicators give reasonably consistent results.
The much discussed subgiant star BD $+23°3130$, which has been added to Fig. 9, was thrust into the oxygen debate by Fulbright & Kraft (fulbright99 (1999)) who measured the [O i] 6300 Å line and argued that the resulting [O/Fe] did not support the high values from OH ultraviolet lines. Others have discussed the [O i] line in BD obtaining different results. We have reanalyzed BD $+23°3130$ in the same way as our ‘own’ stars. We take the equivalent width of the 6300 Å line from Cayrel et al. (cayrel01 (2001)) who obtained an UVES spectrum of BD $+23°3130$ and determined the equivalent width of [O i] 6300.3 Å to mÅ, where the quoted error seems to be a rather conservative estimate in view of the published high S/N spectrum.
From unpublished Strömgren photometry of BD $+23°3130$ (Schuster et al. schuster02 (2002)) K is derived, and = 1.975 (Laird et al. laird88 (1988)) leads to K. In both cases the IRFM calibration for giants by Alonso et al. (alonso99 (1999)) has been used and it was assumed that the star is unreddened. Adopting the average = 5170 K, the gravity derived via the Hipparcos parallax is . Two of the Fe ii lines from the list in Table 3, 5197.58 Å and 5234.63 Å, were observed by Fulbright & Kraft (fulbright99 (1999)) and have equivalent widths of 19.6 and 23.0 mÅ, respectively. The corresponding metal abundance is . With these parameters and using the equivalent width of the [O i] 6300.3 Å line given by Cayrel et al., we get , the value plotted in Fig. 9. However, it cannot be excluded that BD $+23°3130$ (distance pc) is significantly reddened. Actually, the observed index of the star (Schuster et al. schuster02 (2002)) suggests K based again on the calibration of Alonso et al. (alonso99 (1999)). This temperature would lead to .
This shows that BD $+23°3130$ confirms our result for HD 140283. The oxygen abundance for BD $+23°3130$ is (O) = 6.99. Israelian et al. (2001) for a Kurucz model having almost identical atmospheric parameters obtained (O) = 7.10 from OH ultraviolet lines. Balachandran et al. (2001) also adopted Cayrel et al.’s for the 6300 Å line and with atmospheric parameters essentially identical to ours found (O) = 7.03 0.15. Reanalysis of Israelian et al.’s (israelian98 (1998)) equivalent widths of OH ultraviolet lines with laboratory -values gave (O) = 7.06 0.11, and analysis of their own measurements of OH infrared vibration-rotation lines gave (O) = 7.00 0.07. Thus, as for other metal-poor stars, the [O i] and OH ultraviolet (and infrared) lines give concordant results.

The OH molecule also provides vibration-rotation lines from the ground electronic state. Fundamental or first overtone lines have been detected and analysed in a few cool metal-poor dwarfs. Given spectra of adequate , the infrared lines have the advantages over the ultraviolet lines that they lie in a cleaner spectral interval, and are likely to be formed in LTE. In addition to BD $+23°3130$ mentioned above, results are available for three additional metal-poor dwarfs. Balachandran & Carney (balachandran96 (1996)) discuss HD 103095 (Gmb 1830) obtaining (O) = 7.83 from OH infrared lines or [O/Fe] = 0.31 for [Fe/H] = . Meléndez et al. (melendez01 (2001)) give a similar result: after correction for our lower solar oxygen abundance, [O/Fe] 0.4 at [Fe/H] = . These values fit the results in Fig. 9 for [Fe/H] . Results for two other dwarfs at [Fe/H] = and according to Meléndez et al. fall at the upper end of the distribution in Fig. 9. Balachandran et al.’s run of [O/Fe] versus [Fe/H] from OH infrared lines in nine stars with [Fe/H] from to resembles the distribution of points in Fig. 9, but a 0.1 dex increase for the lower solar oxygen abundance should be applied. A closer comparison is not possible because details of the infrared analyses are unpublished.
The preceding comparisons between [O i] and OH lines were based on the use of 1D model atmospheres and ignored the effects of granulation. In Section 4.3, we discussed these effects on the [O i] line. Abundances corrected approximately for these 3D effects are shown in Fig. 10. Analogous effects on the OH lines were discussed by Asplund & García Pérez (asplund01 (2001)). For a given effective temperature, the infrared and ultraviolet OH lines are similarly sensitive to the effects of granulation (Asplund & García Pérez 2001). The effects of granulation on the OH lines appears to decline with decreasing effective temperature. Since stars observed for their infrared OH lines are generally cooler than those observed for the ultraviolet lines, the abundance corrections applicable in the case of the infrared OH lines may in practice be smaller than for the ultraviolet lines (with the exception that not yet investigated non-LTE effects may impact the UV but not the IR lines). We note though that no 3D models with parameters appropriate for the IR targets at low metallicities are yet available to verify the continuation of the 3D behaviour down to these lower .
The 3D corrections of abundances derived from [O i] and OH are qualitatively similar in that the corrections increase with decreasing metallicity, but the corrections for OH are larger than for [O i]. At [Fe/H] = , the approximate limit of our sample, the OH-based O abundance is reduced by about 0.5 dex at = 5800 K, and by about 0.7 dex at = 6200 K, but the [O i]-based abundances are decreased by only about 0.2 dex. Given that we have found OH and [O i] lines to give essentially the same abundance with the 1D atmospheres, an application of the 3D atmospheres would apparently reopen the oxygen problem that we have just closed. A resolution of this problem may lie in the replacement of the assumption of LTE by non-LTE. The [O i] line is immune to non-LTE effects but formation of OH ultraviolet lines in non-LTE will lead to weaker lines, and, hence, the need for a higher O abundance; Asplund & García Pérez estimate a rough correction of 0.2 dex but with little [Fe/H] sensitivity. This correction would not apply to the OH infrared lines. An additional factor applicable to both ultraviolet and infrared lines is that the OH density may not be at its LTE value throughout the atmosphere when granular flows are present.
Since the [O i] and Fe ii lines are immune to non-LTE effects and the corrections for stellar granulation are relative small, we present our abundances with the estimated corrections from the 3D model atmospheres as the best indicator of oxygen abundances for metal-poor dwarfs (Fig. 10). After correction for stellar granulation, the index [O/Fe] rises with decreasing [Fe/H] to reach the ‘low’ value [O/Fe] 0.3 - 0.4 for [Fe/H] from about to with perhaps an increase to lower [Fe/H]. Certainly, the OH ultraviolet lines as analysed using 1D atmospheres indicate a rising [O/Fe], but the 3D atmospheres suggest an increasing correction with decreasing [Fe/H] which cancels much of the apparent rise.
By showing that the OH and [O i] lines give consistent abundances when analysed with 1D atmospheres, we appear to have removed a key part of the oxygen problem. Yet, the 3D atmospheres by suggesting lower oxygen abundances from OH lines than from the [O i] line introduce an inverse of the original problem. While consideration of non-LTE effects may yet correct this inverse problem, the largest potential source of systematic errors in oxygen abundance determinations may reside in present realisations of stellar granulation.
5.3 [O i] and O i lines
The permitted triplet of O i lines near 7774 Å has been analysed extensively in metal-poor dwarfs and giants. Analysts of the OH ultraviolet lines have argued that the OH and O i lines provide consistent oxygen abundances. Other analyses of the O i lines have confirmed that the O i lines give ‘high’ [O/Fe] values for metal-poor stars (e.g., Cavallo et al. cavallo97 (1997); Mishenina et al. mishenina00 (2000)).
As described in Sect. 4.3 we determined oxygen abundances from a non-LTE analysis of the O i triplet for 15 stars. The resulting [O/Fe] values are plotted in Fig. 9. As seen the triplet gives [O/Fe] indices similar to the 1D values from the [O i] line. For five of the 15 stars, we used both the permitted and the forbidden line finding differences (permitted - forbidden) ranging from to 0.21 dex and a mean difference of 0.03 dex. This good agreement exists for analyses using the 1D model atmospheres.
Present indications (Asplund asplund_ga01 (2001)) are that a LTE analysis using an equivalent 3D model atmosphere leads to a less than 0.1 dex change in the oxygen abundance from O i lines. Then, application of 3D model atmospheres reduces the abundance from the [O i] line more than that from the O i lines. Unless the non-LTE corrections to the O i lines are enhanced in the 3D model atmospheres, oxygen abundances from the O i lines may be dex larger than from the [O i] line.
5.4 Oxygen abundances in dwarfs and giants
Arguments favoring the [O i] - Fe ii combination of lines as the optimal indicator of the [O/Fe] ratio hold for giants as well as dwarfs. Indeed, the run of [O/Fe] versus [Fe/H] was considered as well established from [O i] lines in giants well before the appearance of the measurements of OH ultraviolet lines in dwarfs. For example, Barbuy (barbuy88 (1988)) showed that [O/Fe] +0.4 from analyses of metal-poor giants with [Fe/H] extending down to . (Her estimates of [Fe/H] are not based on Fe ii but Fe i lines, although the few illustrated fits to observed spectra imply a good fit to the Sc ii line near 6300.6 Å). Other analyses using the [O i] line gave similar results for [O/Fe] (e.g., Lambert et al. lambert74 (1974); Gratton & Ortolani gratton86 (1986); Sneden et al. sneden91 (1991); Kraft et al. kraft92 (1992)). Since most analyses referenced the stellar oxygen abundance to a solar abundance approximately 0.2 dex higher than our adopted value, and used a value 0.03 dex smaller than our value, the published [O/Fe] should be increased by about 0.2 dex. In some cases, a revision should be applied also to account for different values of the solar iron abundance. Early analyses may have adopted a solar abundance (Fe) = 7.65 instead of the now favored value close to (Fe) = 7.50. Such revisions simultaneously to the solar O and Fe abundances cancel almost exactly for [O/Fe].
Recently, Sneden & Primas (sneden01 (2001)) obtained high-quality spectra and analysed the [O i] 6300 Å line alongwith Sc ii and Fe ii lines to give [O/Fe] and [O/Sc] with [Sc/Fe] 0.0 expected from many studies. After adjustment for our lower solar oxygen abundance and higher -value for the forbidden line, their preliminary result is [O/Fe] +0.45 with an indication of a slight increase with decreasing [Fe/H] to reach [O/Fe] +0.6 at [Fe/H] = from [O/Fe] +0.45 at [Fe/H] = . In view of the insensitivity of the [O/Fe] results to the adopted model atmospheres, these results are unlikely to change appreciably for alternative choices of effective temperature, and surface gravity.
King (king00 (2000)) discussed published analyses of [O i] and Fe ii lines in metal-poor giants and obtained almost identical results (see his Fig. 5). Much of King’s paper is concerned with the application of non-LTE corrections to published iron abundances derived from Fe i as a way to reconcile disagreements over the run of [O/Fe] with [Fe/H]. By focussing on [O i] and Fe ii lines, non-LTE becomes a moot issue. Insensitivity to non-LTE effects is a powerful advantage of using Fe ii lines given the preliminary nature of extant non-LTE predictions for iron.
At [O/Fe] +0.5, the giants’ [O i] and Fe ii lines provide results for [O/Fe] comparable to those in Fig. 9. The predicted effects of granulation on [O/Fe] for dwarfs lower the ratio significantly from values obtained using 1D model atmospheres. Preliminary corrections give the results shown in Fig. 10, where [O/Fe] +0.3 for for dwarfs. It is these results that are in mild disagreement with those from giants obtained from the [O i] – Fe ii combination of lines and 1D model atmospheres. To take the final step in the application of the [O i] and Fe ii lines to a definitive determination of [O/Fe] for metal-poor stars, it is necessary to apply 3D model atmospheres to analyses of lines in spectra of giants, but such 3D model atmospheres do not yet exist. One might speculate that effects of stellar granulation on the lines in giants will lower [O/Fe] by about 0.2 dex.
The OH vibration-rotation lines but not the ultraviolet lines have been used to obtain oxygen abundances for giants (Meléndez et al. melendez01 (2001)). The published results depend on the choice of atmospheric parameters: [O/Fe] = +0.5 or +0.3. These values should be increased by about 0.13 dex to account for the reduction in the solar oxygen abundance. A mean of the two values with the increase of 0.13 dex gives [O/Fe] 0.5, a result consistent with that from the forbidden oxygen line.
Oxygen triplet lines in giants ( 3.0) were observed and analysed by Cavallo et al. (cavallo97 (1997)). Their LTE results for [O/Fe] for [Fe/H] fall above our points in Fig. 9: [O/Fe] +0.8 for [Fe/H] . Mishenina et al. (mishenina00 (2000)) observed a few additional giants and undertook a non-LTE analysis for their stars as well as Cavallo et al.’s sample. Non-LTE effects as implemented by Mishenina et al. reduce [O/Fe] by about 0.1 dex on average, and the non-LTE oxygen abundances leave [O/Fe] significantly above ours in Fig. 9: [O/Fe] 0.37[Fe/H] + 0.11 is a fit by eye to Mishenina et al.’s results for giants. Our lower solar oxygen abundance implies that the published [O/Fe] should be increased by 0.2 dex. A critical analysis of the atmospheric parameters for giants including the [Fe/H] indices might be instructive; we note that for three of the four stars in common between Cavallo et al. and Johnson & Bolte (johnson01 (2001)), an example of a recent spectroscopic analysis, there are large differences in the adopted atmospheric parameters with the recent choices leading apparently to larger [O/Fe] indices. It remains to consider the non-LTE effects on the iron lines, or to minimize their influence by analysing the Fe ii lines. In the context of 1D model atmospheres, the high oxygen abundance for giants from the triplet lines remains the outstanding issue of the oxygen problem.
6 Concluding remarks
In this paper, we have demonstrated that an efficient high-resolution spectrograph on a very large telescope can now provide firm detections of the weak [O i] lines in spectra of metal-poor dwarfs. Analysis of the forbidden oxygen lines with Fe ii lines provides an estimate of [O/Fe] which is insensitive to the adopted model atmosphere parameters and log .
Our results using standard 1D model atmospheres show [O/Fe] to increase with decreasing [Fe/H] (Fig. 9). We have shown that the oxygen problem largely vanishes when 1D models are applied; in particular we find a satisfactory agreement between oxygen abundances derived from the [O i] 6300 Å line in dwarfs and subgiants and abundances obtained from OH ultraviolet and infrared lines, and the O i triplet lines. Published results for [O/Fe] in metal-poor giants using also the [O i] – Fe ii combination of lines are compatible with results in Fig. 9 from the same combination. Observations of the O i lines in giants give LTE abundances and [O/Fe] values larger than our [O i]-based results in Fig. 9. Non-LTE effects reduce the discrepancy.
Application of 3D model atmospheres reintroduces in a mild fashion aspects of the oxygen problem. The LTE OH-based oxygen abundances for dwarfs appear to be less than the [O i]-based results, but the O i-based results are appreciably larger than the [O i]-based results in Fig. 10. Non-LTE effects yet to be quantitatively assessed for OH and O i lines in the 3D atmospheres may reduce these differences relative to the non-LTE insensitive [O i] line. There are also small abundance differences between results from 3D atmospheres for dwarfs and 1D atmospheres for giants. Differences arising from the introduction of the 3D atmospheres should challenge the confidence of stellar spectroscopists using the now extensive grids of 1D model atmospheres. To respond to this challenge theoretical studies of atmospheric inhomogeneities (granulation) must be pursued. There is an urgent need for 3D model atmospheres for giants. A parallel effort on observational quantification of the effects of granulation on spectral lines (and the continuum fluxes) must be carried out: measurements of line asymmetries and velocity shifts, as well as equivalent widths of lines. Lack of understanding of stellar granulation may presently be the primary source of systematic errors in abundance analyses. Evidence presented here indicates that the magnitude of these errors may well exceed the errors often confidently attached to abundances derived from classical model atmospheres.
Finally, we note that in describing plots like Fig. 10 there is a tendency to impose a simple linear relation onto the points. Instead one might identify a plateau at [O/Fe] +0.3 for [Fe/H] from about to with a rise to higher [O/Fe] at lower [Fe/H]. Furthermore, not all stars may lie on a single relation. Although much of the apparent scatter about a mean relation is attributable to measurement errors, there are a few stars that most probably fall off a mean relation. HD 103273 with a lower than average oxygen abundance is a halo star known to be unusually deficient in Mg, Si, and Ca (-elements) (Nissen & Schuster nissen97 (1997)), and a slight oxygen deficiency fits this pattern. G 75-31 may be another example of an -poor star. HD 78558 is a thick-disk star with an above average [/Fe] and, hence, its unusually high [O/Fe] is not unexpected. The star has a small mean galactocentric distance according to Nissen & Edvardsson (nissen92 (1992)). In order to investigate the reality of this possible cosmic scatter of [O/Fe] at a given value of [Fe/H] a much larger sample spanning stars with different Galactic orbits should be studied.
Acknowledgements.
Drs. A. Alonso and G. Simon are thanked for sending magnitudes of some stars in advance of publication. The authors are indebted to Dan Kiselman for kindly sharing his expertise in non-LTE line formation and his O i model atoms. MA and PEN acknowledge the Swedish and Danish Natural Science Research Councils for financial support of the present project. DLL thanks the R. A. Welch Foundation of Houston, Texas (grant F-634) for support. This research has made use of the SIMBAD database operated at CDS, Strasbourg, France.References
- (1) Abia, C., & Rebolo, R. 1989, A&A, 347, 186
- (2) Allende Prieto, C., Lambert, D.L., & Asplund, M. 2001, ApJ, 556, L63
- (3) Allende Prieto, C., Asplund, M., García Lopez, R., & Lambert, D.L. 2002, ApJ, in press
- (4) Alonso, A., Arribas, S., & Martínez-Roger, C. 1994, A&AS, 107, 365
- (5) Alonso, A., Arribas, S., & Martínez-Roger, C. 1995, A&A, 297, 197
- (6) Alonso, A., Arribas, S., & Martínez-Roger, C. 1996a, A&A, 313, 873
- (7) Alonso, A., Arribas, S., & Martínez-Roger, C. 1996b, A&AS, 117, 227
- (8) Alonso, A., Arribas, S., & Martínez-Roger, C. 1999, A&AS, 140, 261
- (9) Asplund, M., Gustafsson, B., Kiselman, D., & Eriksson, K. 1997, A&A, 318, 521
- (10) Asplund, M., Nordlund, Å., Trampedach, R., & Stein, R.F. 1999, A&A, 346, L17
- (11) Asplund, M., Ludwig, H.-G., Nordlund, Å., & Stein, R.F. 2000a, A&A, 359, 669
- (12) Asplund, M., Nordlund, Å., Trampedach, R., Allende Prieto, C., & Stein, R.F. 2000b, A&A, 359, 729
- (13) Asplund, M., Nordlund, Å., Trampedach, R., & Stein, R.F. 2000c, A&A, 359, 743
- (14) Asplund, M. 2001, in Highlights of Astronomy, IAU 24 Gen. Ass., Ed. B. Barbuy, in press
- (15) Asplund, M., & García Pérez, A.E. 2001, A&A, 372, 601
- (16) Balachandran, S.C., & Carney, B.W. 1996, AJ, 111, 946
- (17) Balachandran, S.C., Carr, J.S., & Carney, B.W. 2001, New Astronomy Rev., 45, 529
- (18) Barbuy, B. 1988, A&A, 191, 121
- (19) Belyayev A., Grosser J.J.H., Menzel T. 1999, Phys Rev., A 60, 2151
- (20) Biémont, E., Baudoux, M., Kurucz, R.L., Ansbacher, W., & Pinnington, E.H. 1991, A&A, 249, 539
- (21) Boesgaard, A.M., King, J.R., Deliyannis, C.P., & Vogt, S.S. 1999, AJ 117, 492
- (22) Carlone, C., & Dalby, F.W. 1969, Can. J. Phys., 47, 1945
- (23) Carlsson M. 1986, Uppsala Astronomical Observatory Report No. 33
- (24) Carlsson M., Judge P. 1993, ApJ, 402, 344
- (25) Carney, B.W. 1983, AJ, 88, 610
- (26) Carney, B.W. 1983, AJ, 88, 623
- (27) Cavallo, R.M., Pilachowski, C.A., & Rebolo, R. 1997, PASP, 109, 226
- (28) Cayrel, R., Andersen, J., Barbuy, B., et al. 2001, New Astronomy Rev., 45, 533
- (29) Dekker, H., D’Odorico, S., Kaufer, A., et al. 2000, in SPIE Proc., 4008, 534
- (30) Drawin, H.-W. 1968, Z. Phys., 211, 404
- (31) Edvardsson, B., Andersen, J., Gustafsson, B., et al. 1993, A&A, 275, 101
- (32) Epchtein, N., Deul, E., Derriere, S., et al. 1999, A&A, 349, 236
- (33) ESA 1997, The Hipparcos and Tycho Catalogues, ESA SP-1200
- (34) Finlator, K., Ivezic, Z., Fan, X., et al. 2000, AJ, 120, 2615
- (35) Fulbright, P., & Kraft, R.P. 1999, AJ, 118, 527
- (36) Goswami, A., & Prantzos, N. 2000, A&A, 359, 191
- (37) Gratton, R.G., & Ortolani, S. 1986, A&A, 169, 201
- (38) Grevesse, N., & Sauval, A.J. 1998, Space Sci. Rev., 85, 161
- (39) Hinkle, K.H., & Lambert, D.L. 1975, MNRAS 170, 447
- (40) Huber, K.P., & Herzberg, G. 1979, Constants of Diatomic Molecules (New York: Van Nostrand Reinhold)
- (41) Israelian, G., García Lopez, R.J., & Rebolo, R. 1998, ApJ, 507, 805
- (42) Israelian G., Rebolo, R., García Lopez R.J., et al. 2001 , ApJ, 551, 833
- (43) Johnson, J.A., & Bolte, M. 2001, ApJ, 554, 888
- (44) King, J.R. 2000, AJ, 120, 1056
- (45) Kiselman D. 1991, A&A, 245, L9
- (46) Kiselman, D. 1993, A&A, 275, 269
- (47) Kiselman, D. 2001, New Astronomy Rev., 45, 559
- (48) Kraft, R.P., Sneden, C., Langer, G.E., & Prosser, C.F. 1992, AJ, 104, 645
- (49) Kurucz, R.L., Furenlid, I., Brault, J., & Testerman, L. 1984, Solar Flux Atlas from 296 to 1300 nm, National Solar Observatory, Sunspot, New Mexico
- (50) Laird, J.B., Carney, B.W., & Latham, D.W. 1988, AJ, 95, 1843
- (51) Lambert, D.L., Sneden, C., & Ries, L.M. 1974, ApJ, 188, 97
- (52) Lambert, D.L. 1993, Phys. Scr., T47, 186
- (53) Meléndez, J., Barbuy, B., & Spite, M. 2001, ApJ, 556, 858
- (54) Mishenina, T.V., Korotin, S.A., Klochkova, V.G., & Panchuk, V.E. 2000, A&A, 353, 978
- (55) Nakamura, T., Umeda, H., Iwamoto, K., et al. 2001, ApJ, 555, 880
- (56) Nissen, P.E., & Edvardsson, B. 1992, A&A, 261, 255
- (57) Nissen, P.E. 1994, Rev. Mex. Astron. Astrofis., 29, 129
- (58) Nissen, P.E., & Schuster, W.J. 1997, A&A, 326, 751
- (59) Ruscic, B., Wagner, A.F., Harding, L.B., et al. 2002, J. Phys. Chem. A, 106, 2727
- (60) Ryan, S.G., Norris, J.E., & Beers, T.C. 1999, ApJ, 523, 654
- (61) Savage, B.D., & Mathis, J.S. 1979, ARA&A, 17, 73
- (62) Seaton M.J., 1987, J.Phys. B: At. Mol. Phys., 20, 6363
- (63) Schuster, W.J., & Nissen P.E. 1988, A&AS, 73, 225
- (64) Schuster, W.J., & Nissen, P.E. 1989, A&A, 221, 65
- (65) Schuster, W.J., Moitinho, A., Parrao, L., & Covarrubias, E. 2002, in preparation
- (66) Sneden, C., Kraft, R.P., Prosser, C.F., & Langer, G.E. 1991, AJ, 102, 2001
- (67) Sneden, C., & Primas, F. 2001, New Astronomy Rev., 45, 513.
- (68) Spiesman, W.J., & Wallerstein, G. 1991, AJ, 102, 1790
- (69) Spite, M., & Spite, F. 1991, A&A, 252, 689
- (70) Takada-Hidai, M., Takeda, Y., Sato, S., et al. 2001, New Astronomy Rev., 45, 549
- (71) Thévenin, F., & Idiart, T. 1999, ApJ, 521, 753
- (72) Unsöld, A. 1955, Physik der Sternatmosphären (Springer Verlag, Berlin)
- (73) VandenBerg, D.A., Swenson, F.J., Rogers, et al. 2000, ApJ, 532, 430
- (74) VandenBerg, D., & Bell, R.A. 2001, New Astronomy Rev., 45, 577
- (75) Wiese, W.L., Fuhr, J.R., & Deters, T.M. 1996, J. Phys. Chem. Ref.Data, Monograph No. 7