Parameters of Warm Molecular Clouds from Methyl Acetylene Observations
The results of a survey of 63 galactic star-forming regions in the and methyl acetylene lines at 102 and 85 GHz, respectively, are presented. Fourty-three sources were detected at 102 GHz, and twenty-five at 85 GHz. Emission was detected towards molecular clouds with kinetic temperatures 20–60 K (so-called “warm clouds”). The CH3CCH abundances in these clouds appeared to be about several units 10-9. Five mapped sources were analyzed using the maximum entropy method. The sizes of the mapped clouds fall within the range between 0.1 and 1.7 pc, virial masses — between 90 — 6200 M⊙, and densities — between and cm-3. The CH3CCH sources spatially coincide with the CO and CS sources. Chemical evolution simulations showed that the typical methyl acetylene abundance in the observed clouds corresponds to an age of years.
1 INTRODUCTION
Massive stars are known to form in so-called ”warm” molecular clouds (Olmi et al. 1996; Kalenskii et al. 1997), which have temperatures 30 – 50 K, masses from hundreds to thousands , and sizes 0.1 – 3 pc. Therefore the exploration of such clouds is an important part of the exploration of star formation. Warm clouds have been fairly well studied in lines of CO, CS, NH3, CH3OH and many other molecules. However, the CO, CS, NH3, and CH3OH emissions are strongly affected by the contribution from compact regions of hot gas (hot cores), where the abundances of these and some other molecules are enhanced by several orders of magnitude owing to grain mantle evaporation.
To eliminate the contribution from hot cores, one should observe warm clouds in lines of molecules that weakly emit in such regions. One of these molecules is methyl acetylene. Its abundance is not enhanced in the Orion Hot Core (Wang et al. 1993), and, probably, it is not enhanced in other hot cores as well. Since hot cores, which have sizes of aproximately 0.05 pc, are much smaller than warm clouds, their contribution to the CH3CCH emission is probably negligible.
The rotational lines of methyl acetylene are grouped in series of lines with closely spaced frequencies. The lines from the same series can be observed simultaneously with the same receiver, making it possible to obtain accurate ratios of their intensities. Methyl acetylene observations allow determinations of the gas kinetic temperature. Radiative transitions between different -ladders are prohibited by the selection rule ; thus, the ratios of different -ladders’ populations are determined by collisions and depend mostly on the gas kinetic temperature. Since methyl acetylene has a fairly small dipole moment, 0.78 D (Bauer et al. 1979), it is collisionally thermalized even at density cm-3. In addition, methyl acetylene lines appeared to be optically thin in the warm clouds that have been already observed (Wang et al. 1993). These properties allow us to assume local thermodynamic equilibrium (LTE) and utilize simple methods of analysis, for instance, rotational diagrams, which produce fairly accurate temperature estimates in this case. Simulations by Askne et al. (1984) showed that the methyl acetylene rotational temperatures are approximately equal to the gas kinetic temperatures.
| Transition | Frequency | S | Eu/h |
|---|---|---|---|
| (GHz) | (K) | ||
| 102547.984 | 6.00 | 12.315 | |
| 102546.024 | 5.83 | 19.300 | |
| 102540.144 | 5.33 | 40.258 | |
| 102530.348 | 4.50 | 75.181 | |
| 102516.573 | 3.33 | 124.060 | |
| 102499.110 | 1.83 | 186.885 | |
| 85457.272 | 5.00 | 8.209 | |
| 85455.622 | 4.80 | 15.196 | |
| 85450.730 | 4.20 | 36.153 | |
| 85442.528 | 3.20 | 71.076 | |
| 85431.224 | 1.80 | 119.956 |
2 OBSERVATIONS


The observations were carried out in May 1997111Sensitive observations of four sources, W 3(OH), Orion KL, W 51E1/E2, and DR 21(OH) were conducted in 2000 with the 20-m millimeter-wave radio telescope of the Onsala Space Observatory, Sweden. The frequency, line strength, and upper level energy for each observed transition are given in Table 1. Pointing accuracy was checked using observations of SiO masers and was no worse than . The observations were performed in the dual beam switching mode with a beam separation of and a switch frequency of 2 Hz. The main-beam efficiency and full-width at half power were 0.55 and , respectively, at 102 GHz, and 0.6 and at 85 GHz. A cooled low-noise SiS mixer was used for the observations at both frequencies. The system noise temperature, corrected for atmospheric absorption, rearward spillower, and radome losses, varied between 350 and 2000 K, depending on the weather conditions and source elevation. The data were calibrated using the chopper-wheel method. The backend consisted of two parallel filter spectrometers: a 256-channel spectrometer with 250 kHz resolution and a 512-channel spectrometer with 1 MHz resolution. Sixty-three sources were observed at 102 GHz. Thirty-two of these were observed at 85 GHz. When fitting Gaussians to the lines, we assumed that different lines with the same have identical radial velocities and widths. The five sources NGC 2264, G30.8-0.1, G34.26+0.15, DR 21(OH), and S140 were mapped at 102 GHz. The mapping technique is described below.
Forty-five sources were detected at 102 GHz and twenty-five — at 85 GHz. The source coordinates and Gaussian parameters of the detected lines are presented in Table 2. The spectra of the detected sources are shown in Figs. 1, 2, and 3.
3 DATA ANALYSIS
The spectra in Figs. 1, 2, and 3 demonstrate that in most of the sources only the , , and lines with low excitation energies (Table 1) were detected, the and 1 lines being usually blended. Sometimes the line can be distinguished from the noise. Only in the four sources, observed in 2000 with a high sensitivity, very weak lines were detected.
Figure 4 show the methyl cyanide spectra of three sources, observed by Kalenskii et al. (2000) with the same equipment and with approximately the same sensitivity as the methyl acetylene lines. Methyl cyanide (CH3CN), like methyl acetylene, is a symmetric top molecule and its spectrum also consists of groups. The methyl acetylene and methyl cyanide spectra of NGC 7538S look alike (there are no lines with in both spectra) and the radial velocities are the same; therefore one can assume that the emission of both molecules arise in the same region. In W 3(OH) and G34.26+0.15, the contribution from hot cores to the methyl cyanide emission is significant (Kalenskii et al. 2000). In these objects, high energy lines are clearly detectable in the methyl cyanide spectra, but they are not noticeable in the methyl acetylene spectra. The high-energy CH3CN lines appear in the spectra of these sources due to the contribution from hot cores (Kalenskii et al. 2000), and the absence of detectable emission in analogous methyl acetylene lines suggests that the contribution from hot cores to the CH3CCH emission is insignificant. High-energy CH3CCH lines are either weak or not detected in all the observed sources. Since many of them harbor hot cores, it is reasonably to assume that the contribution from hot cores to the methyl acetylene emission is typically small.
We built rotational diagrams for 40 sources at 102 GHz and for 23 sources at 85 GHz (Fig. 6). The temperatures, derived from the rotational diagrams, fall in the range from 20 to 60 K, typical for warm clouds, and within errors agree with those derived from the observations of ammonia, methanol, and methyl cyanide (Kalenskii et al. 1997, 2000; Mauersberger et al. 1986; Churchwell et al. 1990; Molinari et al. 1996; Wouterloot et al. 1988; Wilson et al. 1990; Schreyer et al. 1996). Methyl acetylene column densities vary between cm-2 and cm-2, in most of the sources being included in a much narrower range, cm-2.
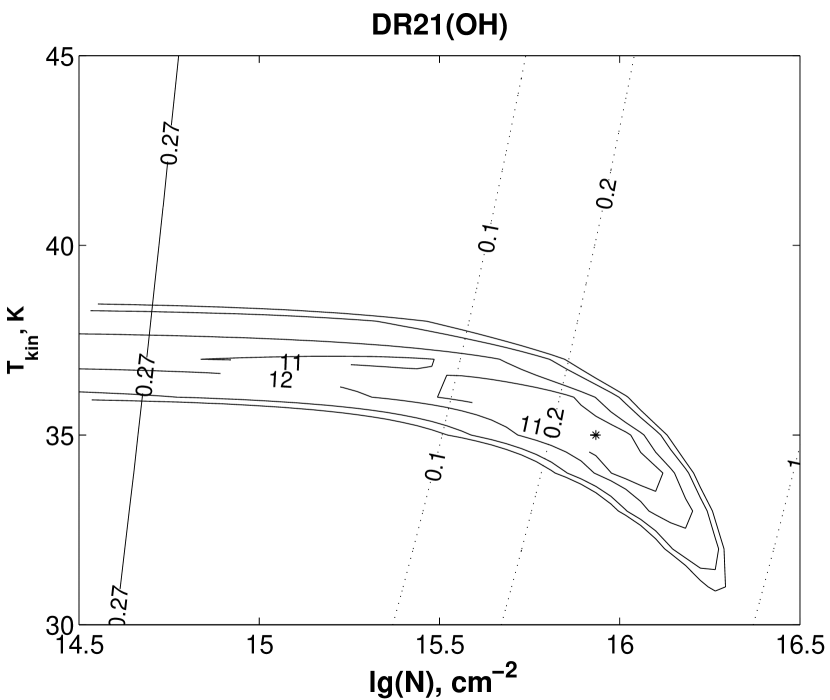
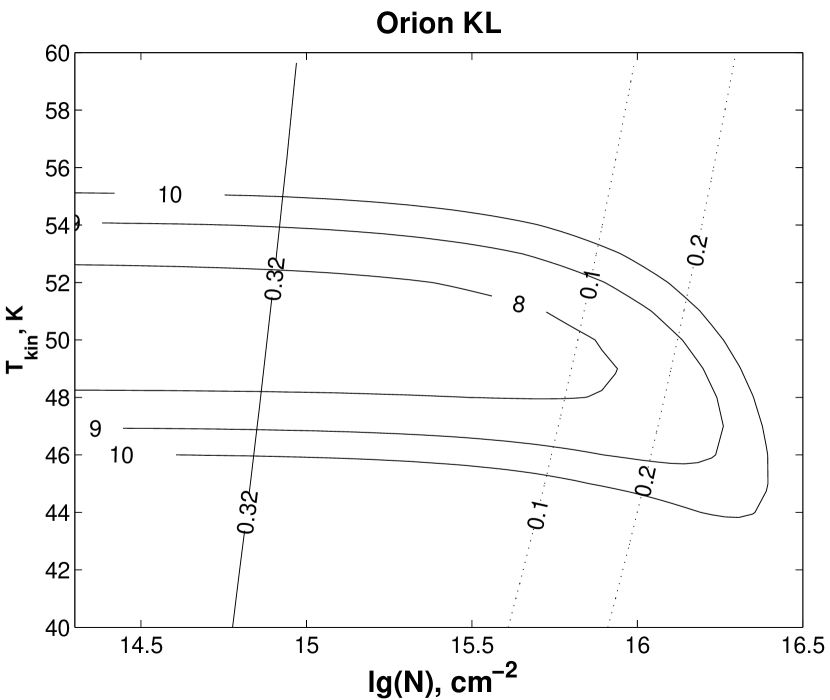
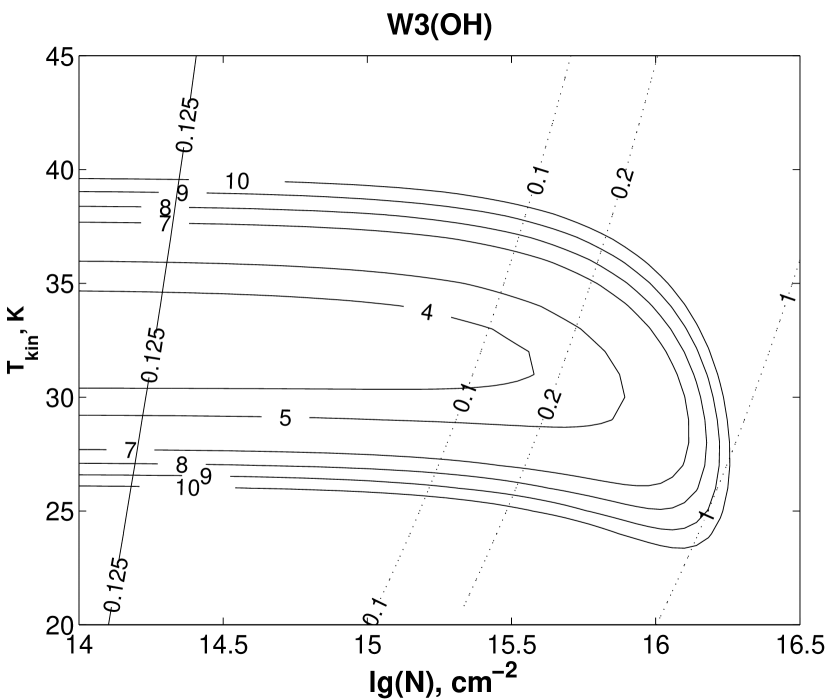
The observations of W 3(OH), DR 21(OH), Orion KL, and W 51E1/E2, which resulted in a detection of a sufficient number of lines (up to ), were analysed not assuming that the lines are optically thin. We calculated the ratios of line brightness temperatures for different sets of gas temperatures and CH3CCH column densities assuming that the CH3CCH level populations are thermalized. The temperature varied between 10 and 200 K, column density — between and cm-2, the sources were assumed to be uniform. Then we selected the models that agreed with the obsevations according to the criterion. The results are presented in Fig. 5, which shows that both optically thin models and models with the opacities of the and 1 lines about unity may match the observations. In the latter case, the intensities of the lines proved to be approximately an order of magnitude higher than the observed intensities; hence, the models with are possible only if the CH3CCH emission is significantly diluted. Note that the gas temperatures, derived from the models with is only slightly lower than those derived from the rotational diagrams. Below we consider that the methyl acetylene lines are optically thin.
In the last column of Table 3 we present the methyl acetylene abundances , which were determined employing 13CO data (Kalenskii et al. 2000). The observatons of the 1 – 0 13CO line at 110 GHz have also been performed at Onsala. The 13CO and H2 column densities were calculated assuming that the 1 – 0 13CO lines are optically thin, the gas temperatures are equal to the CH3CCH rotational temperatures, and the 13CO abundance is equal to (Lucas and Liszt 1998).
3.1 THE TECHNIQUE OF MAPPING
| Source | R.A.1950 | (Kkm s-1) | VLSR | FWHM | ||||
|---|---|---|---|---|---|---|---|---|
| DEC.1950 | K=0 | K=1 | K=2 | K=3 | K=4 | (km s-1) | (km s-1) | |
| 00338+6312 | 00 33 53.3 | 0.81(0.05) | 0.66(0.04) | 0.22(0.04) | 0.15(0.04) | 0.12 | -17.33(0.06) | 2.74(0.1) |
| 63 12 33.0 | not observed | |||||||
| 02232+6138 | 02 23 13.4 | 0.93(0.07) | 1.06(0.08) | 0.35(0.08) | 0.21 | 0.21 | -46.56(0.08) | 2.79(0.1) |
| 61 38 44.8 | not observed | |||||||
| W 3(OH) | 02 23 17.3 | 0.74(0.02) | 0.55(0.02) | 0.24(0.02) | 0.18(0.02) | 0.04(0.02) | -47.097(0.09) | 5.43(0.10) |
| 61 38 58.0 | 0.64(0.02) | 0.48(0.02) | 0.28(0.01) | 0.18(0.01) | -47.679(0.11) | 6.74(0.12) | ||
| 02575+6017 | 02 57 35.6 | 0.21(0.04) | 0.17(0.04) | 0.12) | 0.12 | 0.15 | -37.96(0.15) | 1.75(0.24) |
| 60 17 22.6 | not observed | |||||||
| L 1527 | 04 36 49.3 | 0.22(0.03) | 0.18(0.03) | 0.05 | 5.78(0.07) | 1.21(0.10) | ||
| 25 57 16.0 | 0.16(0.05) | 0.19(0.07) | 0.09 | 5.97(0.08) | 0.74(0.14) | |||
| G174.20 | 05 27 32.2 | 0.16(0.04) | 0.13(0.05) | 0.12 | -2.39(0.35) | 3.01(0.58) | ||
| 33 45 52.0 | not observed | |||||||
| Orion S6 | 05 32 44.8 | 1.42(0.10) | 0.95(0.09) | 0.60(0.09) | 0.25 | 6.68(0.10) | 3.22(0.13) | |
| -5 26 00.0 | 0.66(0.09) | 0.40(0.08) | 0.44(0.08) | 0.24 | 6.48(0.11) | 2.26(0.16) | ||
| Orion KL | 05 32 47.0 | 1.93(0.04) | 1.46(0.04) | 0.99(0.04) | 0.79(0.04) | 0.13 | 9.13(0.06) | 5.61(0.07) |
| -5 24 20.0 | 2.06(0.10) | 1.41(0.10) | 1.08(0.06) | 0.70(0.06) | 9.43(0.16) | 7.53(0.18) | ||
| OMC 2 | 05 32 59.9 | 0.53(0.07) | 0.39(0.06) | 0.18 | 11.46(0.08) | 1.47(0.11) | ||
| -5 11 29.0 | 0.34(0.05) | 0.30(0.05) | 0.12 | 11.17(0.07) | 1.31(0.11) | |||
| S 231 | 05 35 51.3 | 0.45(0.05) | 0.45(0.05) | 0.20(0.05) | 0.15 | -16.46(0.10) | 2.43(0.15) | |
| 35 44 16.0 | 0.45(0.05) | 0.18(0.05) | 0.16(0.05) | 0.15 | -16.56(0.21) | 3.38(0.22) | ||
| S 235 | 05 37 31.8 | 0.21(0.03) | 0.11(0.03) | 0.13(0.03) | 0.09 | -16.90(0.13) | 2.08(0.16) | |
| 35 40 18.0 | 0.14(0.03) | 0.14(0.03) | 0.9 | |||||
| S 252A | 06 05 36.5 | 0.52(0.14) | 0.47(0.14) | 0.18 | 8.77(0.33) | 2.78(0.30) | ||
| 20 39 34.0 | not observed | |||||||
| S 252 | 06 05 53.7 | 0.31(0.05) | 0.25(0.05) | 0.10(0.04) | 0.12 | 0.12 | 2.74(0.13) | 2.11(0.23) |
| 21 39 09.0 | 0.29(0.04) | 0.27(0.04) | 0.12 | 2.94(0.15) | 2.78(0.21) | |||
| 06056+2131 | 06 05 41.0 | 0.40(0.06) | 0.45(0.07) | 0.18(0.06) | 0.15 | 0.15 | 2.61(0.12) | 2.21(0.21) |
| 21 31 32.2 | not observed | |||||||
| NGC 2264 | 06 38 24.9 | 0.75(0.05) | 0.63(0.05) | 0.18(0.04) | 0.12 | 8.06(0.05) | 2.10(0.08) | |
| 09 32 28.0 | 0.57(0.05) | 0.68(0.05) | 0.19(0.05) | 0.15 | 7.97(0.08) | 2.47(0.11) | ||
| L 483 | 18 14 50.6 | 0.22(0.07) | 0.25(0.06) | 0.10 | 0.10 | 0.10 | 5.11(0.14) | 0.96(0.12) |
| -04 40 49.0 | not observed | |||||||
| G29.95-0.02 | 18 43 27.1 | 0.71(0.08) | 0.47(0.08) | 0.31(0.08) | 0.21 | 0.15 | 97.35(0.21) | 3.78(0.21) |
| -02 42 36.0 | 0.44(0.08) | 0.44(0.08) | 0.30(0.07) | 0.21 | ||||
| G30.70-0.06 | 18 44 58.9 | 1.15(0.09) | 0.95(0.09) | 0.44(0.08) | 0.33(0.08) | 0.24 | 91.27(0.19) | 4.53(0.19) |
| -02 04 27.0 | not observed | |||||||
| G30.8-0.1 | 18 45 11.0 | 1.43(0.08) | 1.36(0.08) | 0.58(0.08) | 0.52(0.07) | 0.6 | 98.00(0.00) | 5.35(0.20) |
| -01 57 57.0 | 1.49(0.15) | 1.42(0.15) | 0.85(0.14) | 0.51(0.13) | 0.09 | 97.83(0.31) | 6.01(0.37) | |
| G34.26+0.15 | 18 50 46.1 | 2.32(0.12) | 2.42(0.12) | 1.27(0.10) | 0.49(0.10) | 0.3 | 57.64(0.15) | 6.02(0.17) |
| 01 11 12.0 | 2.26(0.12) | 2.16(0.12) | 1.03(0.11) | 0.54(0.11) | 0.3 | 57.91(0.13) | 4.75(0.15) | |
| G35.19-0.74 | 18 55 40.8 | 1.52(0.07) | 1.30(0.07) | 0.62(0.03) | 0.34(0.04) | 0.18 | 33.61(0.01) | 3.37(0.08) |
| 01 36 30.0 | 0.98(0.09) | 0.88(0.09) | 0.43(0.08) | 0.24 | 33.63(0.01) | 4.16(0.19) | ||
| W 49N | 19 07 49.9 | 0.79(0.88) | 2.41(0.84) | 0.73(0.14) | 0.94(0.15) | 0.42 | 7.14(1.69) | 13.49(0.77) |
| 09 01 14.0 | not observed | |||||||
| G43.80-0.13 | 19 09 30.8 | 0.57(0.06) | 0.44(0.05) | 0.28(0.05) | 0.12 | 0.12 | 44.41(0.28) | 5.04(0.28) |
| 09 30 47.0 | not observed | |||||||
| W 51E1/E2 | 19 21 26.2 | 2.70(0.19) | 2.56(0.18) | 1.49(0.07) | 1.18(0.08) | 0.23(0.07) | 57.79(0.22) | 9.93(0.16) |
| 14 24 43.0 | 2.89(0.36) | 2.16(0.34) | 1.26(0.10) | 0.97(0.10) | 59.85(0.43) | 10.73(0.26) | ||
| W 51 MET1 | 19 21 26.2 | 1.17(0.13) | 0.97(0.13) | 0.36 | 0.27 | .27 | 55.03(0.22) | 3.92(0.24) |
| 14 23 32.0 | 1.31(0.15) | 0.93(0.14) | 0.39 | |||||
| W 51 MET2 | 19 21 28.8 | 1.52(0.14) | 1.54(0.15) | 0.98(0.15) | 0.39 | 0.39 | 54.64(0.19) | 4.36(0.27) |
| 14 23 47.0 | 1.24(0.35) | 1.15(0.30) | 0.62(0.16) | 0.64(0.10) | 0.21 | 55.53(0.87) | 9.10(0.80) | |
| W 51 MET3 | 19 21 27.5 | 1.30(0.15) | 1.50(0.15) | 0.45(0.15) | 0.45 | 53.84(0.21) | 3.50(0.00) | |
| 14 23 52.0 | 2.42(1.41) | 1.41(1.49) | 0.85(0.20) | 0.48 | 55.91(2.89) | 7.88(1.15) | ||
| Source | R.A.1950 | (Kkm s-1) | VLSR | FWHM | ||||
|---|---|---|---|---|---|---|---|---|
| DEC.1950 | K=0 | K=1 | K=2 | K=3 | K=4 | (km s-1) | (km s-1) | |
| W 51 MET4 | 19 21 25.6 | 1.06(0.05) | 0.81(0.05) | 0.25(0.05) | 0.30(0.05) | 0.15 | 61.77(0.12) | 4.33(0.15) |
| 14 25 41.0 | not observed | |||||||
| W 51 MET5 | 19 21 20.5 | 2.25(0.05) | 1.13(0.05) | 0.75(0.05) | 0.39(0.05) | 0.15 | 67.08(0.73) | 9.34(0.73) |
| 14 24 12.0 | not observed | |||||||
| 19410+2336 | 19 41 04.2 | 0.34(0.07) | 0.34(0.05) | 0.18(0.06) | 0.18 | 0.18 | 22.55(0.13) | 1.98(0.18) |
| 23 36 42.0 | not observed | |||||||
| Onsala 1 | 20 08 09.9 | 1.24(0.11) | 1.18(0.10) | 0.58(0.10) | 0.39(0.10) | 0.27 | 11.17(0.12) | 3.42(0.13) |
| 31 22 42.0 | 1.24(0.07) | 0.98(0.07) | 0.53(0.07) | 0.31(0.07) | 0.21 | 11.05(0.09) | 3.60(0.11) | |
| 20126+4104 | 20 12 40.96 | 0.55(0.03) | 0.41(0.02) | 0.15(0.02) | 0.11(0.02) | 0.06 | -3.64(0.04) | 2.46(0.07) |
| 41 04 20.6 | not observed | |||||||
| 20188+3928 | 20 18 50.6 | 1.02(0.09) | 0.87(0.08) | 0.43(0.08) | 0.35(0.08) | 0.24 | 1.46(0.07) | 2.11(0.12) |
| 39 28 18.6 | not observed | |||||||
| 20286+4105 | 20 28 40.6 | 0.45(0.05) | 0.45(0.05) | 0.15 | 0.15 | 0.15 | -4.04(0.17) | 3.36(0.20) |
| 41 05 38.1 | not observed | |||||||
| W 75N | 20 36 50.4 | 0.96(0.08) | 1.05(0.08) | 0.44(0.08) | 0.24 | 9.03(0.13) | 3.71(0.14) | |
| 42 27 23.0 | 0.68(0.05) | 0.60(0.05) | 0.16(0.05) | 0.12 | 9.34(0.13) | 3.67(0.13) | ||
| DR 21 West | 20 37 07.6 | 0.50(0.04) | 0.45(0.04) | 0.16(0.03) | 0.12 | -2.39(0.06) | 2.04(0.09) | |
| 42 08 46.0 | 0.32(0.05) | 0.21(0.05) | 0.14(0.04) | 0.12 | -2.16(0.23) | 3.21(0.33) | ||
| DR 21(OH) | 20 37 13.8 | 1.72(0.02) | 1.45(0.02) | 0.72(0.01) | 0.43(0.01) | 0.06(0.01) | -3.00(0.03) | 5.87(0.03) |
| 42 12 13.0 | 1.59(0.03) | 1.30(0.03) | 0.60(0.02) | 0.32(0.02) | 0.22 | -4.11(0.08) | 6.46(0.08) | |
| S 140 | 22 17 41.2 | 1.09(0.05) | 1.07(0.05) | 0.44(0.05) | 0.16(0.05) | 0.15 | -6.62(0.04) | 2.46(0.06) |
| 63 03 43.0 | 1.00(0.06) | 0.69(0.06) | 0.29(0.05) | 0.17(0.05) | 0.15 | -6.74(0.07) | 2.88(0.11) | |
| Cep A | 22 54 19.2 | 1.56(0.10) | 1.26(0.10) | 0.80(0.10) | 0.34(0.09) | 0.27 | -10.70(0.09) | 3.35(0.11) |
| 61 45 47.0 | 0.89(0.07) | 0.88(0.07) | 0.43(0.07) | 0.21 | -10.58(0.10) | 3.19(0.11) | ||
| 23032+5937 | 23 03 16.9 | 0.23(0.07) | 0.29(0.07) | 0.18 | 0.18 | 0.18 | -51.91(0.34) | 2.99(0.43) |
| 59 37 38.9 | not observed | |||||||
| 23033+5951 | 23 03 19.7 | 0.48(0.06) | 0.49(0.06) | 0.20 | 0.20 | 0.20 | -52.94(0.13) | 2.83(0.19) |
| 59 51 55.0 | not observed | |||||||
| NGC 7538 | 23 11 36.6 | 0.55(0.03) | 0.46(0.03) | 0.21(0.03) | 0.11(0.03) | 0.09 | -57.19(0.08) | 3.36(0.10) |
| 61 11 50.0 | 0.34(0.05) | 0.24(0.05) | 0.12(0.04) | 0.15 | -57.53(0.18) | 2.89(0.22) | ||
| NGC 7538S | 23 11 36.1 | 1.73(0.07) | 1.27(0.06) | 0.60(0.06) | 0.40(0.06) | 0.18 | -55.99(0.10) | 4.09(0.09) |
| 61 10 30.0 | 1.15(0.07) | 0.67(0.07) | 0.25(0.07) | 0..32(0.07) | 0.20 | -55.76(0.13) | 3.50(0.00) | |
| 23133+6050 | 23 13 21.5 | 0.24(0.07) | 0.12(0.05) | 0.15 | 0.15 | 0.15 | -56.30(0.19) | 1.90(0.39) |
| 60 50 45.6 | ||||||||


| 102 GHz | 85 GHz | ||||
| Source | CH3CCH abundance | ||||
| (K) | (K) | ||||
| 00338+6312 | 29 (1) | 1.9 (0.2) | |||
| 02232+6138 | 29 (3) | 2.6 (0.5) | |||
| W 3(OH) | 35 (0.7) | 2.0 (0.1) | 42.5 (2) | 2.6 (0.2) | 2.3 |
| 02575+6017 | 67 (41) | 1.2 (1.2) | |||
| L 1527 | 20 (3) | 0.4 (0.1) | |||
| ORI S6 | 41 (6) | 4.4 (1.0) | 65 (22) | (2.3) | 5.2 |
| Orion KL | 51 (1) | 8.0 (0.3) | 52 (4) | 10.5 (1.3) | |
| OMC 2 | 30 (6) | 1.3 (0.4) | 34 (15) | (0.8) | 4.1 |
| S 231 | 38 (8) | 1.5 (0.5) | 29 (11) | 1.1 (0.7) | 4.8 |
| S 235 | 61 (11) | (0.3) | 1.1 | ||
| S 252A | 28 (10) | (0.9) | |||
| S 252 | 27 (6) | 0.7 (0.3) | 42 (22) | (1.0) | 2.1 |
| 06056+2131 | 36 (10) | 1.4 (0.6) | |||
| NGC 2264 | 20 (1) | 1.5 (0.2) | 46 (20) | 3.1 (2.0) | 3.9 |
| L483 | 36 (20) | 0.8 (0.7) | |||
| G29.95-0.02 | 43 (10) | 2.3 (0.9) | 67 (25) | 3.5 (2.1) | 2.0 |
| G30.70-0.06 | 37 (2) | 3.5 (0.4) | |||
| G30.8-0.1 | 42 (2) | 5.1 (0.5) | 50 (10) | 8.2 (2.6) | 5.7 |
| G34.26+0.15 | 31 (1) | 7.2 (0.5) | 40 (4) | 9.3 (1.7) | 16 |
| G35.19-0.74 | 32 (1) | 4.3 (0.3) | 44 (14) | 4.4 (2.3) | 8.5 |
| G43.80-0.13 | 50 (13) | 2.3 (1.0) | |||
| W 51E1/E2 | 49 (3.5) | 12 (1.5) | 48 (5.5) | 13.3 (2.7) | 3.6 |
| W 51 MET1 | 26 (4) | (1.6) | 26 (9) | (1.7) | |
| W 51 MET2 | 34 (2) | (2.2) | 69 (19) | 9.4 (4.6) | |
| W 51 MET3 | 26 (4) | 3.5 (1.0) | 34 (25) | 7.4 (9.8) | 2.5 |
| W 51 MET4 | 37 (1) | 2.8 (0.2) | |||
| W 51 MET5 | 32 (0.5) | 4.9 (0.2) | |||
| 19410+2336 | 40 (25) | 1.5 (1.3) | |||
| Onsala 1 | 39 (3) | 4.2 (0.6) | 39 (5) | 4.7 (0.9) | 6.1 |
| 20126+4104 | 31 (1) | 1.3 (0.1) | |||
| 20188+3928 | 42 (3) | (0.5) | |||
| 20286+4105 | 26 (3.7) | (0.3) | |||
| W 75N | 38 (6) | 3.4 (0.9) | 29 (8) | 1.9 (0.9) | 24 |
| DR 21 West | 26 (3) | 1.2 (0.2) | 41 (19) | 1.2 (0.9) | 2.6 |
| DR 21 (OH) | 39 (0.2) | 5.4 (0.1) | 34 (1) | 5.2 (0.3) | 4.5 |
| S 140 | 26 (1) | 2.8 (0.2) | 29 (3) | 2.6 (0.5) | 4.5 |
| Cep A | 33 (1) | 4.6 (0.4) | 53 (18) | 5.2 (2.8) | 5.7 |
| 23033+5951 | 34 (7) | (0.5) | |||
| NGC 7538 | 31 (1) | 1.5 (0.1) | 32 (13) | 1.0 (0.7) | 1.9 |
| NGC 7538S | 34 (1) | 4.6 (0.3) | 37 (5) | 3.8 (0.8) | 5.2 |
We mapped five methyl acetylene sources at 102 GHz: NGC 2264, G30.8-0.1, G34.26+0.15, DR 21(OH), and S 140. In each of them we observed 50 – 100 positions with 10 and 20 arcsec spacings in right ascention and declination. For each source we tried to expand the observed area until at the edges the emission vanishes, but due to the lack of time we could not observe sufficiently large areas towards G30.8 – 0.1 and DR 21(OH). Therefore both the maps of these sources and the source parameters, derived using the maps, are unreliable.
Since the beam was fairly large (about ), and the signal-to-noise ratio was often fairly low, the obtained images were heavily smoothed by the beam and distorted by the noise. Therefore we reconstructed the images with the method of maximum entropy.
The reconstruction of an image, distorted by the noise and smoothed by the beam is an incorrect problem, since high spatial frequencies are lost due to the limited spatial resolution, and there are no ways to restore them (in other words, an infinite number of ”initial” images match the observed smooth image). The method of maximum entropy select from the multitude of acceptable images the one that has the maximal Shennon entropy
| (1) |
where is the intensity of an element of the image. We used the variant of the method, described by Wilchek and Drapatz (1985), except the computational algorithm to solve the optimization problem. The evolutionary algorithm, employed here, is described by Promislov (1999). The latter algorithm is more expensive computationally than that from Wilchek and Drapatz (1985), but in the case of a poor signal-to-noise ratio or insufficient grid spacing this algorithm may converge even if the algorithm from Wilchek and Drapatz (1985) fails. Nevertheless, among the observed lines only the blends of the and lines have sufficiently high signal-to-noise ratios to make the mapping possible. We made the maps of the intensity integrated over all the channels, occupied by the blends.

The images are shown in Fig. 7.
The resolution of the maps was estimated as follows: at each point of a map, we subtracted the contribution from the source, convolved with the beam, leaving only noise. Then we added the contribution from a point source with flux equal to the observed flux, located at the peak of the reconstructed image, and convolved with the beam. Finally, we applied the image reconstruction procedure to this map. The size of the obtained image was adopted as the map resolution. The resolution of all maps proved to be about 15 – 25 arcsec, being significantly less then the sizes of the sources. Therefore the angular diameters, presented in Table 4, represent the real sizes of the sources.
3.2 COMMENTS ON INDIVIDUAL SOURCES
NGC 2264. The peak of CH3CCH emission coincide with the IR source IRS1 (Sargent et al. 1984) and the continuum sources at 130 and 70 m (Schreyer et al. 1997). The CH3CCH source is slightly extended to the southwest from the peak, and approximately coincides with the CS, C18O, CO, and CH3OH sources (Schreyer et al. 1997), but in our map there is no second peak approximately southwest from IRS1, which is present in the C18O, CS, and CH3OH maps.
G34.26+0.15. The CH3CCH source is essentially circular with a diameter of . The peak of the emission coincides with an UC HII region (Benson and Johnston 1984) and the SO peak (Carral et al. 1987), but it is shifted approximately south-west from the HCO+ peak.
DR 21(OH). The methyl acetylene peak coincides with the continuum sources MM1 and MM2 (Padin et al. 1989) and the peaks of H2CO, C18O, and CS emission (Johnston et al. 1989; Mangum et al. 1991). The methyl acetylene source is extended in the north–south direction by more than 2 arcmin, like the C18O source (Padin et al. 1989). Hovever, due to the lack of time we could not map the whole source, and the emission does not vanish at the northern edge of our map.
S 140. The source is slightly extended in the northeast–southwest direction; the peak of the emission coincides with the IR source IRS1 (Evans et al. 1989). Our map coincides fairly good with the 12CO maps (Snell et al. 1984; Minchin et al. 1993). At the same time, the peak of CH3CCH emission is located 10–15 arcsec to the east from the 13CO, C18O, and HCO+ peaks (Minchin et al. 1995; Wilner and Welch 1994).
3.3 SOURCE PARAMETERS DERIVED FROM THE MAPS
| Source | d | D | Mvir | MCO | n | CH3CCH | |
|---|---|---|---|---|---|---|---|
| (kpc) | (”) | (cm) | (M⊙) | (M⊙) | cm-3 | abundance | |
| NGC 2264 | 0.7 | 57 | 6.01017 | 89 | 40 | 4.8 | 1.6 |
| G30.8-0.11 | 6.3 | 53 | 5.01018 | 6208 | 4919 | 5.6 | 4.7 |
| G34.26+0.15 | 3.8 | 42 | 2.41018 | 2332 | 528 | 1.9 | 3.6 |
| DR 21 (OH)1 | 3.0 | 56 | 2.51018 | 1336 | 1941 | 9.6 | 7.7 |
| S 140 | 0.9 | 49 | 3.61017 | 135 | 67 | 5.5 | 2.1 |
1–Unreliable parameters (see sect. ”The mapping technique”).
We derived the virial masses of the mapped sources assuming that each source is a uniform optically thin nonmagnetized sphere of a constant density. According to Cesaroni et al. (1994), under these assumptions the virial mass can be calculated from the formula
| (2) |
where is the source angular diameter in arcsec, is the full-width at half maximum (FWHM) in km s-1, is the source distance in kpc, is the cloud virial mass in . The angular diameter of each source was estimated as follows: first, we calculated the map area (in arcsec2) within the contour that corresponds to the half-maximum intensity. This area was multiplied by to obtain the source area in the sky . The angular diameter was calculated using the formula , and additionally multiplied by 1.155 to obtain the sphere diameter from the vizual diameter (Panagia and Walmsley 1978). The source distance was derived employing the Galactic rotation curve from Brand and Blitz (1993).
The masses, determined with Eq. (2), are presented in Table 4. In addition, we estimated the masses of the same sources using the 13CO column densities, assuming that the 13CO and CH3CCH sources are spatially coincident and the 1–0 13CO lines are optically thin. The latter masses are also presented in Table 4. For all sources, except G34.26+0.15, the virial masses coincide with the masses derived from 13CO column densities within a factor of two. The comparison of the intensities of the 13CO and C18O lines in G34.26+0.15, presented in Little et al. (1994), leads to the conclusion that the 13CO lines are not optically thin. Hence, the derived 13CO column density and mass of this source are underestimated.
Since two different methods yield similar mass estimates of four sources, we believe that these estimates are correct.
Assuming that the masses of the sources are equal to their virial masses and using the source sizes and methyl acetylene column densities from Tables 3 and 4, we estimated the gas densities and methyl acetylene abundances. The estimates are presented in Table 4. The densities appeared to be close to cm-1, and methyl acetylene abundances — of the order of several units x . So determined methyl acetylene abundances within a factor of two coincide with those presented in Table 3 in all sources except G34.26+0.15. We have already mentioned that the 13CO column density in this source is probably underestimated. In this case the methyl acetylene abundance, presented in Table 3, is overestimated, and the value of , presented in Table 4, is more correct.
Our methyl acetylene abundances are in agreement with the abundances estimated for warm gas in Orion (Blake et al. 1987; Kuiper et al. 1984), Sgr B2 (Churchwell & Hollis 1983; Kuiper et al. 1984), S 140 (Kuiper et al. 1984), and with the abundance, which can be estimated for the cold cloud TMC-1 from the observations of C18O and methyl acetylene (Pratap et al. 1997).
3.4 SIMULATIONS OF CHEMICAL EVOLUTION
| Element | C/O=0.41 | C/O=0.8 |
|---|---|---|
| He | 1.4000 | 1.4000 |
| N | 2.1400 | 2.1400 |
| O | 1.7600 | 1.7600 |
| C+ | 7.3000 | 1.4080 |
| S+ | 8.0000 | 8.0000 |
| Si+ | 8.0000 | 8.0000 |
| Fe+ | 3.0000 | 3.0000 |
| Na+ | 2.0000 | 2.0000 |
| Mg+ | 7.0000 | 7.0000 |
| e | 7.3107 | 7.3107 |
| P+ | 3.0000 | 3.0000 |
| Cl+ | 4.0000 | 4.0000 |
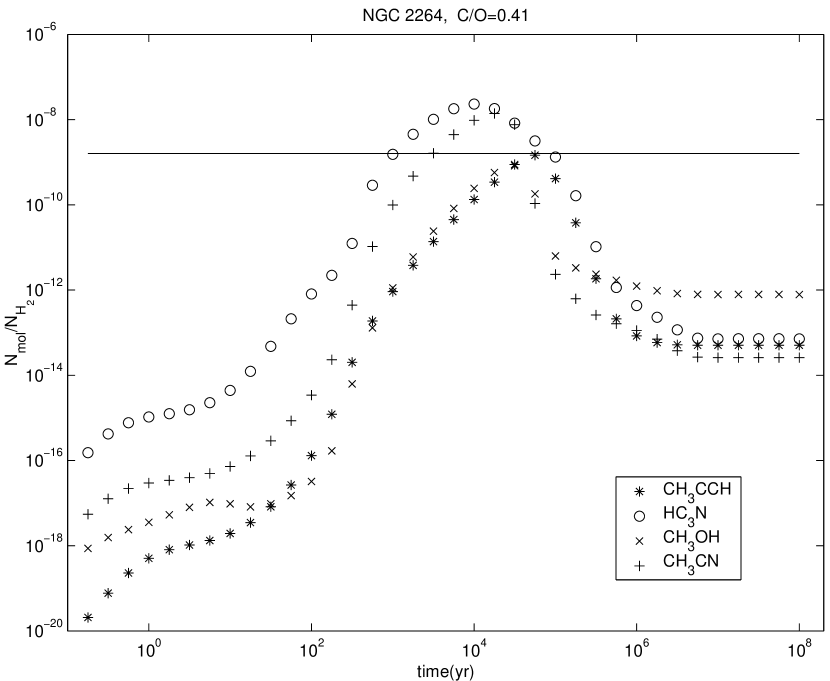
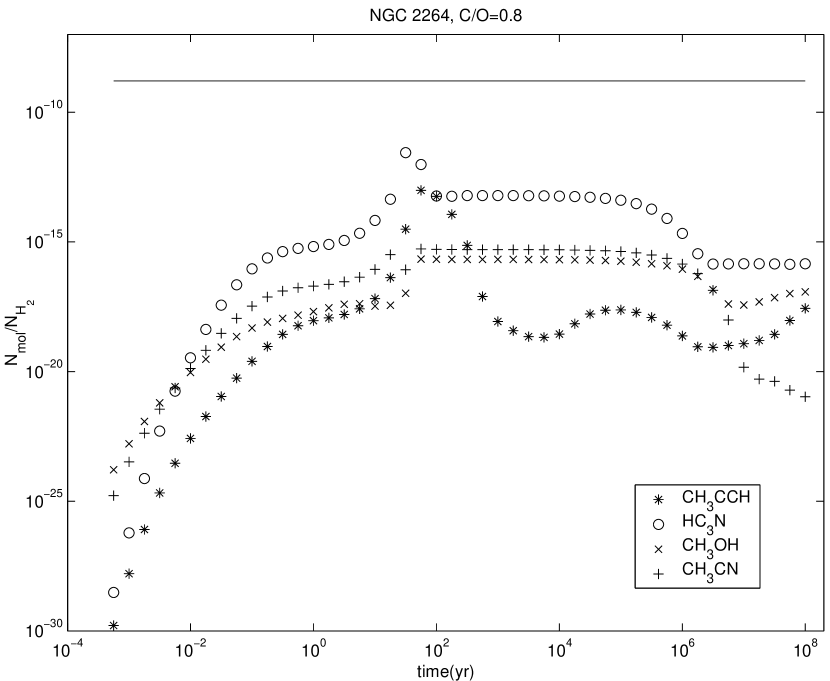
Using the derived gas temperatures and densities we modelled the chemical evolution of the mapped objects. The chemical reaction network corresponded to the so-called ”new standard model” Lee et al. (1996)). The code for the simulations was kindly presented by R. Terzieva from Prof. Herbst’s group in the Ohio University. The model took into consideration only gas-phase chemistry without any account for dust grains. The initial set of chemical elements corresponded to the low metal abundance (Lee et al. 1996) and is presented in Table 5. The simulations were performed for two C/O ratios, 0.41 and 0.8. The results for NGC 2264 are shown in Fig. 8; the results for other sources are similar. For the CH3CCH abundance reaches its maximum at years since the beginning of the evolution; later the abundance decreases by several orders of magnitude and reaches steady-state at years. When C/O increases to 0.8, both and the maximum CH3CCH abundance decreases. The comparison of the observed CH3CCH abundance (Table 3) with the results of our simulations shows that it is the abundance that arises around the peak at years is characteristic for molecular clouds. The same time dependences are typical for many other molecules (Lee et al. 1996). These results implies a large amount of ”chemically young” gas in giant molecular clouds.
Kuiper et al. (1996) in their study of dark clouds considered the model of chemically different shells. In this model, the source consists of a chemically more evolved core, surrounded by a less evolved shell with high abundances of CH3CCH and other molecules. Such differentiation can be caused by the accretion of rarefied gas. Chemical processes in rarefied gas proceed much more slowly than in the core; in addidion, ultraviolet radiation quickly destroys the formed molecules. Due to a stable influx of ”chemically young” substance the shell chemical composition is characterized by high abundances of CH3CCH and other molecules. However, in neither of the mapped sources could we find any sign of a shell structure. Apparently, this model is not applicable to warm clouds. Note, however, that in all sources, except NGC 2264, we could merely not detect the shell structure because of insufficient spatial resolution.
Another possible explanation of such ”chemical” age lie in the fact that during a time of years luminous stars may form in the cloud cores. Radiation of these stars leads to the dissipation of the cores. One more explanation is the fact that some processes (e.g., eddy diffusion) may increase the C and C+ abundances in the clouds at late stages of their evolution, which in turn increases abundances of different molecules. The review of these and some other possibilities is presented by Bergin et al. (1997).
4 CONCLUSIONS
As a result of a survey of Galactic star-forming regions in the methyl acetylene lines at 102 GHz and at 85 GHz, we have detected 44 sources at 102 GHz and 25 sources at 85 GHz.
Using rotational diagrams, we estimated the gas kinetic temperatures and methyl acetylene abundances. The kinetic temperatures appeared to be of the order of 20 – 60 K and coincide within errors with the temperatures that had been estimated from the observations of methanol, methyl acetylene, and ammonia. In most sources methyl acetylene column densities lie in the range cm-3. The emission of hot cores, compact massive regions with gas temperatures above 100 K, was not found.
Using the maximum entropy images of five sources, we estimated their sizes, masses, and densities. The sizes proved to be about 0.1 — 1 pc, the masses — hundreds and thousands , and the densities — about cm-3.
Thus, in the lines of methyl acetylene we observed warm and dense clouds.
Simulations of chemical evolution show that the characteristic methyl acetylene abundances in these clouds corresponds to the gas chemical age years.
ACKNOWLEDGMENTS
The authors are grateful to the Onsala Observatory staff for help during the observations, R. Terzieva, who made available the code for the simulations of the chemical evolution of molecular clouds, and Dr. V.I. Slysh for helpful discussion. The work was partially supported by the Russian Foundation for Basic Research (grants no. 98-02-16916 and 01-02-16902), project no. 315 ”Radio Astronomy Educational and Scientific Center, and the INTAS grant no. 97-11451. The Onsala Space Observatory is the Swedish National Facility for Radio Astronomy, and is operated by the Chalmers University of Technology, Göteborg, Sweden, with financial support from the Swedish Natural Science Research Council and the Swedish Board for Technical Development.
References
- Olmi et al. (1996) Olmi, L., Cesaroni, R., Neri, R., Walmsley, C. M. 1996, A&A, 315, 565
- Kalenskii et al. (1997) Kalenskii, S. V., Dzura, A. M., Booth, R. S., Winnberg, A., Alakoz, A. V. 1997, A&A, 321, 311
- Wang et al. (1993) Wang, T. Y., Wouterloot, J. G. A., Wilson, T. L. 1993, A&A, 277, 205
- Bauer et al. (1979) Bauer, A., Boucher, D., Burie, J., Demaison, J., Dubrulle, A. 1979, JPCRD, 8, 537
- Askne et al. (1984) Askne, J., Höglund, B., Hjalmarson, Å., Irvine, W. M. 1984, A&A, 130, 311
- Kalenskii et al. (2000) Kalenskii, S. V., Promislov, V. G., Alakoz, A. V., Winnberg, A., Johansson, L. E. B. 2000, AZh, 77, 819
- Mauersberger et al. (1986) Mauersberger, R., Henkel, C., Wilson, T. L., Walmsley, C. M. 1986, A&A, 162, 199
- Churchwell et al. (1990) Churchwell, E., Walmsley, C. M., Cesaroni, R. 1990, A&AS, 83, 119
- Molinari et al. (1996) Molinari, S., Brand, J., Cesaroni, R., Palla, F. 1996, A&A, 308, 573
- Wouterloot et al. (1988) Wouterloot, J. G. A., Walmsley, C. M., Henkel, C. 1988, A&A, 203, 367
- Schreyer et al. (1996) Schreyer, K., Henning, T., Kom̈pe, C., Harjunpaä, P. 1996, A&A, 306, 267
- Wilson et al. (1990) Wilson, T. L., Mauersberger, R. 1990, A&A, 239, 305
- Lucas and Liszt (1998) Lucas, R. L., Liszt, H. 1998, A&A, 337, 246
- Wilchek and Drapatz (1985) Wilczek, R., Drapatz, S. 1985, A&A, 142, 9
- Promislov (1999) Promislov, V. G., Maximum entropy image restoration by evolutionary algorithm, 1999, Advances in Soft Computing — Engineering Design and Manufacturing, Springer – Verlag, London
- Sargent et al. (1984) Sargent, A. I., Van Duinen, R. J., Nordh, H. L., Fridlund, C. V. M., Aalders, J. W. G., and Beintema D. 1984, A&A, 135, 377
- Schreyer et al. (1997) Schreyer, K., Helmich, F. P., van Dishoeck, E. F., Henning, Th. 1997, A&A, 326, 347
- Benson and Johnston (1984) Benson, J. M., Johnston, K. J. 1984, ApJ, 277, 181
- Carral et al. (1987) Carral, P., Welch, W. J., Wright, M. C. H. 1987, RMxAA, 14, 506
- Padin et al. (1989) Padin, S., Sargent, A. I., Mundy L.G., Scoville, N. Z., Woody, D. P., Leighton, R. B., Masson, C. R., Scott, S. L., Seling, T. V., Stapelfeldt, K. R., Terebey, S. 1989, ApJ, 337, L45
- Johnston et al. (1989) Johnston, K. J., Henkel, C., Wilson, T. L. 1989, ApJ, 285, L85
- Mangum et al. (1991) Mangum, J. G., Wootten, A., Mundy, L.G. 1991, ApJ, 378, 576
- Evans et al. (1989) Evans, N.J., Mundy, L.G., Kutner, M.L., DePoy, D.L. 1989, ApJ, 346, 212
- Snell et al. (1984) Snell, R. L., Scoville, N. Z., Sanders, D. B., Erickson, N. R. 1984, A&A, 315, 565
- Minchin et al. (1993) Minchin, N. R., White, G. J., Padman, R. 1993, A&A, 277, 595
- Minchin et al. (1995) Minchin, N. R., White, G. J., Ward-Thompson, D. 1995, A&A, 301, 894
- Wilner and Welch (1994) Wilner, D. J., Welch, W. J. 1994, ApJ, 427, 898
- Cesaroni et al. (1994) Cesaroni, R., Churchwell, E., Hofner, P., Walmsley, C. M., Kurtz, S., 1994, A&A, 288, 903
- Panagia and Walmsley (1978) Panagia, N., Walmsley, C. M. 1978, A&A, 70, 411
- Brand and Blitz (1993) Brand, L., Blitz, L. 1993, A&A, 275, 67
- Little et al. (1994) Little, L. T., Gibb, A. G., Heaton, D. B., Ellison, B. N., Claude, S. M. X. 1994, MNRAS, 271, 649
- Blake et al. (1987) Blake, G. A., Sutton, E. C., Masson, C. R., Phillips, T. G. 1987, ApJ, 315, 621
- Churchwell & Hollis (1983) Churchwell, E., Hollis, J. M., 1983, ApJ, 272, 591
- Kuiper et al. (1984) Kuiper, T. B. H., Rodriguez Kuiper, E. N., Dickinson, D. F., Turner, B. E., Zuckerman, B. 1984, ApJ, 276, 211
- Pratap et al. (1997) Pratap, P., Dickens, J. E., Snell, R. L., Miralles, M. P., Bergin, E. A., Irvine W. M., Schloerb, F. P. 1997, A&A, 486, 862
- Lee et al. (1996) Lee, H. H., Bettens, R. P. A., Herbst, E. 1996, ApJS, 119, 111
- Kuiper et al. (1996) Kuiper, T. B. H., Langer, W. D., Velusamy, T. 1996, ApJ, 468, 761
- Bergin et al. (1997) Bergin, E. A., Goldsmith, P. F., Snell, R. L., Langer, W. D. 1997, ApJ, 482, 285