The Axially Symmetric Ejecta of Supernova 1987A
Abstract
Extensive early observations proved that the ejecta of supernova 1987A (SN 1987A) are aspherical. The most important of these early observations include (a) the “Bochum event” that revealed small-scale spectroscopic structure indicating chemical inhomogeneities of the ejecta; (b) spectropolarimetry that showed deviations from spherical symmetry; (c) speckle observations that revealed both the asymmetry of the ejecta and the “mystery spot” manifested as a secondary source off center from the bulk of the supernova ejecta. Fifteen years after the supernova explosion, the Hubble Space Telescope has resolved the rapidly expanding ejecta. The late-time images and spectroscopy provide a geometrical picture that is consistent with early observations and suggests a highly structured, axially symmetric geometry. We present here a new synthesis of the old and new data. We show that the Bochum event, presumably a clump of 56Ni, and the late-time image, the locus of excitation by 44Ti, are most naturally accounted for by sharing a common position angle of about 14o, the same as the mystery spot and early speckle data on the ejecta, and that they are both oriented along the axis of the inner circumstellar ring at 45o to the plane of the sky. We also demonstrate that the polarization represents a prolate geometry with the same position angle and axis as the early speckle data and the late-time image and hence that the geometry has been fixed in time and throughout the ejecta. The Bochum event and the Doppler kinematics of the [Ca II]/[O II] emission in spatially resolved HST spectra of the ejecta can be consistently integrated into this geometry. The radioactive clump is deduced to fall approximately along the axis of the inner circumstellar ring and therefore to be redshifted in the North whereas the [Ca II]/[O II] 7300 Å emission is redshifted in the South. We present a jet-induced model for the explosion and argue that such a model can account for many of the observed asymmetries. In the jet models, the oxygen and calcium are not expected to be distributed along the jet, but primarily in an expanding torus that shares the plane and northern blue shift of the inner circumstellar ring.
1 Introduction
SN 1987A is a Type II supernova in which the central iron core of a massive star collapsed to form a dense neutron star or black hole. Most of the conventional models assume that the explosion process is roughly spherical. The model assumption of sphericity can be tested by observations. It has been shown that core-collapse supernovae are normally linearly polarized at a level around 1% (Trammell et al. 1993; Wang et al. 1996; Tran et al. 1997; Wang et al. 2001; Leonard et al. 2000, 2001; Leonard & Filippenko 2001). For a given supernova, the degree of polarization evolves with time in a way that the closer we see into the center the higher the degree of polarization (Wang et al. 1996; Wang et al. 2001; Leonard et al. 2001). The degree of polarization seems also to be correlated with the mass of the stellar envelope; more massive envelopes show a lower degree of polarization (Wang et al. 2001; Leonard & Filippenko 2001). The linear polarization measures the asphericity of the supernova photosphere, and the polarization data suggest models in which the central engine that drives a core-collapse supernova explosion is highly aspherical (Höflich, Wheeler, & Wang 1999; Khokhlov & Höflich 2000; Wheeler, et al. 2000; Höflich, Khohklov & Wang 2001).
As the brightest and the best observed supernova of modern astronomy, SN 1987A provides a unique test case of the geometry of a core-collapse supernova. Recent Hubble Space Telecsope images and spectroscopy are able to resolve the ejecta and it is now possible to re-visit SN 1987A and see if the early and late observations can be integrated into a single self-consistent picture. In the following, we will discuss the observed structures around SN 1987A from the outermost circumstellar material inward to the central rapidly expanding ejecta and provide a scenerio for many of the features in terms of a jet-induced explosion.
2 The Circumstellar Material of SN 1987A
The circumstellar material (CSM) of SN 1987A is highly structured (Wampler et al. 1990; Crotts & Heathcote 1991). The nebulosity consists of a diffuse bow-shock shaped structure called “Napolean’s Hat” and several nebular rings (Wampler et al. 1990; Wang & Wampler 1992). The nebular rings were shown beautifully by images taken by the HST (Plait et al. 1995; Burrows et al. 1995; Panagia et al. 1996). The bright inner nebular rings were found to be enriched in helium and nitrogen and are believed to be material lost by the progenitor star before the explosion (Wang 1991; Wang & Mazzali 1992; Lundqvist & Fransson 1996). Napolean’s Hat is also likely to be associated with the mass loss of the progenitor star (Wang & Wampler 1992). The innermost bright (CSM) ring observed by the HST reveals a symmetry axis of the nebulosity at a position angle (PA) of 89o that is roughly consistent with the symmetry axis of the Napolean’s Hat nebula (Burrows et al. 1995). Napolean’s Hat and the circumstellar rings were formed long before the explosion of SN 1987A, but they define a geometry that extends deep into the core of the supernova.
3 The Supernova Ejecta
Interior to the smallest circumstellar ring are the ejecta of the supernova, the material of which is expanding at velocities from about 40,000 km s-1 in the outermost hydrogen envelope (Pun et al. 1995) down to about 1,300 km s-1 in the carbon/oxygen-rich core. The ejected material was too compact at early times for normal direct imaging, but the asymmetry of the ejecta was revealed by speckle observations (Papaliolios et al. 1989) beginning in June 1987, after the second optical maximum. Extensive linear spectropolarimetry measurements were obtained during the first year after the supernova explosion (e.g. Bailey 1988; Mendez et al. 1988; Schwartz 1987; Jeffery 1991). The linear polarization is produced by electron scattering (Shapiro & Sutherland 1982; Höflich 1991) and probes the geometry of the photosphere (see, however, Wang & Wheeler 1996 for an alternative model involving an hypothesized circumstellar dust clump). A general increase of the polarization from about 0.1% 2 days after explosion to 1.1% at 200 days was observed. The dominant polarization position angle (PA) defined by the loci of the data points on the Q-U diagram (Wang et al. 2001) was nearly constant at 110o from early to late observations (cf. Q-U plots of Bailey et al. 1988: Cropper et al. 1988). Since the degree of linear polarization increases with the degree of asymmetry of the ejecta, these polarimetry observations show that the scattering surface in the ejecta becomes increasingly asymmetric as we probe deeper into the core. The fact that the polarization PA is constant implies that the photosphere of the supernova has a single well-defined axis of symmetry.
More evidence of deviations from spherical symmetry is provided by the so-called “Bochum event.” During days 20-100, the H line exhibited two additional emission-like features at a velocity of about 4500 km s-1 nearly symmetric on both the blue and red side of the H line (Hanuschik et al. 1988; Phillips & Heathecote 1989). The emission components are most likely to be caused by 56Ni clumps ejected during the explosion (Lucy 1988; Utrobin, Chugai, & Andronova 1995). The existence of high-velocity 56Ni was also suggested by the earlier-than-expected detection of X-rays (Dotani et al. 1987; Sunyaev et al. 1987) and -rays (Matz et al. 1988).
The line of sight velocity of the Bochum clumps can be measured from the Doppler shift of the spectral profiles and compared to the photospheric velocity using arguments based on geometric obscuration to deduce the transverse velocity and space velocity (Utrobin et al. 1995). By assuming photospheric velocities of 2800 and 2300 km s-1 on days 29 and 41, respectively, Utrobin, et al. (1995) estimated the transverse velocity of the 56Ni clump to be about 2400 km s-1 and the angle between the line of sight and the vector of the absolute velocity to be 31o. These results depend on the location of the photosphere since the velocities must be such that at a given epoch the photosphere does not obscure the clump. The observed blueshift of the minima of the P-Cygni profiles of various lines show a large range. For example, on day 27.76, the velocities are -7603, -7262, -5968, -3136, -2891, -5107, -4337, -3673, -2869 km s-1 for H, H, H, Fe II 5018, Fe II 5169, Na I 5893, Ba II 4554, Ba II 6142, and Sc II 5527, respectively (Phillips et al. 1988). The Bochum event appeared on day 20 when the photosphere was at a velocity around 3800 km s-1 as indicated by the measured velocity of the weak Fe II 5018 line. Detailed NLTE spectral analysis and the Doppler shifts of weak lines gave the photospheric velocity to be around 4300 km s-1 on day 29, and 3200 km s-1 on day 41 (Lucy 1988; Höflich 1988).
These higher photospheric velocities mean that at a given epoch the photosphere was at a larger radius than assumed by Utrobin et al. and hence that the clump must be at a larger angle to the line of sight to avoid obscuration by the photosphere. We find that the motion of the 56Ni clump is broadly consistent with being tilted by roughly 45o from the line of sight. Chugai (1992) had earlier estimated the transverse velocity of the 56Ni clump to be from 4000 km s-1 to 5000 km s-1 with a representive mean of 4500 km s-1. Such a transverse velocity is in agreement with the conclusion that the 56Ni clump is directed at 45o from the line of sight. The 45o orientation we deduce for the 56Ni clump is close to the inclination of the symmetry axis of the circumstellar rings. Such a location of the 56Ni clump is also consistent with the profile of the Ni II 6.6 m line observed at day 640 (Colgan et al. 1994). While we cannot determine the PA of these 56Ni clumps on the plane of the sky from the Doppler shift data alone, the strong implication is that they share a common axis with the circumstellar rings.
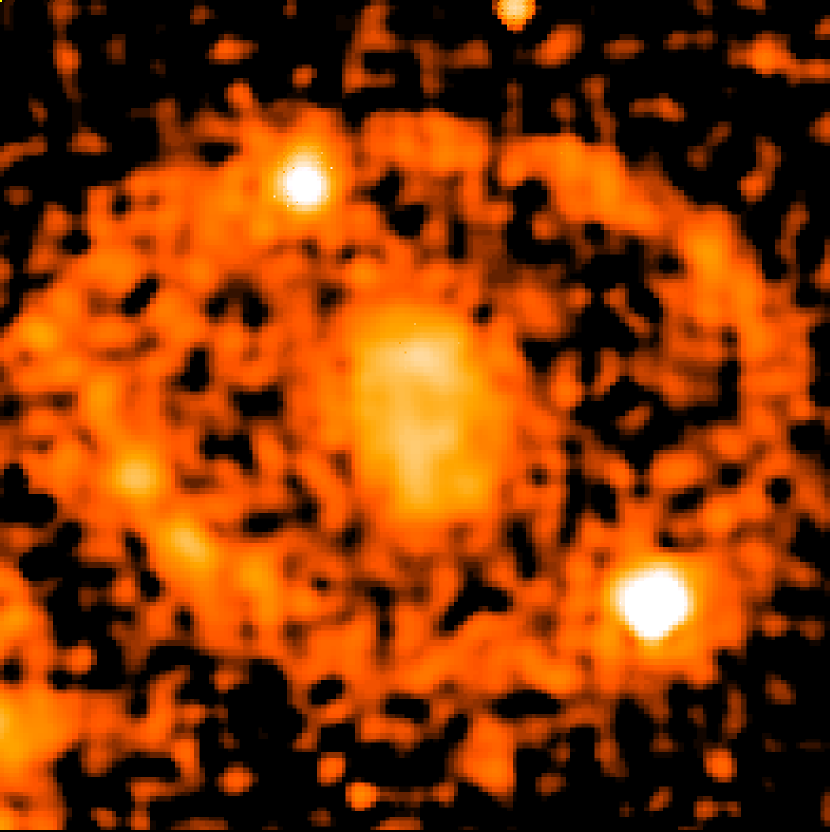
Recent HST images are able to spatially resolve the ejecta. Figure 1 shows an image taken in the F439W filter on 2000 June 11 (see also Jansen & Jakobsen 2001). The ejecta are obviously elongated at a PA of about 145o. At such a late stage, the images in this filter show a mixture of emission from Fe I and Fe II, with some minor contributions from hydrogen Balmer lines (Wang et al. 1996; Chugai et al. 1997). The images display the locus of the late-time excitation by 44Ti and hence show that the late-time deposition is asymmetric and substantially bipolar. The PA of the ejecta is remarkably consistent with the alignment derived from early speckle observations of the ejecta (205o; Papaliolios et al. 1989) and for the mystery spot (143o to 1943o; Nisenson et al. 1987; Meikle, Matcher, & Morgan 1987; Nisenson & Papaliolios 1999). The major axis of the ejecta lies roughly in the direction of the minor axis of the inner nebular ring and of Napoleon’s Hat, but is noticeably offset by about 15o.
It is natural and expected that the 56Ni clumps of the Bochum event and the distribution of 44Ti that powers the late-time ejecta be associated. This is another argument that the 56Ni clumps share the PA of the images and the mystery spot, and in turn that these features all share the same orientation with respect to the line of sight, about 45o to the plane of the sky, away from the observer in the North.
4 The Structure of the Ejecta
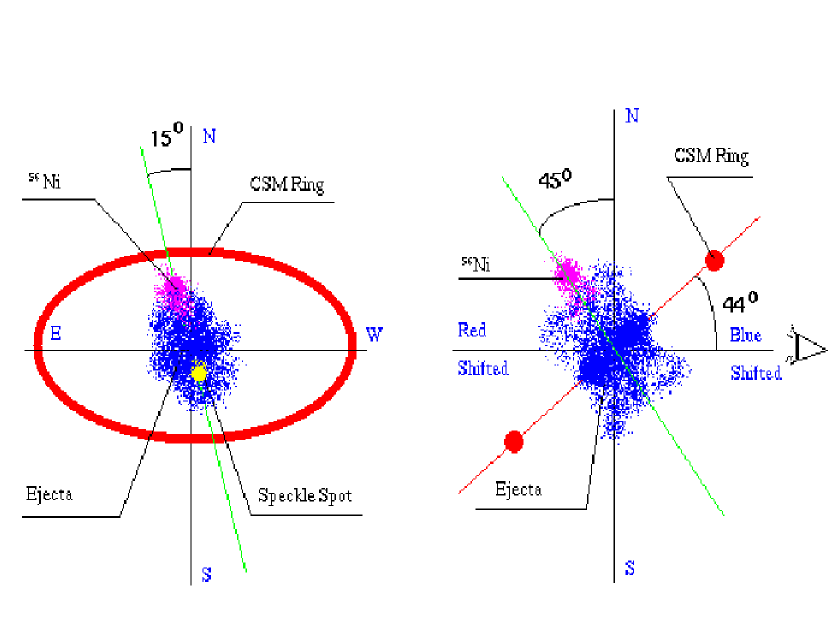
The schematic structure shown in Figure 2 may consistently account for most of the observed features summarized above. Figure 2a shows the perspective from Earth. Figure 2b shows the structure projected onto the plane formed by the line of sight and the line from the origin to the North. The ring plane is inclined by about 44o to the line of sight. The 56Ni clump that can consistently explain the redshifted component of the Bochum event is shown in Figure 2b as well. Note that although this 56Ni clump can be consistently located on the symmetry axis of the ejecta by arguing that the 56Ni and 44Ti have similar distributions, the only direct observational constraint is that the 56Ni clump is located at an angle to the line of sight of 45o.
To test whether or not the ejecta morphology observed with the HST is consistent with early spectropolarimetry, we estimated the expected polarization PA assuming either an oblate or prolate spheroid for the scattering geometry. We examined two cases, one with the symmetry axis of the spheroid placed along the symmetry axis of the inner ring and one with the symmetry axis along the axis of the HST image of the ejecta (and of the mystery spot). For the oblate case, the PA of the polarization is co-aligned with the symmetry axis of the ellipsoid; for the prolate case, the symmetry axis implied by the polarization is at 90o from the PA of the polarization. Table 1 lists the PAs of the major axis of the inner circumstellar ring and of the ejecta and the predicted polarization PAs for the two cases of oblate and prolate ellipsoids. The polarimetry position angle defined by early broad-band observations from Cropper et al. (1987) is 129o, and from Bailey (1988) is 110o, whereas the spectropolarimetry on June 3 for the 5800 Å-region defines a line at close to 0o (Cropper et al. 1988). When all the spectropolarimetric data are plotted on a single Q-U digram they define a dominant axis corresponding to a position angle of 16.5o–106.5o (Cropper et al. 1988). The polarization PA corrected for interstellar polarization is around 110o; this is consistent only with a prolate spheroid oriented in the same direction as the HST images of the ejecta.
This is a remarkable concordance. The early spectropolarimetry probes the geometry of the outer hydrogen envelope, while the HST images show emission primarily from metal lines, a completely different region. The fact that these different measures show similar structure is a strong indication that both observations reveal the geometry of the ejecta, despite the fact that the ejecta may be heavily obscured by dust clumps synthesized about 530 days after explosion (Lucy et al. 1989). In particular, the constancy of the polarization PA shows that the scattering geometry did not, for instance, evolve from oblate to prolate. The simplest hypothesis is that the constant polarization angle reflected the geometry of the ejecta ultimately revealed by the direct images of the ejecta. This hypothesis is confirmed by this quantitive check on the polarization PA. From the earliest epochs, the polarization of SN 1987A revealed a prolate scattering geometry that was congruent with the physical asymmetry of the iron-rich ejecta.
5 Kinematics of the Ejecta
At first glance, if the schematic picture of Figure 2b is true, we should expect the northern part of the ejecta which points away from us to be redshifted and the southern part of the ejecta to be blueshifted since it points toward us. Spatially resolved spectroscopy obtained using the HST shows the opposite trend. Figure 3 shows the profile of the [O II], [Ca II] 7300 Å blend. The line peak of the southern part (the bottom slice) is obviously redshifted compared to that of the northern part (the top slice) by about 1270 km s-1.
This apparent inconsistency has two important lessons to teach. In the first place, this pattern is not consistent with a spherical geometry for the ejecta. Even with the effects of dust, one would expect the same Doppler shift in the north and in the south, not a gradient, as seen. We note that the shift of line centers in Figure 3 is not monotonic from the north to south, but the central slice, representing (within positioning errors, see below) the centroid of the geometry, is blueshifted in an absolute sense and with respect to the general trend from north to south. This departure from the trend could easily be explained by a clump of obscuring dust that is thickest near the center of the ejecta.
The second lesson of Figure 3 is that the apparent discrepancy with the kinematics of the jet-like structure in Figure 2 can be resolved in the following way. The ejecta are likely to be neither spherically symmetric nor homogeneously mixed and the [O II], [Ca II] emission is probably formed in a different zone compared to the Fe I and Fe II emitting zones that are responsible for the shape of the direct images. In particular, if the density of the oxygen and calcium-rich ejecta is enhanced in the equatorial plane, then the emissivity in the equatorial plane will be higher than at the poles. This effect, plus some central dust, can easily produce the gradient in velocity from the north to south. This behavior is expected from a dusty oblate ellipsoid or torus. Detailed analyses of the spatially resolved spectra is clearly needed to map the ejecta geometry and kinematics and the dust distribution, but is beyond the scope of this paper. Nevertheless, we show in the next section that the inferred geometry – nickel clumps along the axis and an expanding equatorial torus of oxygen and calcium – are predicted by a jet-induced model for the explosion.
While an equatorial torus is consistent with the overall gradient in velocity displayed in Figure 3, we note the curious fact that the whole system seems to have a rather large positive velocity (with the exception of the possibly dust-obscured central portion). The southernmost portion has a velocity of about 1770 km s-1 and the northernmost about 500 km s-1. A small portion of this overall redshift can be accounted for by the space motion of the LMC of 290 km s-1, but that leaves about 1000 km s-1to explain. Some of this, but surely not the whole amount, could be due to a space motion of the supernova itself. We suspect that the bulk of the effect is related to the fact that the feature in Figure 3 is actually a blend of [O II] 7320 and [Ca II] 7300. It is not clear which is more dominant, so the rest frame wavelength (7300 Å) used in making the plot may not be correct. A 20 Å uncertainty corresponds to about 800 km s-1. There may also be some error in the STIS wavelength calibrations. We have checked this hypothesis by examining the He I/Na I d blend. If this feature is dominated by Na D, then the data agree with a torus picture with a blueshift in the north and a redshift in the south, but there is a net offset if the feature is identified as pure helium. Another contribution could come from the uncertain positioning of the slit. The overall expansion speed of the inner portion of the ejecta (note the width of the features in Figure 3 is about 3000 km s-1. While an attempt was made to position the slit so that it was centered on the ejecta, an offset by only one or two pixels to the south could mean that the light down the slit was weighted toward southern, redshifted ejecta.
The important aspect of these observations in the current context is the clear gradient in velocity from north to south. In the next section we show that this is consistent with the expectations of a jet-induced explosion.
6 Implications of Explosion Models of Core-Collapse Supernovae
The observed bipolar structure of the ejecta and the ejection of 56Ni at velocities above 5,000 km s-1 argue strongly that the engine that caused the supernova event was highly aspherical. A model assuming bipolar, non-relativistic jets formed at the center of the explosion that can successfully eject the supernova envelope can help us to understand how the asymmetry was produced (Khokhlov et al. 1999; Khokhlov & Höflich 2000; Höflich, Khokhlov, & Wang 2001).
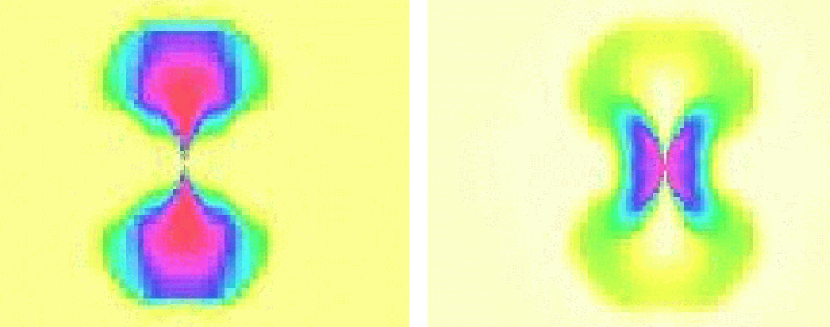
As an example, in Figure 4 we give the resulting chemical distribution of the inner layers at 250 s after core collapse for an explosion of a Type II supernova triggered by a non-relativistic jet with a velocity of 11,000 km s-1 that operates over and provides an explosion energy of about erg in a progenitor of 15 . At about 200 s, the jet material “stalls” in the expanding material. The density contours in the subsequent phases of the explosion become almost spherical with the asymmetric chemical profiles frozen into the envelope (Khokhlov & Höflich 2000; Höflich, Khokhlov, & Wang 2001). During the phase of free expansion, the bow shock shows velocities of about 5000 km s-1. The resulting chemical composition structures are highly aspherical. Plumes of 56Ni will be selectively ejected along the jet axes and helium, oxygen, and calcium (not shown) will be concentrated in expanding tori on the equator.
The nickel plumes can possibly explain the Bochum event and the apparent prolate asymmetry of the ejecta image. In addition, the axial distribution of excitation by radioactive decay will produce an aspherical photosphere even in a nearly spherical density distribution (Wang et al. 2001; Höflich, Khokhlov, & Wang 2001). Thus if 56Ni is distributed along a bipolar axis, we expect the polarization to reflect that axis with an orientation fixed in time, as observed. The higher density of calcium in the expanding equatorial torus will give a greater emission measure near the equator and hence account for the observed northern blueshifted component.
We feel it is highly unlikely that a basically spherical model involving only Rayleigh-Taylor instabilities could reproduce the observed geometry. Jet-driven models provide an interesting alternative, although the mechanism of jet formation during the core-collapse process remains unclear. Possible mechanisms of jet formation during the collapse to form a neutron star have been discussed recently (Wheeler et al. 2000, 2002; Akiyama et al. 2002) as have asymmetries associated with neutrino flow (Shimizu, Yamada, & Sato 1994; Shimizu et al. 2001; Fryer & Heger 2000). Black-hole formation is another possibility (MacFadyen & Woosley 1999).
7 Conclusions
We have shown that SN 1987A has revealed a common bipolar axis of symmetry from the early photospheric phase to the late imaging of the ejecta. We have shown for the first time that the images and the polarimetry are consistent with a prolate geometry oriented nearly (but not exactly) along the axis of the inner CSM ring. We have also deduced the orientation of the nickel clumps that were observed as the “Bochum event” with respect to the line of sight and argue that these clumps are likely to be co-aligned with the bipolar ejecta revealed in late HST images. The matter that shows up in the images is precisely that heated by the long-term input of radioactive decay of 44Ti. Nagataki (2000) argues that the required abundance of 44Ti itself may be evidence for explosion by a jet-like phenomenon. Emission from [O II] and [Ca II] does not contribute substantially to the HST images, but is shown in resolved spectroscopy to be blueshifted in the North where the bipolar flow and one component of the Bochum event are directed away from the observer. The existence and orientation of the Bochum event, the common axis of polarization PA with the late-time image, and the northern blueshifted oxygen and calcium are all consistent with, and even predicted by, jet-induced supernova models. In these models, radioactive matter is ejected primarily along the poles and elements synthesized in the progenitor (He, O, Ca) are ejected in expanding equatorial tori by shocks that propagate away from the bow shock of the jets and converge on the equator. The synthesis of observations we have presented here is consistent with a model in which SN 1987A underwent a bipolar jet-induced explosion along a common axis that ran from the photosphere deep into the ejecta.
The small difference of 15o between the symmetry axis of the ejecta and the inner CSM ring may provide some additional clues to the overall evolution and explosion of SN 1987A. If the axes of symmetry are all related to the rotation of the progenitor, then we should expect a single axis during all these processes in order to conserve angular momentum. What has changed the symmetry axis, and therefore carried away angular momentum from the system? Could it be that the explosion was dominated by a magnetic field and the inner ring was dominated by rotation? Or vice versa? Finally, we note again that the mystery spot closely aligns with the ejecta and the prolate axis of the polarization geometry. The mystery spot still begs explanation (Rees 1987; Piran & Nakamura 1987). Perhaps the geometry we present here can provide new clues to that problem as well. These are all open questions to be pursued with the strong suspicion that SN 1987A was a bipolar explosion.
Acknowledgements
Support for this work was provided by NASA through grants GO 08243 and 09114 from the Space Telescope Science Institute, which is operated by the Association of Universities for Research in Astronomy, Inc., under NASA contract NAS5-26255. Additional support was provided by NASA through grant NAG5-10766 and by NSF through grant AST-0098644 to the University of Texas.
References
- (1)
- (2) Akiyama, S., Wheeler, J. C., Meier, D. L., & Lichenstadt, I. 2002, ApJ, submitted.
- (3) Bailey, J. 1988, PASAU, 7, 405
- (4) Burrows C. J., et al. 1995, ApJ, 452, 680
- (5) Chugai, N. N. 1992, SvAL, 18, 50
- (6) Chugai, N. N., Chevalier, R. A., Kirshner, R. P., & Challis, P. M. 1997, ApJ, 483, 925
- (7) Colgan, S. W. J., Haas, M. R., Erickson, E. F., Lord, S. D., & Hollenbach, D. J. 1994, ApJ, 427, 874
- (8) Crotts, A. P., & Heathcote, S. R. 1991, Nature, 350, 654
- (9) Dotani, T., Hayashida, K., Inoue, H., Itoh, M., & Koyama, K. 1987, Nature, 330, 230
- (10) Fryer, C. L., & Heger, A. 2000, ApJ, 541, 1033
- (11) Hanuschik, R. W., Thimm, G., & Dachs, J. 1988, MNRAS, 234, 41
- (12) Höflich, P. 1988, PASAU, 7, 434
- (13) Höflich, P. 1991, A&A, 246, 481
- (14) Höflich P., Khokhlov, A. M., & Wang, L. 2001, in Proc. of 20th Texas Symposium on Relativistic Astrophysics, ed. J. C. Wheeler & H. Martel (New York: American Institute of Physics), 459
- (15) Höflich, P., Wheeler, J. C., & Wang, L. 1999, ApJ, 521, 179
- (16) Jansen, R. A., & Jakobsen, P. 2001, A&A, 370, 1056
- (17) Jeffery, D. J. 1991, ApJS, 77, 405
- (18) Khokhlov, A. M., & Höflich, P. A. 2000, in Explosive Phenomena in Astrophysical Compact Objects, ed. H.-Y. Chang, C.-H. Lee, & M. Rho (New York: American Institute of Physics), 301
- (19) Khokhlov, A. M., Höflich, P. A., Oran, E. S., Wheeler, J. C., Wang, L., & Chtchelkanova, A. Yu. 1999, ApJ, 524, L107
- (20) Leonard, D. C., Filippenko A. V., Ardila, D. R., & Brotherton, M. S. 2001 ApJ, 553, 86
- (21) Leonard, D. C., & Filippenko, A. V. 2001, PASP, 113, 920
- (22) Leonard, D. C., Filippenko, A. V., Barth, A. J., & Matheson, T. 2000, ApJ, 536, 239
- (23) Lucy, L. 1988, in Supernova 1987A in the Large Magellanic Cloud, ed. M. Kafatos & A. G. Michalitsianos (Cambridge: Cambridge Univ. Press), 323
- (24) Lucy, L. B., Danziger, I. J., Gouiffes, C., & Bouchet, P. 1989, in Structure and Dynamics of the Interstellar Medium, Proceedings of IAU Colloq. 120, eds. G. Tenorio-Tagle, M. Moles & J. Melnick, also Lecture Notes in Physics, 350, 164
- (25) Lundqvist, P., & Fransson, C. 1996, ApJ. 464, 924
- (26) MacFadyen, A. I., & Woosley, S. E. 1999, ApJ, 524, 262
- (27) Matz, S. M., Share, G. H., Leising, M. D., Chupp, E. L., & Vestrand, W. T. Nature, 331, 416
- (28) Meikle, W. P. S., Matcher, S. J., & Morgan, B. L. 1987, Nature, 329, 608
- (29) Mendez, M., Clocchiatti, A., Benvenuto, O. G., Feinstein, C., & Marraco, H. G. 1988, ApJ, 334, 295
- (30) Nagataki, S. 2000, ApJS, 127, 141
- (31) Nisenson, P., & Papaliolios, C. 1999, ApJ, 518, L29
- (32) Nisenson, P., Popaliolios, C., Karovska, M., & Noyes, R. 1987, ApJ, 320, L15
- (33) Panagia, N., Scuderi, S., Gilmozzi, R., Challis, P. M., Garnavich, P. M., & Kirshner, R. P 1996, ApJ, 459, L17
- (34) Papaliolios, C., Krasovska, M., Keochlin, L., Nisenson, P., & Standley, C. 1989, Nature, 338, 565.
- (35) Phillips, M. M., & Heathecote, S. R. 1989, PASP, 101, 137
- (36) Phillips, M. M., Heathecote, S. R., Hamuy, M., & Navarrete, M. 1988, AJ, 95, 1087
- (37) Piran, T., & Nakamura, T. 1987, Nature, 330, 28
- (38) Plait, P. C., Lundqvist, P., Chevalier, R. A., & Kirshner, R. P. 1995, ApJ, 439, 730
- (39) Pun, C. S. J. et al. 1995, ApJS, 99, 223
- (40) Rees, M. J. 1987, Nature, 328, 207
- (41) Schwartz, H. E. 1987, in ESO Workshop on the SN 1987A, ed. I. J. Danziger (Garching: ESO), 167
- (42) Shapiro, P. R., & Sutherland, P. G. 1982, ApJ, 263, 902
- (43) Shimizu, T., Ebisuzaki, T., Sato, K., & Yamada, S. 2001, ApJ, 552, 756
- (44) Shimizu, T., Yamada, S., & Sato, K. 1994, ApJ, 432, 119
- (45) Sunyaev, R., et al. 1987, Nature, 330, 227
- (46) Trammell, S. R., Hines, D. C., & Wheeler, J. C. 1993, ApJ, 414, L21
- (47) Tran, H. D., Filippenko, A. V., Schmidt, G. D., Bjorkman, K. S., Jannuzi, B. T., & Smith, P. S. 1997, PASP, 109, 489
- (48) Utrobin, V. P., Chugai, N. N., & Andronova, A. A. 1995, ApJ, 295, 129
- (49) Wampler, E. J., Wang, L., Baade, D., Banse, K., D’Odorico, S., Gouiffes, C., & Tarenghi, M. 1990, ApJ, 362, L13
- (50) Wang, L. 1991, A&A, 246, L69
- (51) Wang, L., Howell, D. A., Höflich, P., & Wheeler, J. C. 2001, ApJ, 550, 1030
- (52) Wang, L., & Mazzali, P. A. 1992, Nat, 355, 58
- (53) Wang, L., & Wampler, E. J. 1992, A&A, 262, L9
- (54) Wang, L., & Wheeler, J. C. 1996, ApJ, 462, L27
- (55) Wang, L., Wheeler, J. C., Kirshner, R. P., Challis, P. M., Filippenko, A. V., Fransson, C., Panagia, N., Phillips, M. M., & Suntzeff, N. 1996, ApJ, 466, 998
- (56) Wang, L., Wheeler, J. C., Li, Z., & Clocchiatti, A. 1996, ApJ, 467, 435
- (57) Wheeler, J. C., Meier, D. L., & Wilson, J. R. 2002, ApJ, in press
- (58) Wheeler J. C., Yi, I., Höflich, P., & Wang L. 2000, ApJ, 537, 810
- (59)
Table 1. Polarization Position Angles
| Geometry | P A of Major Symmetry Axis | Predicted P A of Pol. |
|---|---|---|
| Oblate | 179o(CSM ring) | 179o |
| Prolate | 179o(CSM ring) | 89o |
| Oblate | 194o5o (ejecta image) | 145o |
| Prolate | 194o5o (ejecta image) | 1045o |