THE SPECTRUM OF THE MILLISECOND PULSAR J02184232 – THEORETICAL INTERPRETATIONS
We interpret the unique high-energy spectrum of the millisecond pulsar PSR J02184232 within polar cap scenarios. We show that the spectral data from BeppoSAX and EGRET impose very restrictive limitations on possible radiation mechanisms, energy spectrum of radiating charges as well as viewing geometry. Theoretical spectra are able to reproduce the data, however, this can be achieved provided very special – unusual within the conventional polar cap picture – conditions are satisfied. Those include off-beam viewing geometry along with one of the following alternatives: 1) strong acceleration of secondary pairs; 2) broad energy distribution of primary electrons extending down to MeV; 3) high-altitude synchrotron emission.
1 Introduction
PSR J02184232, with the spin period ms and the inferred dipolar magnetic field at polar cap G, is the only millisecond pulsar which has been marginally detected above 100 MeV . A broad-band high-energy spectrum of this object exhibits unusual features, completely different from those observed among young gamma-ray pulsars: Above 100 MeV the photon index and the spectrum resembles the very soft spectra of middle latitude unidentified EGRET sources. Within the BeppoSAX range the spectrum is extremely hard: .
Kuiper et al. noticed that neither the polar cap nor the outer gap models could naturally explain the spectrum. The aim of this work is to carefully examine an ability of polar cap models to reproduce the spectrum of J02184232.
2 Directional characteristics of pulsar spectra predicted by the polar cap model
As we show in the acompanying paper (Woźna et al., these proceedings) the viewing geometry effects have crucial significance for the appearance of a pulsar spectrum for a given observer. For purely dipolar magnetic field the geometry is determined by two angles: – the angle of dipole inclination relative to the rotation axis, and – the angle between an observer’s line of sight and the rotation axis. Various combinations of and result in a large variety of spectral shapes and pulse profiles in high-energy domain. However, a particular energetic history of electrons in pulsar magnetosphere enables to extract two main cases: the on-beam and the off-beam geometry.
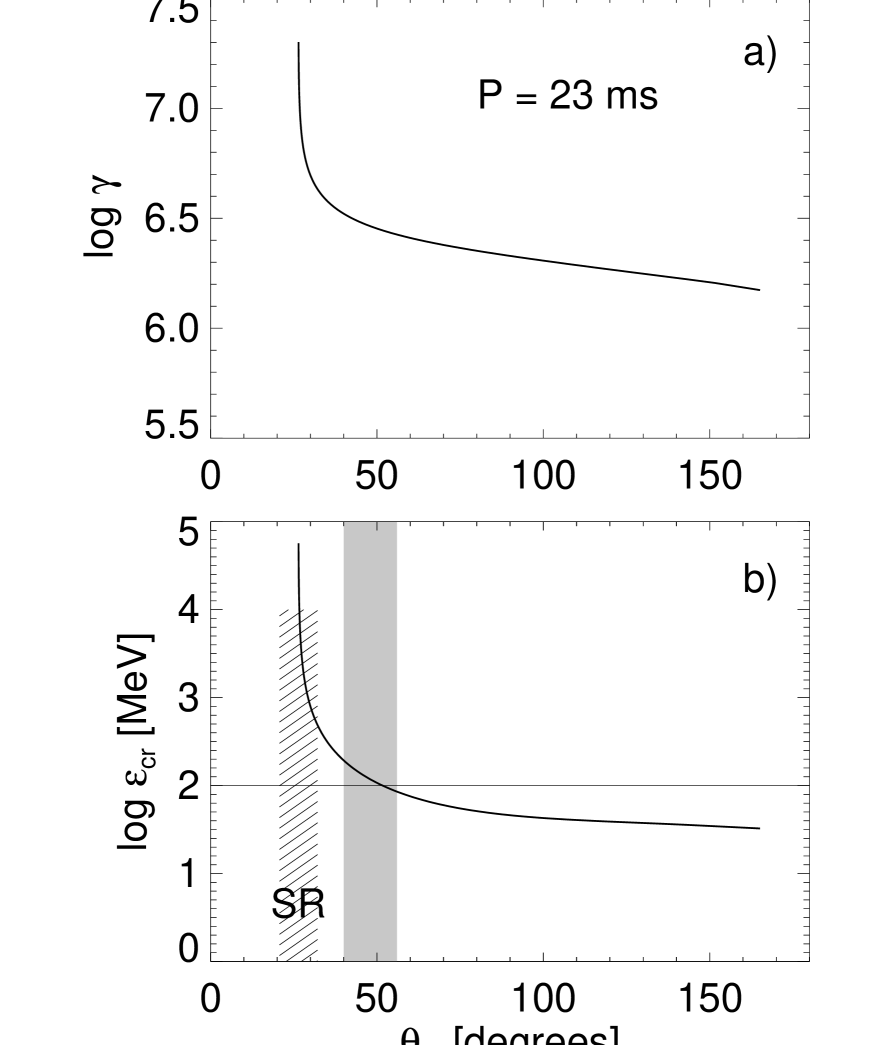
Fig. 1a presents the Lorentz factor of electrons injected at the surface of neutron star along the ”last open” magnetic field lines as a function of angle between magnetic dipole axis and a local tangent to magnetic field line at the electrons’ position. The value of corresponds to the direction of at the polar cap rim ( is the angular radius of the polar cap, measured from the center of neutron star). The rotation period ms and the initial Lorentz factor were assumed in these calculations. The electron energy losses noticeable in Fig. 1a are purely due to the emission of curvature radiation aaaResonant inverse Compton scatterings cannot influence the electron’s energy due to small relative energy losses per scattering in a weak magnetic field (eg. Dyks, Rudak, Bulik ) whereas non-resonant scatterings (they occur in the Klein-Nishina regime) are too rare for surface temperature values relevant for neutron stars. The CR energy loss rate of an electron is initially huge, but because of its strong dependence on electron energy (, is the local radius of curvature of magnetic field lines) it becomes negligible after the electron traverses a length which is small in comparison with the light cylinder radius . Thus, after the initial rapid drop, the electron’s energy starts to decrease very slowly (Fig. 1a).
The characteristic energy of curvature photons emitted by the electron in different directions is shown in Fig. 1b. Because is very sensitive to () the high-energy cutoff in the CR spectrum decreases rapidly for increasing angles but then it starts to approach ”asymptotically” the value of MeV. This is in part due to the slower decrease in at higher altitudes and in part due to an increase in which starts to take place for . In fact, Rudak & Dyks (RD99) estimated an ”absolute minimum” of for the Lorentz factor of CR-cooled electrons (eq. (7) in RD99) and the absolute lower limit of MeV for (eq. (8) in RD99). These values are in reasonable agreement with the exact results presented in Fig. 1, given the crude method used in RD99. We recall here that the lower limit for practically does not depend on any pulsar parameters (eg. exact calculations for rotation period s give MeV at ).
An important implication of Fig. 1b is that pulsar radiation pattern can be considered as consisting of two components: a hollow cone of very high-energy emission extending up to GeV range (with opening half-angle ) and a much less anisotropic emission peaking close to 30 MeV. When the line of sight crosses the hollow cone beam (on-beam geometry) the recorded spectrum consists of two components: a curvature component and a synchrotron component due to synchrotron radiation (SR) from secondary electron-positron pairs. The shape of this spectrum is similar to the total spectrum emitted in all directions, shown in fig. 1 of RD99. Its qualitative features can also be assesed from Fig. 1b: The spectrum extends up to GeV range and is relatively soft within the EGRET range because it is composed of instantaneous CR spectra with different values of (Fig. 1b). The value of photon index in this spectral range depends on the viewing angle as well as on the rotation period . For millisecond periods it is close to . Within the entire X-ray range ( keV – a few MeV) the on-beam spectrum is dominated by the synchrotron component with the well-known photon index (RD99).
As noted by Kuiper et al., these on-beam
characteristics are in clear
disagreement with the high-energy data on J02184232.
We, therefore, propose the off-beam
geometry for this pulsar ie. the case
when the line of sight misses the hollow cone beam.
With this assumption
the problem of wrong slopes within the BeppoSAX and the EGRET
range can be solved.
Since CR photons of the highest-energy are converted into the pairs
with Lorentz factors (in G),
most of synchrotron photons
follow the direction of the ”parent” CR photons and are constrained to a
narrow range of angles around with a spread of
sr (Fig. 1b).
Therefore,
in the off-beam case one misses the SR emission and the spectrum
consists of the CR component only. Thick solid line in Fig. 2 presents
this kind of spectrum calculated for
and (which corresponds to in Fig. 1).
The spectrum resembles very closely
the well-known instantaneous CR spectrum
due to monoenergetic electrons with no cooling.
The reason for this is clearly shown in Fig. 1b:
because of the near alignment of the dipole and the rotation axis
() the off-beam line of sight samples only a very
limited range of : between and
(grey band in Fig. 1b).
bbb
Interestingly, the shape of the spectrum would not change much even if
the line of sight sampled much larger range of within
the off-beam region (say between and ). This is because
of the remarkable stability of at high altitudes – see
Fig. 1b.
Below a high-energy cutoff at MeV
the CR spectrum has the photon index .

If the X-ray emission from J02184232 is generated close to the neutron star surface, it can be explained only as a pure CR emission (note that matches well the BeppoSAX photon index ). Any SR emitted close to the surface would have a broken power-law shape with within the X-ray range, in clear disagreement with the BeppoSAX data. The slope of the CR component does not depend on the viewing angle as long as the line of sight misses the SR component, (which is concentrated around ), ie. as long as (see Woźna et al., this volume).
Furthermore, owing to the off-beam geometry the high energy cutoff in the total spectrum (which now consists of just a CR component) occurs at a relatively low photon energy of MeV. The cutoff is not caused by magnetic absorption – it corresponds to a maximum energy of those electrons which emit observable CR. This is why the cutoff’s shape can easily mimic the very soft spectral shape as suggested by the two EGRET points (Fig. 2). Harding & Zhang used similar viewing geometry arguments to explain the very soft spectra of unidentified EGRET sources.
However, with the off-beam CR spectrum normalized to reproduce the level of the EGRET emission, the BeppoSAX data points are located about 3 orders of magnitude above the extrapolated level of the CR component (thick line in Fig. 2). The intrinsically hard shape of the off-beam spectrum results in too low ratio of X-ray level to gamma-ray level of emission. In our opinion it is not possible to solve this problem within the standard polar cap model.
3 Can the secondary pairs emit CR photons within the keV range?
In order to explain the BeppoSAX data we propose a contribution of CR from secondary pairs accelerated within the polar gap. Upon the acceleration energy of the pairs should reach values in the range between and . For the CR energy loss length scale considerably exceedes the size of magnetosphere (). The pairs do not suffer thus considerable energy losses and at all altitudes emit roughly the same spectrum of CR. In Fig. 2 it is shown as a thin solid line (we took ).
The level of CR spectrum at energies below the characteristic energy does not depend on , but solely on the radius of curvature of magnetic field lines . Since the pairs follow nearly the same field lines as the primary electrons, the ratio betwen the level of BeppoSAX data points (diamonds in Fig. 2) and the level of X-ray emision from primary electrons (thick solid line) is a direct measure of the number of pairs per single primary electron required to reproduce the level of the X-ray data. The level of the primary CR spectrum (thick solid line) within the BeppoSAX range can be determined by fitting the high-energy cutoff of the spectrum to the EGRET data points. Apart from , the same fit could also determine the value of , because the shape of the cutoff depends on the viewing angle.ccc Because of the near alignment of the magnetic dipole, the value of cannot be well determined from radio polarisation data on J02184232 (Stairs et al.), however, the EGRET data do not allow to determine and with high accuracy. ”By eye” fits give of at least a few hundred; for (Fig. 2), .
Thus, to reproduce the broad-band high-energy spectrum of J02184232, at least a few hundred of pairs should acquire an energy roughly equal to of primary electron energy. According to most works on the physics of the pair formation front (eg. Harding & Muslimov ) acceleration of such a large number of pairs within the polar gap is difficult, because redistribution of the pairs screens out the electric field of the polar gap. However, existing works on the physics of the polar gap neglect the fact that the pairs are created at different magnetic field lines than those along which parent primary electrons propagate. Because of this 1D-approach as well as plenty of other approximations our present knowledge of processes at the pair formation front is far from being well established.
Because of the bimodal energy distribution of radiating charges (primary electrons, secondary pairs), the CR spectral components which correspond to them are separated by a dip. A precise shape of this dip would depend on the shape of high-energy cutoff in the energy distribution of pairs and the dip may extend in principle between keV and MeV (dashed line in Fig. 2 suggests a possible situation).
4 What is the energy spread among primary electrons?
One of popular assumptions present in polar cap models is that all primary electrons accelerated within the gap acquire roughly the same energy. This is not realistic because the potential drop across the polar cap depends on magnetic colatitude: it decreases towards the rim of the polar cap (eg. , ). Moreover, stochastic energy losses caused by resonant Compton scatterings may significantly soften the energy spectrum of primary electrons provided the surface temperature and the magnetic field are sufficiently high (see fig.4 in paper ). In the case of weak- millisecond pulsars the latter mechanism is not efficient because the energy loss rate due to the resonant ICS () is low. However, no calculations of primary electron energy distribution have been performed so far for very high temperatures in excess of K – a value considered for J02184232.
Suppose that the primary electrons assume the steady-state energy distribution in a form of a power law extending down to . Then, the resulting CR spectrum could easily reproduce both the observed slopes and levels of X-ray and gamma-ray emission for appropriate values of and . It would have a broken power law shape with within the BeppoSAX range, and above a break somewhere between 10 keV and 100 MeV (the exact value of the break energy ). Again, if primary electrons really achieved in excess of in the polar gap of millisecond pulsars, the agreement of the model spectrum with EGRET data points could be easily achieved only by a proper choice of the viewing angle for the off-beam geometry. There would be no dip in the spectrum and a measure of and would give us direct information about and , respectively. BeppoSAX data points and COMPTEL upper limits constrain to the range between and which corresponds to rather soft electron energy distribution with the index and with the low energy cutoff at .
5 High-altitude synchrotron emission
In the case when the synchrotron radiation (SR) is emitted close to the neutron star surface, its spectrum extends down to a blue-shifted local cyclotron energy with (RD99). For high-altitude emission, however, the cooling length scale due to SR can become longer than the length scale of decrease in . Simple calculations show that this may happen for a local magnetic field G. For PSR J02184232 such a field is expected at .
In the case of SR in such a low , electrons do not loose their entire energy corresponding to their motion across . In consequence, a new break appears in the SR spectrum, at photon energy greater than (Chang et al.). Below the break, the photon index assumes the value , characteristic for instantaneous spectrum of SR (or CR) emission.
Fig. 3 shows that such a kind of spectrum is also able to reproduce the high-energy data on J02184232. Between the BeppoSAX and EGRET range the SR spectrum has a well known slope of , and its flux level is about 10 times below the upper limits from OSSE and COMPTEL. This SR spectrum was calculated within the following simplified model: The electrons were injected at a distance of from a neutron star, with initial energy and were propagated radially up to with a constant value of (ie. constant pitch angle during the SR emission was asumed). Viewing geometry effects were not taken into account in these simple calculations but the lack of strong GeV emission from J02184232 again implies the off-beam case. The agreement between the data and the model spectrum of SR shown in Fig. 3 is remarkable, however, the emission of 100 MeV synchrotron photons close to the light cylinder requires very high energy of primary electrons near : (, ). Various mechanisms of acquiring in the outer parts of magnetosphere have been considered so far within the polar cap model (eg. Malov & Machabeli ) but they usually concerned the optical emission from pulsars.

6 Conclusions
The combined X-ray and gamma-ray data on the millisecond pulsar J02184232 impose severe limitations on possible radiation mechanisms, energy spectrum of radiating charges as well as viewing geometry. The standard polar cap model is not able to explain the spectrum of J02184232 even when viewing geometry effects are taken into account. We find three possible interpretations which require non-orthodox assumptions about the electron energy distribution or emission altitude. The spectra corresponding to these possiblities have unique features (the MeV dip or the characteristic slope of SR) which may enable to identify them with a high-sensitivity and high-angular resolution gamma-ray telescope (INTEGRAL?).
Acknowledgments
We thank W. Hermsen and L. Kuiper for numerous discussions on J02184232. BR acknowledges warm hospitality in SRON (Utrecht) where this project was started. JD acknowledges Young Resercher Scholarship of Foundation for Polish Science. This work was supported by KBN grants 2P03D 02117 and 5P03D 02420.
References
References
- [1] T. Bulik et al, MNRAS 317, 97 (2000)
- [2] H.-K. Chang et al, Astrophysical Letters & Communications 38, 53 (1999)
- [3] J. Dyks and B. Rudak, A&A 362, 1004 (2000)
- [4] J. Dyks and B. Rudak, A&A 360, 263 (2000)
- [5] J. Dyks et al. in Proc. of the 4th INTEGRAL Worshop, ESA SP 459, 191 (2001)
- [6] I. Grenier and C. Perrot, AIP Conference Proceedings 587, 649 (2001)
- [7] A.K. Harding and B. Zhang, ApJ 548, L37 (2001)
- [8] A.K. Harding and A.G. Muslimov, ApJ 556, 987 (2001)
- [9] L. Kuiper et al, A&A 359, 615 (2000)
- [10] I.F. Malov and G.Z. Machabeli, ApJ 554, 587 (2001)
- [11] T. Mineo et al, A&A 355, 1053 (2000)
- [12] B. Rudak and J. Dyks, MNRAS 303, 477 (2000) (RD99)
- [13] I.H. Stairs et al, ApJSS 123, 627 (1999)
- [14] F. Verbunt et al, A&A 311, L9 (1996)