Inflation, cold dark matter, and the central density problem
Abstract
The lingering problem with high central densities in dark halos has arisen in the context of (L)CDM cosmologies with scale-invariant initial power spectra. Although is often justified by appealing to the inflation scenario, the choice is not generally justified. Specifically, inflation models with mild but important deviations from scale invariance () are not uncommon, and those with significant “running” of the spectral index are quite plausible. Even a mild deviation from scale invariance can be important because halo collapse times and densities depend on the relative amount of small-scale power. Here, we choose several popular, often well-motivated, models of inflation and work out the ramifications for galaxy central densities. For each model, we calculate its COBE-normalized primordial power spectrum and deduce the implied halo densities using a semi-analytic method calibrated against N-body simulations. We compare our predictions to a sample of dark matter-dominated galaxies using a non-parametric measure of the density, , defined as the mean mass density, relative to the critical density, within the radius at which the rotation curve falls to half of its maximum value. While standard LCDM halos are overdense by a factor of , several of our example inflation+CDM models predict halo densities well within, and even below, the range preferred by observations. We also show how the presence of massive ( eV) neutrinos can help to alleviate the central density problem, even with a scale invariant spectrum. We conclude that galaxy central densities may not be as problematic for the CDM paradigm as is sometimes assumed: rather than telling us something about the nature of dark matter, galaxy rotation curves may be telling us something about inflation and/or neutrinos. An important test of this idea will be an eventual consensus on the value of , the rms overdensity on the scale Mpc. Our successful models tend to have values of , which is well within the range of recent determinations. Finally, models with (or ) are highly disfavored.
pacs:
98.80.-k, 98.35.Gi, 98.62.Gq, 98.80.Es, 98.80.Cq, 14.60.PqI Introduction
The standard model of structure formation (LCDM) is one in which the universe is dominated by cold, collisionless dark matter (CDM), made flat by a cosmological constant (), and endowed with initial density perturbations via quantum fluctuations during inflation BFPR . Although the need for the cosmological constant component is unexpected, the CDM+inflation paradigm is strongly motivated, and with the parameter choices , , LCDM can account for an impressive range of astronomical observations on large scales. However, on galactic scales, this model faces some potentially ruinous difficulties. Perhaps the most troubling of these problems are the indications that the central regions of galaxies are noticeably less dense than the favored LCDM model typically predicts first ; cden ; B95 ; dslope ; MQGSL99 ; ABW01 ; BMR01 ; BB02 ; keeton . In this paper we suggest that these observations might be telling us something fundamental about the epoch of inflation, and also explore how massive neutrinos affect halo densities.
There are two related but distinct facets of the central density problem. The first problem concerns the fact that the integrated mass densities within well-defined central radii of observed galaxies (see Sec. IV.2) seem to be a factor of larger than the central densities predicted by standard LCDM cden ; ABW01 ; keeton . The second, often referred to as the “cuspy halo problem,” highlights the fact that CDM halo density profiles are predicted to diverge at small r (), while galaxy rotation curves are often better fit with constant density cores first ; dslope ; B95 ; MQGSL99 ; BMR01 ; BB02 . While the second of these issues has received the most attention, it is often degenerate with the first problem and is somewhat more controversial. For example, de Blok and collaborators BB02 have argued that their sample of low-surface brightness galaxies favor fits to density profiles with a constant density central “core” over those with cusps; however, van den Bosch and Swaters argue that a majority of galactic rotation curves are acceptably fit by divergent profiles as long as they are much less centrally concentrated than typical halos in standard LCDM vdBS . Furthermore, all observational errors (e.g., slit offset) tend to favor constant apparent central density over cusps. At present, it is not clear that the cuspy halo problem presents a serious challenge to LCDM, although it appears that the data do prefer halos that are less centrally concentrated than typical halos in the standard LCDM model.
The problems with central densities have triggered a growing concern that we are missing something fundamental in our understanding of galaxy formation. (This is in spite of the fact that some of the problematic claims are disputed vdBS ; KZS ; Jimenez ; lowenstein ; rines .) Solutions to the problems range from those that use baryonic physics KZS ; navarro ; katz ; dekel ; Bullock01 ; wechsler to those that rely on altering the nature of the dark matter SIDM ; SFDM ; wdm ; LHZB ; BKW . While the astrophysical solutions are reasonably well-motivated, the fact that problems seem to exist for relatively small, dark matter-dominated dwarf galaxies all the way to large ellipticals suggests that a single baryonic solution may not be able to address all of our concerns. The altered dark matter solutions, on the other hand, could possibly be made to match the range of observations, but only by invoking unmotivated or fine-tuned candidates (there is no well-motivated warm dark matter candidate).
Our inflation-derived solution is nonastrophysical but works entirely within the desirable tenets of the CDM paradigm. This paper is conservative in that it concentrates on the integrated density within some well-defined radius, which is certainly more robustly determined in simulated halos than the central slope of the density profile. As we shall discuss below, the same is likely true for observed galaxies.
Our work is principally inspired by Alam, Bullock, and Weinberg ABW01 who suggested that the central density problem would be reduced significantly in LCDM if the initial inflationary power spectrum were tilted to favor large scales. The term “tilted” is defined in terms of the primordial power spectrum of density fluctuations, which we assume over some range in wave number can be written as , corresponding to a mass variance per logarithmic interval of . Tilted power spectra refer to those with . In “standard” LCDM, it is assumed that is exactly , corresponding to a scale invariant, Harrison-Zel’dovich primordial power spectrum. This choice is often justified by the tendency for inflation models to predict nearly scale invariant spectra; however, generic models of inflation do not predict primordial power spectra that are exactly scale invariant. As we discuss below, the central densities of dark halos are extremely sensitive to the amount of small-scale power and hence small deviations from scale invariance can be very important.
Our aim is to compute the predicted primordial for several example inflation models and apply these results to the question of galaxy central densities and concentrations. Although similar in spirit to the agenda of Kamionkowski and Liddle KL00 , who suggested that the small-scale crisis might reflect a sharp feature in the inflationary power spectrum (see Sec. II.3), our mind-set is to look at models that are not particularly fine-tuned. We simply choose fairly representative, simple, single field inflationary models and we examine a range of predicted power spectra, even one with with a “blue” initial spectrum (). In the context of slow roll inflation, models that predict significant tilt generally yield effective spectral indices that are strongly scale-dependent or exhibit significant “running” of the spectral index. Consequently, when comparing observational data that span a wide range of scales ( in this case) it makes sense to account for the variation of with scale in addition to the so-called “tilt” of the spectrum. We account for the running of the spectral index by calculating it in specific inflationary models and show that the running can have an important effect on structure on galactic scales. We also estimate the effect of a “hot dark matter” component in the form of massive neutrinos on the central densities of dark matter halos. We make our estimates for halo densities using a semi-analytic model normalized against N-body simulations. The model relies on our, now well-founded, understanding that halo central densities are determined by their collapse histories wechsler .
Although we examine models with varying amounts of small-scale power, we are not free to alter the spectrum by an arbitrary amount. The amplitude of power on small ( h-1 Mpc ) scales is often quantified in terms of , which is the rms overdensity smoothed with a top-hat filter of radius h-1 Mpc . Observationally, this quantity can be determined in a number of ways including techniques that rely on the abundance of rich x-ray clusters, the cosmic shear from weak gravitational lensing, and galactic peculiar velocity flows. However, these estimates do not converge on a definitive value (even when the same method is used by different authors) and many recent estimates seem to advocate surprisingly low values of MSVNL ; SIG8 . Roughly speaking, recent estimates yield values that span the range for . In the following, we will only consider models with because models with a smaller do not have a good chance of being able to match observations. We acknowledge that even this limit is pushing the observational bounds (although it is consistent with Ref. MSVNL ) but we feel that it is best to explore all possibilities for the sake of alleviating the tension between theory and observation on subgalactic scales. For reference, a scale invariant spectrum (i.e., with spectral index ) that is normalized to the Cosmic Background Explorer (COBE) measurements COBE of the large-scale cosmic microwave background (CMB) anisotropy via the fitting forms of Bunn, Liddle, and White BLW , has assuming that the gravitational wave contribution is negliglible.
The remainder of this paper is organized as follows. In Sec. II we introduce several models of inflation and calculate the power spectra predicted by each model. We give a short description of the effects of massive neutrinos on the evolved linear power spectrum in Sec. III. We discuss the properties of dark matter halos and describe our semi-analytic model for estimating halo central densities in Sec. IV. In Sec. V we present our results and compare them with the observed central densities of dwarf and low surface brightness (LSB) galaxies. Lastly, we summarize our conclusions and indicate directions for future work in Sec. VI.
Throughout this work we will assume , , , and .
II Inflationary Power Spectra
It is widely believed that the primordial density perturbations that led to the growth of structure in the Universe were produced during inflation: quantum fluctuations in the inflaton field were frozen in as the rapid cosmological expansion stretched these fluctuations to length scales larger than the horizon. The power spectrum of primordial perturbations can be calculated via the slow roll approximation (for a review, see Ref. LR99 and references therein). The standard calculation, to lowest order in slow roll, yields expressions for the spectrum of density perturbations at horizon crossing,
| (1) |
and the effective spectral index of the primordial spectrum,
| (2) |
in terms of the inflaton potential (, ) and the slow roll parameters and . The reduced Planck mass is defined in terms of Newton’s constant as GeV and, as usual, these expressions are to be evaluated at horizon crossing (i.e., when ).
In the limit of exact de Sitter space during inflation, the predicted primordial power spectrum would approach exact scale invariance; however, any model in which a scalar field is slowly rolling towards a minimum of its potential will predict some deviation from . Of course, in the context of some inflationary models, the deviation is quite small, and scale invariance is a reasonable approximation. One frequently cited example of this sort is power-law inflation, for which there is an exact solution AW84 . The reason why approximate scale invariance is expected in this model has to do with estimates of the gravitational wave contribution to the CMB quadrupole. In addition to scalar density fluctuations, inflation also produces tensor (gravity wave) fluctuations. In the power-law inflation case, the ratio of the tensor to scalar contribution to the CMB quadrupole, , increases with the tilt as . A similar result also applies to chaotic inflation models (e.g., Ref. Linde83 ) because in these models. Recent CMB measurements indicate that the tensor contribution is small ( WTZ01 ; Hann01 ) so power-law inflation requires .
However, this case does not exemplify general inflationary predictions. Tensor perturbations can be negligible even if the tilt is not. This is because the tensor wave amplitude depends only on the energy scale of inflation. The gravity wave contribution is negligible if the inflaton field remains far below the Planck scale, as would be expected in well-motivated models such as the running-mass case discussed below. Models meeting this requirement can naturally produce modest tilts and spectral index running. Moreover, there are reasonably well-motivated cases that can yield dramatic departures from scale invariance.
In the balance of this section, we briefly outline the predictions of several models of inflation that lead to deviations from the standard , scale invariant primordial spectrum and present the linear power spectra in each case. Included in this set of models is a more extreme example that exhibits so-called “broken scale invariance” and for which the slow roll approximation cannot be used. In all other cases, we calculate the primordial power spectrum to second order in slow roll using the method of Stewart and Gong SG01 which is sufficiently accurate for our purposes GL96 . In this way, we take into account both the tilt of the power spectrum and the running of the spectral index.
To derive the low-redshift power spectra, we use the fitting form for the transfer function given by Eisenstein and Hu EH99 and the exact relation for the linear growth factor in flat cosmologies with a cosmological constant given by Bildhauer, Buchert, and Kasai BBK92 . In all cases we normalize the power spectrum to COBE using the fitting functions of Bunn, Liddle and White BLW . We consider several models in which the effective spectral index varies significantly with scale. In these cases, we follow the prescription of Ref. BLW and evaluate the normalization at the scale h Mpc-1, which is approximately the pivot scale of the COBE data, using the effective spectral index at that scale, .
II.1 Inverted power law potentials
We begin with the illustrative example of the inverted power law (IPL) potential (or “small field polynomial” in the language of Ref. Hann01 ) which has the basic characteristics of “new inflation” ST84 . The general form is
| (3) |
with . This potential implies that the effective spectral index of the primordial power spectrum on the scale is given by
| (4) |
where is the number of e-folds of inflation that occur between the epoch when the scale leaves the horizon and the end of inflation. We can obtain a rough estimate of in terms of the energy density at reheating, , the value of the inflaton potential when leaves the horizon, , and the value of the inflaton potential at the end of inflation, , by assuming instantaneous transitions between vacuum domination and matter domination at the end of inflation and matter domination and radiation domination at reheating. This gives
| (5) |
If the details of the end of inflation and the process of reheating were known, would be known precisely; however, these details are not known. In order to obtain definite predictions, we take which is a fairly standard working hypothesis. Using this in Eq. (4), we see that with (we refer to this model as IPL4) this model predicts mild deviation from scale invariance, namely . Accordingly, the spectral index is mildly scale-dependent, . Figure 1 depicts a typical power spectrum at with the choice . Rather than or , we plot the rms overdensity on a given mass scale , because this is the relevant quantity for our subsequent calculations. The COBE normalization amounts to choosing a suitable combination of and and the effective spectral index is insensitive to this choice. Normalized to COBE, this model predicts a perfectly acceptable value of .111The length scale h-1 Mpc corresponds to a mass scale of h-1 under the assumption that .
Before proceeding, we mention that the particle physics motivation for this type of potential may be somewhat dubious. In particular, if , COBE normalization requires the dimensionless coupling constant to be of order (the fine-tuning problem may be obviated by considering the coupling to be a parameter of an effective field theory rather than a fundamental parameter) LR99 . Nevertheless, we consider this to be a good illustrative example because it is simple and has the general behavior that is exhibited by a wide variety of models including many specific incarnations of new inflation ST84 , hybrid inflation and mutated hybrid inflation Stewart95 , as well as models with a variable gravitational constant SBB89 . In addition, this potential mimics the potential encountered in a particular variation of mutated hybrid inflation known as “smooth” hybrid inflation LPV96 .
II.2 Running-mass model
Stewart has proposed a model in which the need to fine-tune the inflaton mass in order for inflation to occur in the context of supergravity is eliminated by a “flattening” of the effective inflaton potential due to loop corrections Stewart97 . This provides a natural mechanism for generating a potential that gives rise to inflation. Interestingly, the resulting effective potential can lead to a spectral index considerably different from and with a significant scale dependence. In this model it is assumed that in the sector of the inflaton field, supersymmetry is broken explicitly during inflation and the scalar fields have soft supersymmetry-breaking mass terms as would generally be the case. Through couplings to fields with soft supersymmetry-breaking masses, the scalar field masses may get important renormalization corrections. The one-loop correction to the inflaton potential then gives an effective potential with a running inflaton mass,
| (6) |
where the ellipsis represents nonrenormalizable terms that become important at the Planck scale. The value of is tied to the scale of the supersymmetry breaking during inflation, .
This type of model has been discussed extensively by Covi, Lyth and Roszkowski CLR99 and Covi and Lyth CL99 who derived cosmic microwave background constraints on such models. Inflation occurs in the vicinity of an extremum of the potential and the established blueprint for analyzing inflation in the context of this model is to assume that can be approximated by a function that is linear in while cosmological scales are leaving the horizon Stewart97 ; CLR99 ; CL99 . In the notation of Refs. CLR99 ; CL99 , the effective potential is then written as in Eq. (6) with and the spectral index in this case is given by
| (7) |
where is chosen such that and and are parameters that may be either positive or negative and we generally expect that CLR99 ; CL99 . With and , we have the particularly interesting case that and decreases with increasing . With and , and decreases with scale. We use such a model in several places to illustrate the predictions of a model with a primordial power spectrum that has . For reasonable parameter choices there may be a significant tilt and the scale dependence may be as strong as on cosmologically interesting scales. The significant running of the tilt is not surprising. As we stated earlier, in the context of slow roll inflation, models with significant tilts typically exhibit strong variation of with scale. The COBE normalization is related to the parameters and . In each case we make physically reasonable choices of these parameters to enforce the COBE normalization (see Ref. CL99 ). The shape of the spectrum is relatively insensitive to these choices. We choose this model as a simple example of an inflationary model that may naturally predict significant deviations from and running of the spectral index.
In Fig. 1 we show present-day, linear power spectra for two particular choices of parameters. The model with (RM ) has parameter choices and , resulting in and , and is shown largely for illustration (note that in this case a hybrid mechanism is necessary to end inflation). The more interesting case with (RM ) has parameter choices and . For this model, and which is consistent with constraints on tilt from various analyses of CMB, large-scale structure and Ly forest data WTZ01 ; Hann01 . For this model which is on the low side of our acceptable range.
II.3 Spectra with broken scale invariance
In contrast with the above models, there may be a feature at some scale in the inflationary potential that causes the power to drop abruptly. This possibility leads us to consider models with so-called “broken scale invariant” (BSI) spectra. In these models, there is a critical scale , and for and the primordial power spectrum has an effective power law index . However, on scales near the critical scale the amplitude of the initial density perturbations changes abruptly so that the power on scales can be significantly less than that on scales . This type of spectrum may arise in models in which more than one field plays an important role in inflation while cosmological scales are leaving the horizon multifield but placing the scale in an observationally interesting range usually introduces a fine-tuning issue.
As an idealized case of BSI, Starobinsky derived an analytic expression for the primordial power spectrum in a model where the inflaton potential has a step discontinuity in its first derivative (cf. Eq. [1)] Starobinsky92 . This is a useful model to study for two reasons. First, the primordial power spectrum can be written in a relatively simple closed form. Second, and more material, this model exhibits the most rapid drop in power possible in a single field model of inflation KL00 . Lesgourgues, Polarski and Starobinsky LPS98 investigated using primordial power spectra of this type to explain a feature on scales of about h-1 Mpc in the galaxy power spectrum measured by the Automatic Plate-measuring Machine survey GB98 (such a feature is not present in more recent determinations of the galaxy power spectrum) while Kamionkowski and Liddle KL00 explored the effects of such a primordial spectrum on the typical abundance of dwarf satellites.
In this scenario, the power spectrum of density perturbations , prior to being modified by causal physical processes, is given by the following exact relation Starobinsky92 :
| (8) |
where , , and is the ratio of the amplitude of fluctuations on scales to the amplitude of fluctuations on scales . In this model, we are free to choose the amplitude of primordial tensor perturbations and we assume that they are negligible. The normalization is according to the COBE data. Inspired by the work of Kamionkowski and Liddle KL00 , we choose and h Mpc-1 in order to suppress power on mass scales h-1 and thereby alleviate the dwarf satellite problem (note that we have chosen a different than Kamionkowski and Liddle KL00 , partly because we assume a different cosmological model). The dotted line in Fig. 1 shows the , linear power spectrum predicted by this model. As there is a rise in power prior to the cutoff at h-1 (see Fig. 1), we find that which is slightly larger than the value in a scale invariant model.

III Massive Neutrinos
A preponderance of evidence from solar and atmospheric neutrino oscillation experiments like Super-Kamiokande SK , the Sudbury Neutrino Observatory SNO , the Russian-American Gallium Experiment SAGE , the Gallium Neutrino Observatory GNO , the Gallium Experiment GALLEX , and the Soudan Experiment SOUDAN seems to imply that neutrinos are indeed massive. Yet these experiments cannot determine the absolute magnitude of the neutrino masses and it may be that the masses are large enough to have significant cosmological implications. If massive neutrinos (or other “hot dark matter” particles) make up a non-negligible portion of the dark matter, the effect of their free-streaming will be to reduce power relative to the standard model on small length scales. This situation is commonly referred to as the cold+hot dark matter scenario primack .
It is easy to estimate the scale at which this effect becomes important. Massive neutrinos will move at a speed over order until they become nonrelativistic when which occurs at a redshift of and we expect power to be suppressed on scales smaller than the horizon scale at redshift . As such, a rough estimate is that power will be damped on all scales where
| (9) |
This corresponds to suppression of power on mass scales h-1 . The contribution of massive, light ( MeV) neutrinos to the mean matter density, relative to the critical density, is . On scales , the fractional suppression of power due to massive neutrinos approaches a value of MBDGS .
This modification to the power spectrum on small scales has been studied in detail by many authors (e.g., Refs. MBDGS ; EH99 ). In fact, the current best bounds on neutrino masses come from demanding consistency of the power spectrum on scales probed by COBE and the smaller scales probed by clusters FLS00 and the Ly forest CHD99 or from the shape of the observed galaxy power spectrum on scales 2DF02 . Roughly speaking, these cosmological bounds dictate that three nearly mass-degenerate neutrinos must have eV primack while direct bounds on the electron neutrino mass from tritium decay experiments give eV TRIT .
In what follows, we study the effect of the suppression of small-scale power by three neutrinos with effectively degenerate masses eV on the central densities of dark matter halos. As was pointed out in Ref. FLS00 , excessively large neutrino masses lead to unacceptably low values of . Our strategy is to fix and and to ascertain whether or not a neutrino mass that saturates our lower limit of can alleviate the central densities problem associated with the CDM paradigm. For this cosmology, the lower limit on is saturated by a neutrino with eV. For comparison, we also report results for a model with eV which has . We show in Fig. 2, the present-day linear power spectra of the scale invariant reference model and the two models with massive neutrinos. Notice the suppression of power on all relevant mass scales.

IV The Central Densities of Dark Matter Halos
IV.1 Describing dark matter halos
The absolute size of a virialized dark matter halo can be described by the virial mass , or equivalently the virial radius , or the virial velocity . The virial radius of a halo is defined as the radius within which the mean density is equal to the virial overdensity , times the mean matter density of the Universe, . Thus and are related by
| (10) |
The virial overdensity is set by the spherical top-hat collapse approximation and for flat cosmologies the value of at redshift can be approximated by BN98
| (11) |
where . With and , at .
Several analytic density profiles for dark matter halos have been proposed as good approximations to the results of high-resolution N-body simulations and all agree at large radii. Moore et al. MQGSL99 found that the density in the central region of the halo varies as and so proposed the density profile
| (12) |
while Navarro, Frenk, and White NFW (hereafter NFW) found that density in the central regions of halos varies as and have therefore proposed the profile
| (13) |
In most of what follows, we will assume an NFW profile. For the NFW profile the two parameters are related by . If N-body simulations do predict profiles somewhere between the and , the behaviors of the NFW and Moore profiles respectively, then the NFW profile is a conservative choice in the sense that Moore profiles predict more centrally concentrated halos ABW01 . NFW profiles can more easily match the data and require less drastic modifications of the standard paradigm in order to do so.
A useful criterion for assessing the relative central concentration of a halo is the concentration parameter
| (14) |
Although this quantity is defined explicitly in terms of a parameter of the NFW profile, viz. , there is no significant loss of generality because we can identify with the point at which and thereby relate these results to the results obtained using another density profile Bullock01 . Restating the NFW profile as a velocity curve gives
| (15) |
with and . The maximum velocity is given by
| (16) |
and occurs at a radius .
A more directly observable measure of halo central densities has been proposed by Alam, Bullock, and Weinberg ABW01 . This quantity is known as the “central density parameter” and is defined as
| (17) |
or the mean dark matter density within the radius where the galaxy rotation curve goes to half of . In practical units, . Assuming an NFW profile, and the central density parameter is given by
| (18) |
There are distinct advantages to using to characterize the central densities of dark halos. For one, is more robustly determined, both observationally and in numerical data from N-body simulations, than is the inner slope of a density or velocity profile yet it probes scales small enough to betray the conflict between theory and observation. Moreover, is defined without reference to any particular density or velocity profile.
IV.2 Predicting halo central densities
To find the central densities of dark matter halos predicted by the aforementioned inflationary models, we make use of the semi-analytic model of Bullock et al. Bullock01 who were stimulated by the previous work of NFW NFW . This model has been calibrated to the results of high-resolution N-body simulations and although the model was developed in the context of scale invariant CDM power spectra, 222 The Bullock et al. model was shown to work well in predicting the redshift and mass dependence of halo profiles for a standard LCDM model, and also reproduces the results presented by NFW for standard CDM, open CDM, LCDM, and several power-law models Bullock01 . it was shown to work well in predicting the results of an LCDM simulation with , as discussed in Ref. ABW01 . This model represents an improvement over the previous NFW model because it reproduces the relationship between and observed in N-body simulations as a function of redshift whereas the NFW model fails at . It is important to realize however, that the following treatment is simplified and untested over the full range of power spectra we apply it to. Specifically, this model has not been tested against simulations with running spectral indices nor has it been tested against simulations with a significant hot dark matter component. Note, however, that halos formed within hot + cold dark matter simulations do seem to follow an NFW profile down to of the halo virial radius KKBP . Ideally, our results will motivate future work using N-body simulations in order to test our preliminary conclusions.
Briefly, the model of Bullock et al. Bullock01 (and NFW) embodies the fact that we expect the central densities of dark matter halos to reflect the mean density of the Universe at a time when the central region of the halo was accreting matter at a high rate wechsler . Therefore, we expect halos with central regions that collapsed earlier to be denser than their late-forming counterparts. Accordingly, our first step is to assign an epoch of collapse to a halo via the prescription that, at the collapse epoch , the typical collapsing mass, , is equal to some fixed fraction of the halo’s virial mass. Explicitly, we define
| (19) |
is the mass scale at which the rms density fluctuation is equal to the equivalent linear overdensity at collapse, . If is the rms overdensity on mass scale at redshift [we use with no redshift argument to denote as usual], then the collapse criterion can be written as . Notice that this definition of the epoch of collapse differs from that of NFW who defined the collapse epoch using the extended Press-Schechter formalism EPS . This is the key difference that gives the improved model the ability to trace the redshift dependence of the relationship. is a free parameter and Bullock et al. found that the model is in good agreement with the results of N-body simulations if Bullock01 . The small value of the parameter is not surprising. The densities that characterize the very central regions of halos are determined by the power on scales much smaller than the size of the halo, scales that broke away from the expansion at a much earlier time than the mass scale .
It is already evident that the central densities of dark matter halos will be very sensitive to on small scales and hence, to the slope of the primordial power spectrum or the presence of hot dark matter. At early times (but during matter domination), , and . Thus the epoch of collapse varies approximately as . If the central densities do, in fact, reflect the mean density of the Universe at the epoch of collapse then, roughly speaking, we expect so that a change in power by a factor of will lead to a change in central density by a factor [cf. Eq. (18) and Eq. (22) below].
The second step is to relate the mass density of the Universe at to a characteristic halo density today. Bullock et al. chose to use defined by
| (20) |
For an NFW profile, . Introducing the free parameter , we associate with the universal density at collapse via
| (22) |
Agreement with N-body simulations fixes . Bullock et al. and Wechsler et al. claim that the scatter in the relation is roughly while Jing has argued for a somewhat smaller scatter given by at JING .
With this model in place, we can use the linear power spectra of the previous two sections to predict and, more practically, and compare them with observation.
V Results
In this section we compare the predictions of the previous models with data on the rotation curves of dwarf galaxies and low surface brightness (LSB) galaxies. We concentrate our discussion on galaxies with both HI and H data or HI data that has been corrected for the effects of beam smearing. The data we use are taken from the recent works of Swaters S99 (mass modeling of these galaxies was performed by van den Bosch and Swaters vdBS ) de Blok, McGaugh and Rubin BMR01 and de Blok and Bosma BB02 who combined previous HI measurements S99 ; PHI with high-resolution H measurements. We use these data to derive observational estimates of for comparison with the theoretical predictions. For the data of de Blok and Bosma BB02 , we use their best fitting model for the dark matter distribution of each galaxy in the absence of baryons to derive estimates for . For the data of Swaters S99 and de Blok, McGaugh, and Rubin BMR01 , we fit the raw data to the velocity profile proposed by Kravtsov et al. KKBP ,
| (23) |
and use the best fitting models to estimate . The profile in Eq. (23) has the practical advantage that it parameterizes the sharpness of the transition between the two power laws at large and small radii. Hence the fitted value of the effective power law index at small radii is to some degree decoupled from the details of the rotation curve at . This added versatility makes it a very useful and accurate formula for describing observed rotation curves at small radii. Our estimates of are robust in that for most galaxies in the above samples, the inferred values of change by less than 40% if we instead fit the data with NFW, pseudoisothermal or Burkert B95 density profiles.333It is interesting that there is no systematic difference in the derived from one profile to the next. However, Moore profiles tend to fit the data more poorly, and give larger variation in the implied . This is similar to the result found by van den Bosch and Swaters vdBS . The robustness of the central density parameter is yet another advantage of using as a diagnostic of the central densities of dark matter halos.
Any comparison of the predictions of N-body simulations or semi-analytic calculations that model the behavior of CDM with data rests on some assumptions about the physics of baryon infall. In making this comparison, we believe that our methods are conservative in the sense that we likely overestimate based on the observational data in order to give the data every opportunity to match theoretical predictions (including the scale invariant “standard model”). First, we restrict ourselves to dwarf and LSB galaxies which are generally believed to be dominated by their dark matter components S99 ; BM97 . In so doing, we hope that any effects of baryonic infall are mitigated but recognize the fact that we may be introducing a heretofore unappreciated selection effect. Second, we calculate based on the full rotation curve without mass modeling or baryon subtraction. We therefore overestimate the central density of the primordial dark matter halo because the cooling and contraction of the baryons likely lead to contraction of the dark matter component as well (see Ref. first , although also see Ref. katz ). Third, the measured rotation curves of about 20% of the galaxies in the sample may not extend out to large enough radii for an accurate determination of and consequently may be significantly underestimated for several galaxies. In these cases, we simply take the last point in the rotation curve as an estimate of . By examining Eq. (17) it is easy to see that if with at small radii, an underestimation of by a factor leads to an overestimation of by a factor of (clearly, for , corresponding to a constant density core, the error cancels exactly). In other words, the error introduced has the net effect of bringing theory and observation closer together.
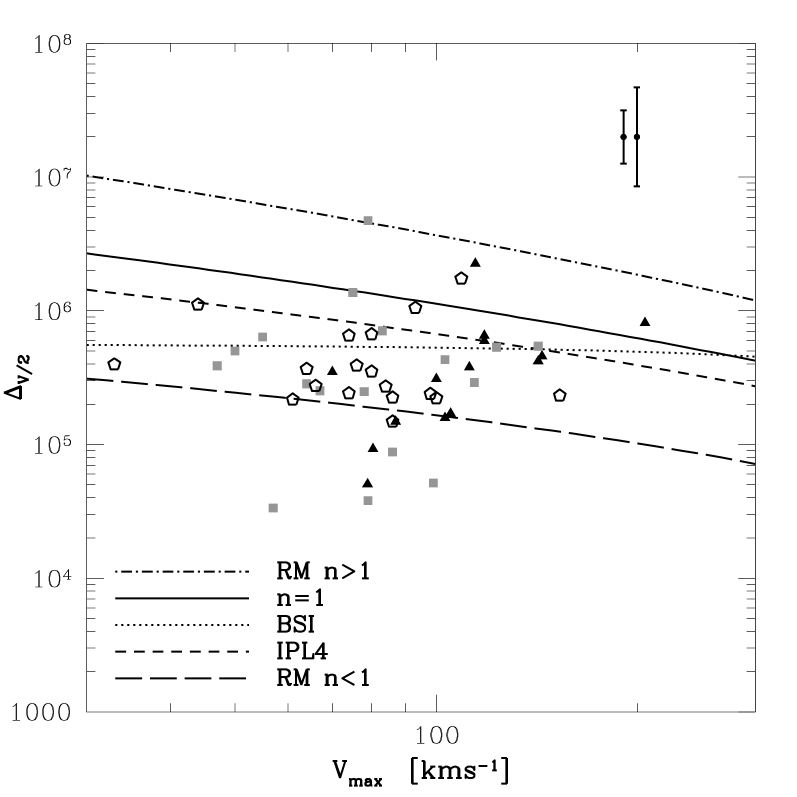
In Fig. 3, we show the theoretical predictions for the concentration parameter in the context of our inflationary models. Figure 4 shows the predictions in scenarios with massive neutrinos. Notice the wide swath of the plane that is carved out by the various models and, in particular, that can be reduced by a factor of two or more by adopting primordial power spectra predicted by reasonable models of inflation or by adding neutrino masses that are not ruled out by observation or experiment. Dark matter halos may be significantly less concentrated than standard LCDM plus scale invariance predicts.


Unfortunately, the relation is not directly observable and, what is more, it is defined in terms of a particular density profile. To connect theory with observations, we compare the quantity , as a measure of inner halo concentration, to as a measure of the absolute size of the halo. For an NFW profile, is related to through Eqs. (10) and (16).
The results of this comparison are shown in Figs. 5 and 6. First, consider the predictions of the various models of inflation. Although the agreement or disagreement of a particular model with the data is hard to quantify, it is not surprising that the running mass model with is effectively ruled out by the data. More interestingly, we find that in agreement with previous studies ABW01 , the scale invariant spectrum also has difficulty reproducing the observed galactic central densities. This is a restatement of the problem: if we are not preferentially selecting low density galaxies by restricting attention to low surface brightness and dwarf galaxies, then some additional physics is needed to reconcile the standard model of CDM plus scale invariant primordial spectrum with the observed central densities of dark matter-dominated galaxies. IPL4 does a somewhat better job of matching the data but the moderate tilt and spectral index running in this model are likely not sufficient to bring theory and observation together. For BSI, the agreement is much better but note that it is difficult to lower the theoretical values further by adjusting the parameters of the model. Increasing , the ratio of power on scales to power on scales , does not do much to help the BSI model come closer to matching the data because the fluctuation amplitude cannot drop quickly enough to produce a significant decrease in on scales of interest. Meanwhile, we cannot decrease much further without threatening the success of the standard model on large scales.
Notice that the running-mass model with (RM ) is a relatively good match to the median of the data in the plane (perhaps even undershooting the median). It is worth noting that this agreement has come without the need to saturate our lower bounds on spectral tilt from CMB and large scale structure (, see Refs. Hann01 ; WTZ01 ) or our lower limit on . The central densities of dark matter halos are very sensitive to the initial power spectrum and it seems as though the predicted central densities of dark matter halos in a LCDM cosmology may be reduced to acceptable levels by invoking simple and well-motivated models of inflation with and/or a running spectral index.
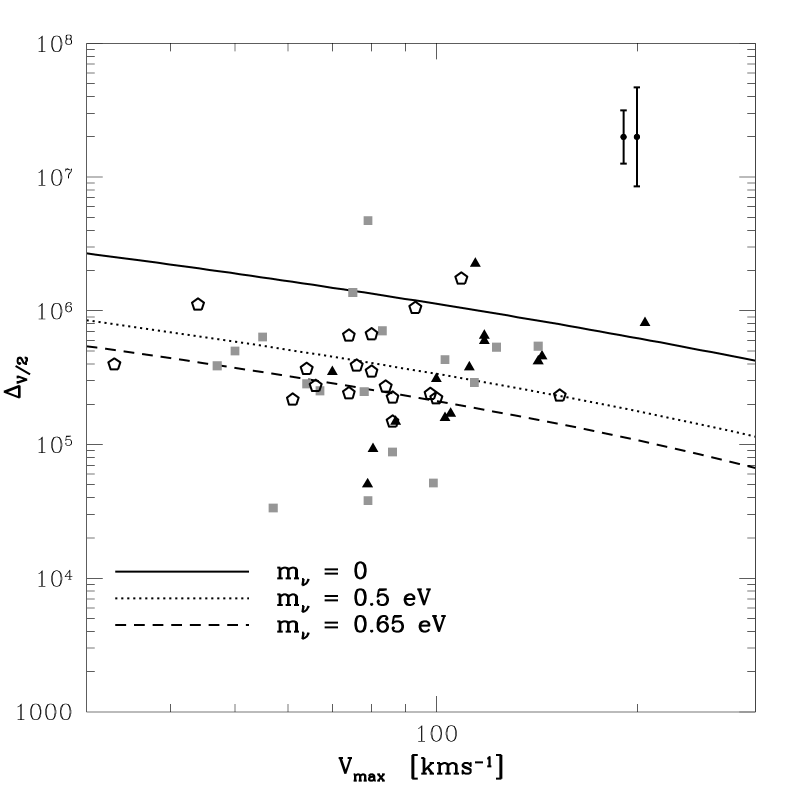
Likewise, in the case of massive neutrinos, we see that by saturating our lower bound on , we can reduce the predicted median value of to observationally acceptable levels. It seems that three massive neutrinos with can decrease small-scale power enough to provide a pretty good match to the values of inferred from rotation curve data.
VI Conclusions and Discussion
The central density problem is one of several difficulties confronting the standard paradigm of structure formation. In this paper we explored solutions that do not invoke uncertain baryonic physics but preserve the cold and collisionless properties of the dark matter. In Sec. V we showed that models of inflation that predict moderate, yet observationally acceptable tilts, , may provide an acceptable solution to the central density problem. These tilts are consistent with the latest constraints from joint analyses of CMB anisotropy, large-scale structure and Ly forest data Hann01 ; WTZ01 ; croft . Moreover, these tilts can be produced in well-motivated models of inflation. In fact, we worked in the context of specific models throughout this paper and in so doing, we were able to take into account the important effect of the running of the spectral index. To illustrate the importance of the running, we also considered a “tilted” model with no spectral running and (the effective tilt of the RM model on the COBE scale) and found that this model predicts central densities that are more than larger than the those predicted by the RM model over the range kms kms-1.
Given that precise measurements of the tilt of the power spectrum and the running of the spectral index using the data from the Sloan Digital Sky Survey SDSST (URL http://www.sdss.org/) and the Microwave Anisotropy Probe (URL http://map.gsfc.nasa.gov/index.html) are on the horizon EHT99 , it may be useful to adopt an empirical stance and consider the maximum tilt and running that are acceptable with respect to galactic central densities without linking the tilt and running through a particular inflationary model. As it is difficult to quantify the agreement or disagreement of a particular parameter choice with the data and because the current data certainly do not constrain the slope of the relationship between and , we adopt the somewhat arbitrary, but sensible, criterion that a model predicts unacceptably diffuse galaxies if at kms-1. Using the this criterion, we find that a lower limit on allowed as a function of can be approximated as
| (24) |
These maximally tilted models have for . If we adopt the criterion that a “good” fit to the data has at kms-1 then a good fit to the data is given approximately by
| (25) |
We also showed that massive neutrinos with eV eV may provide an alternative solution to the central density problem; however, we consider this solution rather less attractive. In order for neutrinos to solve the central density problem, it is necessary to nearly saturate our adopted lower limit on because, relative to the standard scale invariant model, the power spectrum is damped by a factor on scales smaller than (corresponding, roughly speaking, to ) whereas in the inflationary models, power falls off continuously with increasing wave number. The range of neutrino masses allowed by the above criterion that the dark matter halos not be too diffuse is eV, but as we mentioned earlier a neutrino mass greater than eV leads to unacceptably small values of . A neutrino mass of eV implies that .
We did not deal directly with the issue of central slopes. The problematic issue here is that cold (and warm) dark matter halo densities diverge at small radii whereas galactic rotation curves seem to be fit better with constant density cores first ; dslope ; B95 ; MQGSL99 ; BMR01 ; BB02 . While this is a worrisome situation, as we discussed above it is difficult to tell the degree to which this is a serious challenge to LCDM. First, all observational errors favor constant density cores over cusps. Second, while it has been observed that pseudoisothermal density profiles with constant density cores often fit galactic rotation curves better than NFW profiles cden ; BMR01 ; BB02 , the conclusion that observations indicate halos have cores rather than cusps is a nonsequitur. This is because all points on the curve contribute to the fit. Rotation curve fits are often largely determined by the transition region between the two power laws of the profile, and may not be faithful representations of the observed rotation curves at small radii (where there are relatively few data points). In addition, van den Bosch and Swaters showed that most rotation curves can be acceptably fit by divergent density profiles as long as the galaxies are much less centrally concentrated than standard LCDM predicts vdBS . To address the inner slope issue, it is probably more useful to use a fitting form similar to Eq. (23), despite the fact that it is not inspired by a theoretical model, because it “decouples” the two power laws of the model rotation curve. Our solution to the central density problem likely cannot solve the cuspy halo issue by itself because central cusps are more a reflection of the cold and collisionless properties of the dark matter than the amount of small-scale power (e.g., Ref. dekel ). Nonetheless, as we have already mentioned, the cuspy halo issue is to some degree degenerate with the central density problem and it may be that solving the latter problem may go a long way toward resolving the former.
A third problem associated with the standard LCDM paradigm is the dwarf satellite problem DSP . In essence, this problem can be stated in the following way: standard LCDM overpredicts the number of satellite halos with kms kms-1 by as much as an order of magnitude relative to the number of observed satellite galaxies in the local group. As we mentioned earlier, Kamionkowski and Liddle KL00 investigated solving this problem with BSI initial power spectra. It is probable that at least part of the solution lies in a feedback mechanism, like reionization suppression BKW . However, the degree of feedback needed will depend crucially on the input power spectrum. We examine the subhalo issue in the context of inflation in a forthcoming companion paper ZB2 . Briefly, we find that the discord between theory and observation can be greatly allayed by considering models similar to those studied here and thus, the feedback needed to meet observations can be greatly reduced or even eliminated.
Related to the dwarf satellite problem is the recent result of Dalal and Kochanek DK . The perturbing effect of substructure in strong gravitational lenses allowed them to constrain the fraction of the host halo mass bound up in substructure to be (90% confidence). They used this result to limit the tilt of the primordial spectrum and put constraints on the neutrino mass, and they obtained and eV at 95% confidence. Our results on substructure differ from those of Dalal and Kochanek. As we discuss in our forthcoming paper ZB2 , we find that for a host halo of the relevant mass, the total mass fraction in subhalos is typically larger than the lower limit of Dalal and Kochanek () even with significantly tilted primordial spectra, . Thus the tilt of the primordial power spectrum may not yet be significantly constrained by strong lensing results. However, as we have demonstrated here, the long “lever arm” from COBE scales to the subgalactic regime offers a potentially useful avenue for constraining models of inflation. Perhaps future lensing studies will provide more significant limits, and thus test the intriguing possibility that galaxy rotation curves are telling us something fundamental about the early universe.
Acknowledgements.
This work benefitted from useful conversations with David Caldwell, Savvas Koushiappas, Joel Primack, Stuart Raby, Gary Steigman, Terry Walker and David Weinberg and was inspired by an email correspondence with Steen Hansen. We are grateful to Rob Swaters for making his rotation curves available to us and providing us with a copy of his thesis work. We thank Leszek Roszkowski for directing us toward useful references. We thank Chris Power for pointing out an error in Eq. (18) in an earlier version of this work. We would also like to thank an anonymous referee for making several suggestions that improved the quality of this paper. We were supported by U.S. DOE Contract No. DE-FG02-91ER40690.References
- (1) G. R. Blumenthal, S. M. Faber, J. R. Primack, and M. J. Rees, Nature (London) 311, 517 (1984).
- (2) R. Flores and J. R. Primack, Astrophys. J. Lett. 427, L1 (1994); B. Moore, Nature (London) 370, 629 (1994).
- (3) V. P. Debattista and J. A. Sellwood, Astrophys. J. 543, 704 (2000); S. Côté, C. Carignan, and K. C. Freeman, Astron. J. 120, 3027 (2000); A. Borriello and P. Salucci, Mon. Not. R. Astron. Soc. 323, 285 (2001); J. J. Binney and N. W. Evans, Mon. Not. R. Astron. Soc. 327, 27 (2001); D. Marchesini, E. D’Onghia, G. Chincarini, C. Firmani, P. Conconi, E. Molinari, A. Zacchei, to appear in Astrophys. J. (2002), astro-ph/0202075.
- (4) S. M. K. Alam, J. S. Bullock, and D. H. Weinberg, to appear in Astrophys. J. (2002), astro-ph/0109392.
- (5) C. R. Keeton, Astrophys. J. 561, 46 (2001).
- (6) A. Burkert, Astrophys. J. Lett. 447, L25 (1995).
- (7) S. Blais-Ouellette, P. Amram, and C. Carignan, Astron. J. 121, 1952 (2001).
- (8) B. Moore, T. Quinn, F. Governato, J. Stadel, and G. Lake, Mon. Not. R. Astron. Soc. 310, 1147 (1999).
- (9) S. S. McGaugh, V. C. Rubin, and W. J. G. de Blok, Astron. J. 122, 2381 (2001); W. J. G. de Blok, S. S. McGaugh, and V. C. Rubin, Astron. J. 122, 2396 (2001); Rotation curve data available at http://www.atnf.csiro.au/people/edeblok/data/.
- (10) W. J. G. de Blok and A. A. Bosma, astro-ph/0201276 (2002).
- (11) F. C. van den Bosch and R. A. Swaters, Mon. Not. R. Astron. Soc. 325, 1017 (2001).
- (12) A. Klypin, H. Zhao, and R. S. Somerville, astro-ph/0110390.
- (13) R. Jimenez, L. Verde, and S. P. Oh, astro-ph/0201352.
- (14) M. Loewenstein and R. F. Mushotzky, submitted to Astrophys. J.
- (15) K. Rines, M. J. Geller, A. Diaferio, A. Mahdavi, J. J. Mohr, G. Wegner, astro-ph/0206226
- (16) J. F. Navarro, V. R. Eke, and C. S. Frenk, Mon. Not. R. Astron. Soc. 283, 72 (1996).
- (17) M. D. Weinberg and N. Katz, astro-ph/0110632.
- (18) A. Dekel and J. Devor, astro-ph/0204452
- (19) R. H. Wechsler, J. S. Bullock, J. R. Primack, A. V. Kravtsov, and A. Dekel, Astrophys. J. 568, 52 (2002); D. Zhao, H. Mo, Y. Jing, and G. Börner, astro-ph/0204108.
- (20) J. S. Bullock, T. S. Kolatt, Y. Sigad, R. S. Somerville, A. V. Kravtsov, A. A. Klypin, J. R. Primack, and A. Dekel, Mon. Not. R. Astron. Soc. 321, 559 (2001).
- (21) E. D. Carlson, M. E. Machacek, and L. J. Hall, Astrophys. J. 398, 43 (1992); D. N. Spergel and P. J. Steinhardt, Phys. Rev. Lett. 84, 3760 (2000); C. Firmani, E. D’Onghia, V. Avila-Reese, G. Chincarini, and X. Hernández, Mon. Not. R. Astron. Soc. 315, L29 (2000); M. Kaplinghat, L. Knox, and M. S. Turner, Phys. Rev. Lett. 85, 3335 (2000); C. Bento, O. Bertolami, R. Rosenfeld, L. Teodoro, Phys. Rev. D 62, 041302 (2000); R. N. Mohapatra and Vigdor L. Teplitz, Phys. Rev. D 62, 063506 (2000).
- (22) P. J. E. Peebles and A. Vilenkin, Phys. Rev. D, 60, 103506 (1999); W. Hu and P. J. E. Peebles, astro-ph/9910222; P. J. E. Peebles, Astrophys. J. Lett. 534, L127 (2000); T. Matos, F. S. Guzman, and L. A. Ureña-López, Class. Quantum Grav. 17, 1707 (2000); T. Matos and L. A. Ureña-López, Phys. Rev. D 63, 063506 (2001); J. E. Lidsey, T. Matos, and L. A. Ureña-López, to appear in Phys. Rev. D.
- (23) P. Colín, V. Avila-Reese, and O. Valenzuela, Astrophys. J. 539, 561 (2000); P. Bode, J. P. Ostriker, and N. Turok, Amer. Astron. Soc. 197, 7204 (2000); J. Sommer-Larsen and A. Dolgov, Astrophys. J. 551, 608 (2001); V. R. Eke, J. F. Navarro, and M. Steinmetz, Astrophys. J. 554, 114 (2001); J. J. Dalcanton and C. J. Hogan, Astrophys. J. 561, 35 (2001).
- (24) W. B. Lin, D. H. Huang, X. Zhang, and R. Brandenberger, Phys. Rev. Lett. 84, 954 (2001).
- (25) J. S. Bullock, A. V. Kravtsov, and D. H. Weinberg, Astrophys. J. 539, 517 (2000).
- (26) M. Kamionkowski and A. R. Liddle, Phys. Rev. Lett. 84, 4525, 2000.
- (27) A. Melchiorri and J. Silk, astro-ph/0203200; U. Seljak, astro-ph/0111362; P. T. P. Viana, R. C. Nichol, and A. R. Liddle, astro-ph/0111394; N. A. Bahcall et al., astro-ph/0205490.
- (28) D. Bacon, R. Massey, A. Refregier, and R. Ellis, astro-ph/0203134; L. Van Waerbeke, Y. Mellier, R. Pello, U.-L. Pen, H. J. McCracken, and B. Jain, astro-ph/0202503; H. Hoeckstra, H. K. C. Yee, M. D. Gladders, L. F. Barrientos, P. B. Hall, and L. Infante, astro-ph/0202285; O. Lahav et al., astro-ph/0112162; E. Pierpaoli, D. Scott, and M. White, Mon. Not. R. Astron. Soc. 325, 77 (2001); S. Borgani et al., Astrophys. J. 561, 13 (2001); L. Silberman, A. Dekel, A. Eldar, and I. Zehavi, Astrophys. J. 557, 102 (2001); Y. P. Jing, H. J. Mo, and G. Börner, Astrophys. J. 494, 1 (1998).
- (29) C. L. Bennett et al., Astrophys. J. Lett. 464, L1 (1994).
- (30) E. F. Bunn, A. R. Liddle, and M. White, Phys. Rev. D 54, 5917R (1996); E. F. Bunn and M. White, Astrophys. J. 480, 6 (1997).
- (31) J. E. Lidsey, A. R. Liddle, E. W. Kolb, E. J. Copeland, T. Barreiro, and M. Abney, Rev. Mod. Phys. 69, 373 (1997); D. H. Lyth and A. Riotto, Phys. Rep. 314, 1 (1999); A. R. Liddle and D. H. Lyth, Cosmological Inflation and Large-Scale Structure, (Cambridge University Press, Cambridge, 2000).
- (32) X. Wang, M. Tegmark, and M. Zaldarriaga, Phys. Rev. D 65, 123001 (2002).
- (33) S. Hannestad, S. H. Hansen, F. L. Villante, and A. J. S. Hamilton, Astropart. Phys. 17, 375 (2002).
- (34) L. F. Abbott and M. B. Wise, Nucl. Phys. B244, 541 (1984).
- (35) E. D. Stewart and J. O. Gong, Phys. Lett. B 510, 1 (2001).
- (36) S. M. Leach, A. R. Liddle, J. Martin, and D. J. Schwartz, astro-ph/0202244 (2002); I. J. Grivell and A. R. Liddle, Phys. Rev. D 54, 7191 (1996).
- (37) D. J. Eisenstein and W. Hu, Astrophys. J. 511, 5 (1999).
- (38) S. Bildhauer, T. Buchert, and Masumi Kasai, Astron. Astrophys. 263, 23 (1992).
- (39) P. J. Steinhardt and M. S. Turner, Phys. Rev. D 29, 2162 (1984).
- (40) A. D. Linde, Phys. Lett. B 129, 177 (1983).
- (41) E. D. Stewart, Phys. Lett. B 345, 414 (1995).
- (42) D. S. Salopek, J. R. Bond, and J. M. Bardeen, Phys. Rev. D 40, 1753 (1989).
- (43) G. Lazarides, C. Panagiotakopoulos, and N. D. Vlachos, Phys. Rev. D 54, 1369 (1996).
- (44) E. D. Stewart, Phys. Lett. B391, 34 (1997); E. D. Stewart, Phys. Rev. D 56, 2019 (1997).
- (45) L. Covi, D. H. Lyth, and L. Roszkowski, Phys. Rev. D 60, 023509 (1999).
- (46) L. Covi and D. H. Lyth, Phys. Rev. D 59, 063515 (1999).
- (47) R. C. A. Croft, D. H. Weinberg, M. Bolte, S. Burles, L. Hernquist, N. Katz, D. Kirkman, and D. Tytler, astro-ph/0012324; P. McDonald, J. Miralda-Escudé, M. Rauch, W. L. W. Sargent, T. A. Barlow, R. Cen, and J.P. Ostriker, Astrophys. J. 543, 1 (2000)
- (48) L. A. Kofman, A. D. Linde, and A. A. Starobinsky, Phys. Lett. B 157, 361 (1985); L. A. Kofman and A. D. Linde, Nucl. Phys. B282, 555 (1987); J. Silk and M. S. Turner, Phys. Rev. D 35, 419 (1987); D. S. Salopek, J. R. Bond, and J. M. Bardeen, Phys. Rev. D 40, 1753 (1989); D. Polarski and A. A. Starobinsky, Nucl. Phys. B385, 623 (1992); J. A. Adams, G. G. Ross, and S. Sarkar, Nucl. Phys. B503, 405 (1997).
- (49) A. A. Starobinsky, JETP Lett. 55, 489 (1992).
- (50) E. Gaztañaga and C. M. Baugh, Mon. Not. R. Astron. Soc. 294, 229 (1998).
- (51) J. Lesgourgues, D. Polarski, and A. A. Starobinsky, Mon. Not. R. Astron. Soc. 297, 769 (1998).
- (52) Y. Fukuda et al., Phys. Rev. Lett. 86, 5651 (2001); Y. Fukuda et al., Phys. Rev. Lett. 82, 2644 (1999).
- (53) Q. R. Ahmad et al., Phys. Rev. Lett. 87, 071301 (2001). Q. R. Ahmad et al., Phys. Rev. Lett. 89, 011302 (2002).
- (54) D. N. Abdurashitov et al., Nucl. Phys. B (Proc. Suppl.) 91, 36 (2001).
- (55) M. Altmann et al., Nucl. Phys. B (Proc. Suppl.) 91, 16 (2001).
- (56) W. Hampel et al., Phys. Lett. B 447, 127 (1999).
- (57) W. W. M. Allison et al., Phys. Lett. B 449, 137 (1999).
- (58) J. R. Primack, SLAC Beam Line 31N3 (2001) 50-57, astro-ph/0112336
- (59) C.-P. Ma and E. Bertschinger, Astrophys. J. 455, 7 (1995); S. Dodelson, E. Gates, and A. Stebbins, Astrophys. J. 467, 10 (1996); W. Hu and D. J. Eisenstein, Astrophys. J. 498, 497 (1998); W. Hu, D. J. Eisenstein, and M. Tegmark, Phys. Rev. Lett. 80, 5255 (1998).
- (60) M. Fukugita, G.-C. Liu, and N. Sugiyama, Phys. Rev. Lett. 84, 1082 (2000).
- (61) R. A. C. Croft, W. Hu, and R. Davé, Phys. Rev. Lett 83, 1092 (1999).
- (62) Ø. Elgarøy et al., astro-ph/0204152 (2002).
- (63) A. I. Belesev et al., Phys. Lett. B 350, 263 (1995); Ch. Weinheimer et al., Phys. Lett. B 460, 219 (1999); V. M. Lobashev et al., Phys. Lett. B 460, 227 (1999).
- (64) G. L. Bryan and M. L. Norman, Astrophys. J. 495, 80 (1998).
- (65) J. F. Navarro, C. S. Frenk, and S. D. M. White, Mon. Not. R. Astron. Soc. 275, 56 (1995); J. F. Navarro, C. S. Frenk, and S. D. M. White, Astrophys. J. 462, 563 (1996); J. F. Navarro, C. S. Frenk, and S. D. M. White, Astrophys. J. 490, 493 (1997).
- (66) C. Lacey and S. Cole, Mon. Not. R. Astron. Soc. 262, 627; J. R. Bond, S. Cole, G. Efstathiou, and N. Kaiser, Astrophys. J. 379, 440 (1991).
- (67) Y. Jing, Astrophys. J. 535, 20 (2000).
- (68) R. A. Swaters, Ph.D. thesis, University of Groningen (1999).
- (69) A. V. Kravtsov, A. A. Klypin, J. S. Bullock, and J. R. Primack, Astrophys. J. 502, 48 (1998).
- (70) J. M. van der Hulst, E. D. Skillman, T. R. Smith, G. D. Bothun, S. S. McGaugh, and W. J. G. de Blok, Astron. J. 106, 548 (1993); W. J. G. de Blok, S. S. McGaugh, and J. M. van der Hulst, Mon. Not. R. Astron. Soc. 283, 18 (1996); J. Stil, Ph.D. thesis, University of Leiden, (1999).
- (71) W. J. G. de Blok and S. S. McGaugh, Mon. Not. R. Astron. Soc. 290, 533 (1997).
- (72) D. G. York et al., Astron. J. 120, 1579 (2000).
- (73) D. J. Eisenstein, W. Hu, and M. Tegmark, Astrophys. J. 518, 2 (1999).
- (74) A. A. Klypin, A. V. Kravtsov, O. Valenzuela, and F. Prada, Astrophys. J. 522, 82 (1999); B. Moore, S. Ghigna, F. Governato, G. Lake, T. Quinn, J. Stadel, and P. Tozzi, Astrophys. J. Lett. 524, L19 (1999).
- (75) A. R. Zentner and J. S. Bullock, in preparation.
- (76) N. Dalal and C. S. Kochanek, to appear in Astrophys. J., astro-ph/0111456; N. Dalal and C. S. Kochanek, astro-ph/0202290.