X-ray properties of Lyman Break Galaxies in the Hubble Deep Field North Region
Abstract
We describe the X-ray properties of a large sample of Lyman Break Galaxies (LBGs) in the region of the Hubble Deep Field North, derived from the 1 Ms public Chandra observation. Of our sample of 148 LBGs, four are detected individually. This immediately gives a measure of the bright AGN fraction in these galaxies of per cent, which is in agreement with that derived from the UV spectra. The X-ray color of the detected sources indicates that they are probably moderately obscured. Stacking of the remainder shows a significant detection () with an average luminosity of erg s-1 per galaxy in the rest frame 2-10 keV band. We have also studied a comparison sample of 95 z “Balmer Break” galaxies. Eight of these are detected directly, with at least two clear AGN based on their high X-ray luminosity and very hard X-ray spectra respectively. The remainder are of relatively low luminosity ( erg s-1), and the X-rays could arise from either AGN or rapid star-formation. The X-ray colors and evidence from other wavebands favor the latter interpretation. Excluding the clear AGN, we deduce a mean X-ray luminosity of erg s-1, a factor lower than the LBGs. The average ratio of the UV and X-ray luminosities of these starforming galaxies , however, is approximately the same at as it is at . This scaling implies that the X-ray emission follows the current star formation rate, as measured by the UV luminosity. We use our results to constrain the star formation rate at from an X-ray perspective. Assuming the locally established correlation between X-ray and far-IR luminosity, the average inferred star formation rate in each Lyman break galaxy is found to be approximately /yr, in excellent agreement with the extinction-corrected UV estimates. This provides an external check on the UV estimates of the star formation rates, and on the use of X-ray luminosities to infer these rates in rapidly starforming galaxies at high redshift.
1 Introduction
ROSAT deep surveys showed that the majority of the soft (0.5-2 keV) X-ray background (XRB) consists of X-rays from broad line AGN (Shanks et al. 1991; Hasinger et al. 1998; Lehmann et al. 2001). New data from the Chandra X-ray observatory have added considerably to this by resolving the majority of the hard X-ray (2-10 keV) background (Mushotzky et al. 2000; Giacconi et al. 2001; Brandt et al. 2001b hereafter B01b; Tozzi et al. 2001; Campana et al. 2001; Cowie et al. 2002; Giacconi et al. 2002). Most of the objects responsible for the hard XRB are also probably AGN, but they have properties very different from standard broad-line QSOs, and are apparently much more numerous (Mushotzky et al. 2000; Barger et al. 2001a; Hornschemeier et al. 2001 hereafter H01; Alexander et al. 2001; Rosati et al. 2002).
Galaxies without a dominant AGN can also produce X-rays, from their X-ray binary populations, supernova remnants and diffuse hot gas (see, e.g., Fabbiano 1989). Emission is expected from the evolved stellar populations, primarily from low-mass X-ray binaries (LMXBs; Fabbiano & Trinchieri 1985), but star formation should enhance this emission, via high-mass X-ray binaries (HMXBs) and type II supernovae (e.g. Griffiths & Padovani 1990; David et al. 1992). X-rays are therefore a natural consequence of star formation and evolution. In local starforming galaxies, the prompt emission associated with the starburst apparently dominates (e.g. Moran, Lehnert & Helfand 1999).
The deepest X-ray surveys have shown the emergence of a population of X-ray sources at faint fluxes, with low ratio, identified with relatively normal galaxies, without substantial nuclear accretion (Giacconi et al. 2001; H01). They represent only the tip of the iceberg of the non-AGN galaxy populations in the universe, however, with the X-ray properties of the majority of galaxies - particularly those at high redshift - remaining undetermined. Indeed, the deep X-ray surveys show source densities much lower than the deepest optical surveys. For example, in the Chandra survey of the Hubble Deep Field North (HDF-N), B01b find sources deg-2 at the faintest direct limits ever probed in the X-ray, whereas the WFPC2 and STIS observations of the Hubble Deep Fields show source densities at least 2 orders of magnitude higher (e.g. Williams et al. 1996; Casertano et al. 2000; Gardner, Brown & Ferguson 2000). Most of these objects are star-forming galaxies distributed over a wide range of redshifts (e.g. Lanzetta et al. 1996; Mobasher et al. 1996; Connoly et al. 1997; Lowenthal et al. 1997), and should be X-ray sources at some level (e.g. Griffiths & Padovani 1990). Therefore, while the Chandra surveys have resolved the sources that make up the bulk of the luminosity density of the X-ray background, they have not yet detected the majority of the X-ray sources in the universe.
Promising progress in this regard has been made using stacking analysis. Brandt et al. (2001; hereafter B01a), using a 500ks Chandra exposure of the HDF-N region, stacked the X-ray flux from a sample of 17 z galaxies with . They found a significant detection when adding the signal from the galaxies together, despite the fact that none was detected individually. The mean X-ray luminosity was found to be erg s-1, somewhat higher than that typical for galaxies in the local universe, which is typically erg s-1 (e.g. Fabbiano, Trinchieri & McDonald 1984; Fabbiano & Trinchieri 1985). One motivation of the B01a investigation was to test the model of White & Ghosh (1998), who suggested that the X-ray luminosity of normal galaxies at might be elevated compared to those in the local universe, due to evolution of low mass X-ray binaries produced during the peak of the global star formation rate at z=1-3 (Lilly et al. 1996; Madau et al. 1996, 1998). Though they did find a fairly high X-ray luminosity for their galaxies, B01a concluded that the White & Ghosh effect was not particularly large, especially considering that their stacked galaxies were the most luminous optically and therefore perhaps the most massive. Most recently, Hornschemeier et al. (2002) have extended this study to a much larger sample of spiral galaxies in the redshift range, , confirming a modest increase in the ratio of X-ray to B-band luminosity with increasing redshift.
Further development of the White & Ghosh LMXB evolution model (Ghosh & White 2001) has shown consistency with the observations, but it should be borne in mind that the delayed onset of X-rays due to LMXB evolution is a secondary effect. Prompt X-ray emission is expected in starforming galaxies due to the production of high-mass X-ray binaries, in which the production of X-rays should proceed shortly after formation (e.g. Fabbiano & Trinchieri 1985; David et al. 1992). Therefore the X-ray emission of non-AGN galaxies should follow the global star formation rate, and can in principle be used to trace it. Furthermore, as X-ray binaries in general have relatively hard X-ray spectra, their X-rays can penetrate the large columns of gas and dust in these starburst galaxies, which can cause considerable uncertainty in the derived star formation rates (Steidel et al. 1999 hereafter S99; Blain et al. 1999; Adelberger & Steidel 2000). Regardless of the effects of obscuration, the observation of X-rays offers a different perspective on the star-formation process in galaxies, which can then be compared and combined with indicators from other wavelengths (e.g. Cavaliere, Giacconi & Menci 2000; Menci & Cavaliere 2000).
To make a meaningful contribution to the global star formation debate it is necessary to determine the X-ray properties of galaxies at high redshift (), where the global star formation rate peaks. The first attempt at this has been made by Brandt et al. (2001c; hereafter B01c), who stacked the emission of 24 “Lyman Break” galaxies (LBGs; e.g. Steidel, Pettini & Hamilton 1995; Steidel et al. 1996) around z from the redshift catalogs of Cohen et al. (2000) and Cohen (2001). They found a detection in the soft Chandra band (0.5-2 keV), corresponding to a rest frame luminosity in the 2-8 keV band of erg s-1. This is much higher than normal galaxies locally, and B01c concluded that this was due to the elevated star-formation rates in these galaxies (Steidel et al. 1996). This tentatively verifies that X-ray emission can be used as a probe of the global SFR. Here we improve and expand on the B01c results by considering the X-ray properties of a sample of 148 Lyman Break galaxies in the HDF-N region (this is a factor 6 larger than the B01c sample), selected from a optical photometric survey. To this we add 95 “Balmer Break” galaxies (BBG) at z to provide an X-ray perspective on star-formation in the high redshift universe.
2 Analysis
2.1 X-ray data
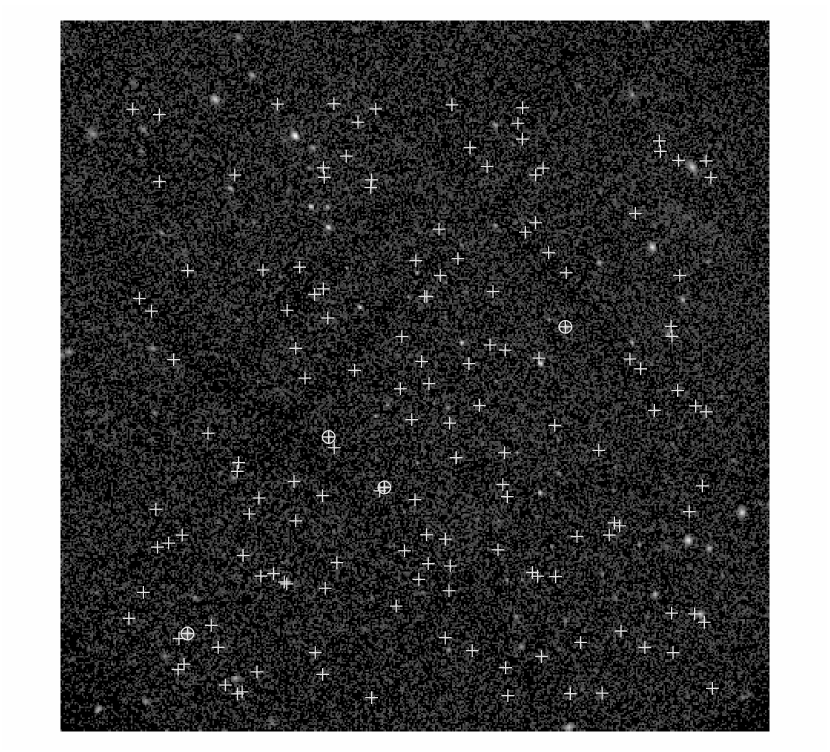
Chandra has observed the HDF-N region several times since launch. Details of some of these observations can be found in Hornschemeier et al. (2000), H01 and B01a. The analysis of the full 1Ms Chandra observation is presented in B01b. For our own analysis, we took the X-ray data from the Chandra public archive. The data have been processed through the standard Chandra analysis software “CIAO” (v2.2). The data from the various HDF-N pointings have been combined, and standard screening criteria have been applied to the event files, including removal of flaring pixels. The nominal exposure time was 977,514s, with the mean pointing position = 12h36m50.85, = 62d13m45.12s. This is close to the central HDF pointing position and the center of the Lyman Break Galaxy survey field. Our analysis is restricted to an approximately region centered on the mean Chandra pointing (see Fig. 1), which encompasses the optical LBG survey region (). We have performed our analysis in two energy bands, 0.5-2 keV and 2-8 keV, which henceforth we refer to as the soft and hard bands. We also quote some results in the full (0.5-8 keV) band.
The HDF-N data were accumulated in a number of different pointings with different roll angles. This leads to a very inhomogeneous exposure map for the whole ACIS field of view. We have calculated the exposure and instrument maps using the standard CIAO prescription for each pointing separately, and combined them to produce effective exposures for each pixel. As the mirror vignetting is energy dependent, we calculated the exposure map at a single energy representative of the mean energy of the photons in each band: 1 keV for the soft image and 5 keV for the hard image. We found a variation in effective exposure in the LBG field from ks to ks for the soft band, and ks for the hard band. This effective exposure must be accounted for when converting the observed counts to flux: division of the number of counts by the effective exposure gives a count rate corrected for the exposure, mirror vignetting and detector efficiency, equivalent to an on-axis count rate. The other important instrumental effect that must be considered is the variation in the point spread function (PSF) with off axis angle. The PSF variation is important for two reasons: in the choice of extraction radius when determining source counts, and because of the position-dependent correction for counts falling outside the cell. We take an empirical approach to determining the extraction radius, which is discussed below. For the PSF correction of the counts, we used the encircled energy fractions given for the High Resolution Mirror Assembly in the Chandra proposers observatory guide, v3.0.
In converting the on-axis, PSF-corrected count rates to fluxes we have assumed a power-law source spectrum with Galactic of (Stark et al. 1992). We adopt for luminous hard X-ray sources which we believe are dominated by an AGN, and for the remainder. The latter is crudely appropriate for the integrated X-ray spectrum of starforming galaxies. To calculate the luminosity we adopt a cosmology with , and h=0.7. Where available, we adopt the spectroscopic redshift to calculate the luminosity. For LBGs where no spectroscopic redshift is available we adopt the median redshift implied by the selection function of .
2.2 Optical data
The Lyman Break Galaxy candidates were selected using photometric criteria as described in, e.g., S99. The interloper fraction in the LBG surveys as a whole is very small, approximately 4%, all of which are stars. In addition, there are no known interlopers fainter than . 61 of the LBG candidates have been spectroscopically confirmed as galaxies at z, and only one of the color-selected LBG candidates for which a spectrum has been obtained is not a high redshift galaxy. Accordingly, we proceed under the assumption that all 148 LBG candidates (excluding the known star) are high redshift galaxies, whether or not they are spectroscopically confirmed. The “Balmer Break” galaxy candidates are also color selected, based on the existence of that feature in the stellar SED. The selection function is narrowly peaked about , with the sample becoming increasingly incomplete outside the redshift range . Only a relatively small fraction of the BBG have been attempted spectroscopically, and here we consider only those that have, meaning that not all objects even in this small redshift range are included. While the BBG sample is therefore incomplete, the selection procedure ensures they are representative of the starforming galaxy populations at . In addition, they should also represent the objects at z=1 which are most similar to the LBGs, in that they require current star formation in order to be found. The one possible bias in the BBG sample that might affect our results is that objects with strong nuclear emission in the near-UV from an AGN may be excluded by the color selection. We consider this in our discussion below. Our BBG sample consists of 95 objects, all of which are spectroscopically confirmed galaxies at . 66 of the 95 are in the range . We applied a shift of 0.089 seconds in RA and -1.03 arcsec to the optical positions of both the LBGs and BBGs to agree with the reference frame of Williams et al. (1996).
2.3 Source detection
Our intent is to characterize the X-ray properties of known high redshift galaxies, rather than necessarily associate detected X-ray sources with optical ones. As our object class is well-defined, this allows us to characterize the mean properties of the objects without the bias of X-ray selection. Nonetheless it is useful to test whether any of the optical galaxies are individually detected in the Chandra image, which might give clues to the origin of the X-rays both in the brightest X-ray sources and the population as a whole. Furthermore, we need to know where the bright X-ray sources are - whether or not they are associated with our target galaxies - so they can be excluded from the background determination and stacking. We performed source detection in the full, soft and hard bands using the Chandra “wavdetect” algorithm, following B01b. The detection probability threshold was set at , such that approximately 1 spurious source is expected for each run. The wavdetect algorithm defines an elliptical source region with a size and orientation depending on the instrumental point spread function, and which is therefore dependent on off-axis angle. These elliptical regions can be excluded from the background analysis.


2.4 Stacking procedure
The use of stacking to determine mean properties of objects has been applied widely in X-ray astronomy (e.g. Green et al. 1995; della Ceca et al. 1999). By adding together X-ray photons from well-defined classes of object, we can determine their mean X-ray properties. Furthermore, we can remove known, bright X-ray sources from the sample to determine the mean properties of sources too weak to be individually detected. The stacking technique has most recently been applied with these Chandra observations of the HDF-N area (B01b, B01c; Hornschemeier et al. 2002), to determine the properties of high redshift galaxies including, as mentioned in the introduction, a small sample of LBGs. We describe our own procedure in detail here.
The basic technique we have employed is similar to that described in B01a and B01c. First, we add together source counts from a large number of known optical galaxies, excluding known X-ray sources. If we can then estimate the expected background we can assign a significance to the signal, and determine the average flux and luminosity of the typical galaxy. Estimating the source-plus-background signal is simple, with the only complication being the size of the region used to extract the source counts. We do not expect these high redshift galaxies, which have half-light radii arcsec (e.g. Giavalisco, Steidel & Macchetto 1996), to be extended at the resolution of Chandra so ideally the extraction radius should be comparable to the core of the point-spread function. In practice we used an entirely empirical approach to determining the optimal extraction radius, by testing several fixed values of that radius and taking the one which gave the maximum source signal. Another approach is to take a variable extraction region whose radius depends on the off-axis angle, i.e. a fixed fraction of the PSF width. In practice stacking experiments using such a detection cell gave lower significances than a fixed cell. This is due to the fact that the extraction cells at large off-axis angles become large, and incorporate a large fraction of background. A further problem with using these large detection cells is that it greatly increases the probability of including a galaxy other than the target in the extraction region and invalidating the stacking results.
We found a constant-size 2.5 arcsec circular region to give an optimal signal (Fig. 2), and have adopted this value for all subsequent analysis. We note that even at the maximum resolution of the Chandra images (0.5 arcsec pixels, which we adopt), the extraction cell is relatively small compared to the pixel size and therefore for an arbitrary position our region definition does not always result in a constant number of pixels for each extraction cell. Thus the definition of whether a pixel is or is not inside the extraction cell becomes important. We define a pixel to be within the extraction radius if the center of that pixel falls within the circle. For the chosen 2.5 arcsec radius the typical number of source pixels in each cell is 20.
Due to degradation of the PSF, including galaxies at large off-axis angles may have a deleterious effect on the signal-to-noise ratio, if the PSF becomes so wide that we add primarily background counts. In practice we have found that while there is no improvement in signal-to-noise ratio beyond an off-axis angle of arcmin radius (Fig. 2), neither does the signal significantly degrade. In other words the loss of source counts out of the fixed extraction cell is almost exactly balanced by the increase due to the larger number of galaxies considered. Despite these “diminishing returns” we prefer to analyze the entire sample of LBGs and BBGs as the larger number of galaxies makes our conclusions regarding their mean properties more statistically robust.
To estimate if the summed counts constitute a significant signal, we estimated the background in several ways (see also B01b). First, we randomly shuffled the galaxy positions by 3-10 arcsec and extracted the counts from these regions. Second, we chose random positions within the region of interest. We repeated these shuffled and random experiments typically 1000 times, which is sufficient to give an accurate estimate of the background counts and the dispersion, for comparison with Poisson statistics. For significantly larger numbers of trials and particularly for the shuffled positions, the estimates lose independence. Finally, we estimated the background from a background map produced by the wavdetect software, which is effectively a heavily smoothed version of the image with known sources removed. As shown in Fig. 2 our results are not sensitive to the background estimation method and generally we have adopted the shuffle method when quoting the results.
The instrumental effects discussed above may cause our estimates to be unrepresentative of the background at the tested source positions. In particular, for the shuffled and randomized estimates, the total exposure time at the tested background positions, instrumental efficiency, vignetting and source-cell definitions are different for the background positions than they are for the source positions. However, as typically a large number of galaxy positions are tested, on average the shuffled or randomized positions should represent similar instrumental characteristics to the source positions. Thus it should be valid to perform the stacking without applying these corrections - which depend on our uncertain knowledge of the instruments. In addition, in this very deep image most of the diffuse X-ray background is resolved and the particle background will dominate. Unlike source photons, the expected distribution of these particle events is unlikely to be well represented by the combined instrument/exposure map. Non-uniformities in the particle background may be present, but they are difficult to quantify, and are probably best accounted for at the current time by taking a large number of random realizations, as we have done here. Therefore, the only correction we have applied to the background estimates is the simple one of the total number of pixels in each background realization relative to the total pixels in the source regions. This can be non-negligible, if a significantly different number of background test positions fall in “masked” regions (i.e. where sources are directly detected) when compared to the galaxy cells.
3 Results
3.1 Direct detections
We detected 125 and 107 sources in the soft and hard bands. Four of the LBGs were found to be co-incident with directly-detected Chandra sources in the 0.5-2 keV band (2-8 keV at z=3). The detected sources are listed in Table 1. All four sources are also identified by a simple extraction of counts in the 2.5 arcsec detection cell we used for stacking, and we have used this extraction to calculate the source fluxes. The weakest had 20 counts in this cell, with only 1.25 expected from background. All four are therefore extremely secure X-ray sources. In contrast, the fifth brightest LBG has only 6 counts which, although individually significant at per cent confidence, is not significant considering the number of trials.
| CXOHDFN | Name | Offset | R | z | Cts | ||||
|---|---|---|---|---|---|---|---|---|---|
| (1) | (2) | (3) | (4) | (5) | (6) | (7) | (8) | (9) | (10) |
| Lyman Break Galaxies | |||||||||
| J123633.4+621418a | oC34 | 0.49 | 24.15 | 3.406 | 72 | 1.20 | |||
| J123655.8+621200a | CC10 | 0.20 | 24.36 | 22 | 1.20 | ||||
| J123702.6+621244 | MMD34 | 0.13 | 25.32 | 20 | 1.14 | ||||
| J123719.9+620955a | MMD12 | 0.29 | 24.84 | 2.643 | 78 | 1.20 | |||
| Balmer Break Galaxies | |||||||||
| J123627.3+621258a | MFFN205 | 0.63 | 22.57 | 1.221 | 9 | 1.27 | |||
| J123633.7+621006a | FFN64 | 0.54 | 22.55 | 1.016 | 27 | 1.33 | |||
| J123634.5+621241 | FFN228 | 0.44 | 23.46 | 1.225 | 18 | 1.27 | |||
| J123646.3+621405b | MFFN252 | 0.22 | 22.04 | 0.962 | 554 | 1.27 | |||
| J123646.3+621529 | MFFN317 | 0.84 | 22.12 | 0.853 | 12 | 1.33 | |||
| J123653.6+621115 | AFFN83 | 0.37 | 23.34 | 0.890 | 8 | 1.33 | |||
| J123657.4+621025 | MFFN71 | 0.47 | 23.55 | 0.847 | 14 | 1.14 | |||
| J123707.9+621606a,b,c | FFN379 | 0.11 | 22.17 | 0.936 | 23 | 2.81 | |||
Note. — Columns are: (1) Chandra designation based on the wavelet-detected position in the full band; (2) LBG/BBG survey name; (3) Offset between Chandra and optical position in arcsec; (4) R magnitude; (5) spectroscopic redshift; (6) Photons in the 2.5 arcsec detection cell (soft band); (7) Expected background counts in the cell; (8) Soft band flux in erg cm-2 s-1; (9) Hard band flux in erg cm-2 s-1; (10) Rest frame 2-10 keV luminosity in units of erg s-1 assuming an unabsorbed power law and converted from the soft band flux. aAlso hard band detection. bLuminosity converted from hard band flux. c This source has no significant detection in the soft band (6 counts). Counts and background refer to hard band counts.
The optical positions of the detected LBGs were within arcsec of the Chandra centroid determined by wavdetect, consistent with the positional error (B01c). There is some possibility that the detected X-ray sources are not associated with the Lyman Break Galaxies, but we believe these are secure. Given the number of test positions and detected sources we estimate the chance probability that one of the associations is spurious to be per cent, and that they all are to be . All four of the directly-detected sources have already been reported by B01b, but only one has been identified (CXO HDFN J 123633.4+621418 by H01), with a z=3.4 broad-line AGN (Cohen et al. 2000). The other spectroscopically identified LBG in our sample is CXO HDFN J 123719.9+620955 (= MMD12) at z=2.643 (Steidel et al. 2002). It shows strong C iv, C iii and He ii emission in addition to Lyman and is almost certainly also an AGN. While neither of the other two detected X-ray sources have been attempted spectroscopically, as discussed above the interloper fraction using the Lyman Break technique is extremely small and it is highly likely that these are also galaxies at z. The X-ray luminosities of all of these galaxies in the 2-10 keV band is therefore erg s-1(Table 1), and as discussed below all the directly-detected galaxies almost certainly host bright AGN. This conclusion is further supported in three of the four cases by their detection in the hard band (2-8 keV observed frame or keV rest frame). The hardness ratio of the detected sources, calculated by summing the counts in the 2-8 and 0.5-2 keV bands and dividing them, is . This corresponds to an unabsorbed spectral index of . Assuming an intrinsic spectrum of , more typical of local Seyferts and soft X-ray selected quasars (e.g. Nandra & Pounds 1994; Georgantopoulos et al. 1996), the color implies a large absorbing column of , if the material is intrinsic to the source at z=3. The latter is much higher than is typically observed in low redshift Seyfert 1 galaxies (e.g. Turner & Pounds 1989; Nandra & Pounds 1994), but at the low end of that seen in type 2 Seyferts (Awaki et al. 1991; Risaliti, Maiolino & Salvati 1999).
The wavdetect direct detection threshold is erg cm-2 s-1 in the soft band for the maximum exposure in the image (see also B01b). This corresponds to a luminosity of erg s-1 at the median redshift of . In the hard band the corresponding limit is , giving erg s-1. These limits are a factor worse at the minimum exposure point.
Turning to the BBG sample, we found 7 significant soft band detections, which are also given in Table 1. Of these, two have previously been reported by H01, with one being identified with a broad line AGN at z=0.962 (C00). This source - in the HDF proper - is CXOHDFN J123646.3+621405 (MFFN252) and is very bright, with 554 counts (Table 1) and an even stronger detection in the hard band with 658 total counts. This source has an implied luminosity of erg s-1, making its properties rather similar to the directly detected LBGs. The hardness ratio is larger (HS=1.18), implying an extremely flat spectrum of , but also consistent with a spectrum and a column of at the source redshift of z=0.962. This is in fact similar to the spectrum inferred for the detected LBGs. If the sources are absorbed the lower hardness ratio for the LBGs may simply be due to a negative K-correction, with the absorption being redshifted out of the bandpass.
B01a have performed a direct spectral fit for this object based on the 500ks observation, and found that the source is indeed absorbed, with and , though both parameters have fairly large errors. The other H01 detection was CXOHDFN J123657.4+621026=MFFN71. The soft band flux of this source (14 counts) is similar to the remaining 5 sources, which range from 8-27 counts. The brightest one has an implied luminosity of erg s-1.
Of the soft X-ray detected BBGs, two are also detected in the hard band. One is the bright broad-line AGN mentioned above. The other is the next brightest soft band source CXOHDFN J123633.6+621006 (=FFN64). The hardness ratio is HS=0.44, similar to the directly detected LBGs and implying . One additional BBG is detected in the hard band only. This hard source is CXOHDFN J123707.9+621605.6 (=FFN 379) The hard source has (very conservatively) , implying if and the absorption is intrinsic to the source or alternatively a spectrum of in the unlikely event that it is unobscured. None of the directly-detected BBGs, with the exception of MFFN252, show AGN signatures in their optical spectra. We discuss their properties in more detail in Section 4.
For the BBGs the wavdetect direct detection thresholds correspond to luminosities of erg s-1 in the soft band (1-4 keV rest frame) and erg s-1 in the hard band (4-16 keV rest frame), again for the maximal exposure.
All the sources given in Table 1 have been previously reported by B01b. We generally find excellent agreement in the derived fluxes, with two exceptions. These are J13633.7+621006 and J123646.3+621529, where B01b find factor higher fluxes, and a hard band detection in the latter case. We attribute this to the fact that Brandt et el. derived their fluxes from wavdetect, whereas we extracted counts from a fixed cell based on the optical position.
Looking at the LBGs and BBGs together, there is a tentative implication that the distribution of luminosities is bimodal, with clear AGN having erg s-1, and a second population having erg s-1, the origin of which is yet to be determined. We now go on to define the properties of the non-detected sources using the stacking technique.
3.2 Stacking
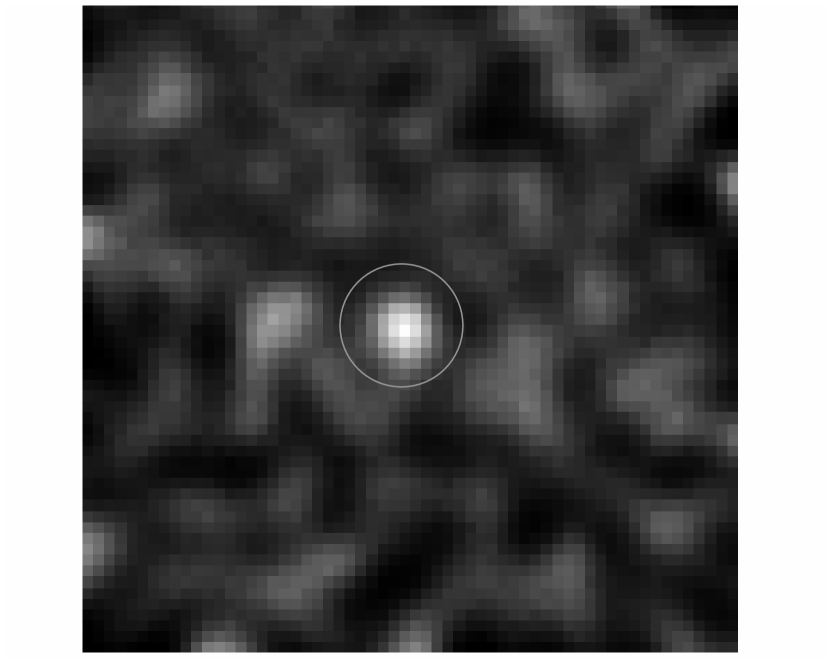
The results of the stacking are summarized in Table 2. As can be seen from this, and Figs. 2 and 3, stacking the 144 undetected LBGs gives a strong signal of above the expected background level. An excess of 75 counts is obtained. Our detection is considerably more significant than the detection obtained by B01c, due to the much larger number of galaxies we have available for stacking. Indeed for an inclusion radius 1.5-2 arcmin (16-30 galaxies), which is similar to the central HDF used by B01 with 24 galaxies, we obtain a very similar significance (Fig. 2). The mean count rate corresponds to a flux of erg cm-2 s-1 per galaxy, with a luminosity of erg cm-2 s-1. Approximately 0.5 ct is detected from each of these LBGs on average. It is also interesting to consider the average X-ray fluence from the entire sample of LBGs. Adding back in the four detected LBGs from Table 1, we find a mean luminosity erg s-1 per galaxy in the 2-8 keV rest frame band.
| Sample | Band | S | B | SNR | ||||
|---|---|---|---|---|---|---|---|---|
| (1) | (2) | (3) | (4) | (5) | (6) | (7) | (8) | (9) |
| Shuffled positions | ||||||||
| LBG | Soft | 252 | 176.4 | 13.3 | 13.5 | 5.7 | ||
| BBG | Softa | 206 | 118.0 | 10.9 | 10.9 | 8.1 | ||
| LBG | Hard | 404 | 385.9 | 19.6 | 18.6 | 0.9 | ||
| BBG | Hard | 252 | 228.8 | 15.1 | 14.8 | 1.7 | ||
| Random positions | ||||||||
| LBG | Soft | 252 | 175.2 | 13.2 | 14.2 | 5.6 | ||
| BBG | Soft | 206 | 113.4 | 10.6 | 11.1 | 8.3 | ||
| LBG | Hard | 404 | 377.5 | 19.4 | 19.8 | 1.3 | ||
| BBG | Hard | 252 | 232.8 | 15.2 | 15.7 | 1.2 | ||
Note. — Columns are: (1) Galaxy sample; (2) Observed frame energy band. Soft is 0.5-2 keV and hard 2-8 keV; (3) Source counts; (4) Background counts; (5) Poisson error on bgd counts; (6) Dispersion of background counts; (7) Signal-to-noise ratio () where the noise N is the larger of and ; (8) X-ray flux per galaxy in the given band in units of erg cm-2 s-1. Upper limits are 3; (9) X-ray luminosity in the 2-10 keV band in units of erg s-1, derived from the soft band flux assuming and galactic , or in the 10-50 keV band derived from the hard counts. aStacking the BBGs in exactly the same rest frame band as the LBGs (2-8 keV; i.e. observed 1-4 keV band) gives a consistent 2-10 keV luminosity.
We do not detect the stacked LBGs in the hard band, with a 3 upper limit of counts, corresponding to a rest frame (8-32 keV) luminosity of erg s-1. Assuming the stacked LBGs have the same X-ray spectrum as the detected ones (i.e. with HS=0.44), we predict 33 counts in the hard band from the stacked images, consistent with the observed limit. Thus we cannot state definitively whether the stacked LBGs have a spectrum significantly different from the directly detected ones.
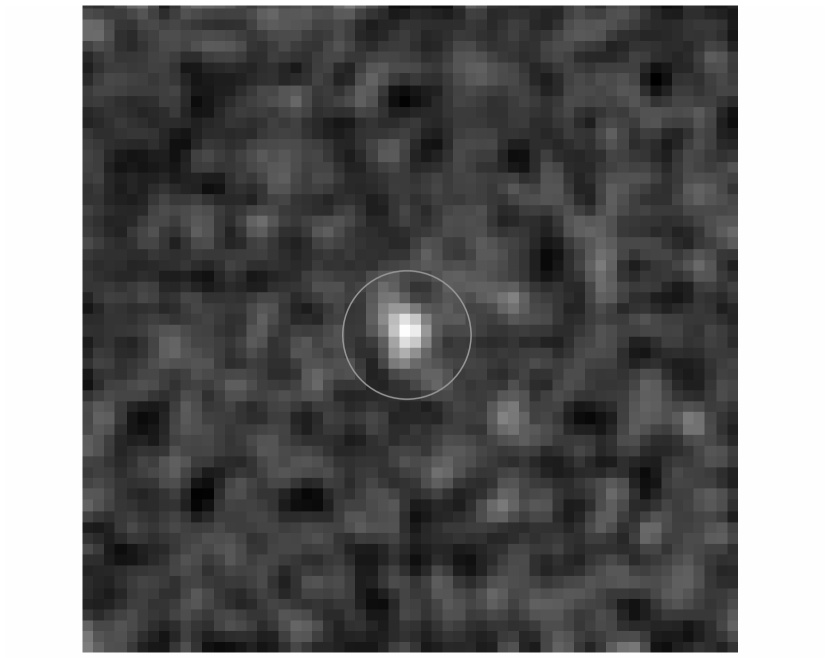
Stacking the 87 non-detected BBGs in the soft band we again find a highly significant signal, this time at (Table 2; Fig. 3), with a total of counts attributable to the galaxies - about 1 per source. Here the mean flux per galaxy of erg cm-2 s-1 corresponds to much lower luminosity of erg s-1 in the 2-10 keV band, a factor lower than the LBGs. On the other hand, many of the BBGs detected directly have luminosities below the detection threshold if they were at z=3. We would therefore have included them in the “stack” of LBGs, meaning that this is not necessarily a fair comparison. Indeed, only the bright AGN CXOHDFN J123646.3+621405 (MFFN252) has a luminosity large enough to have been detectable at z=3. Adding back in the other sources results in an inferred mean luminosity of erg s-1, still a factor lower than the LBGs. We note that the one very secure AGN in the BBG sample MFFN252 is more luminous individually than the sum of the entire remainder of the sample. Furthermore, the 6 additional BBGs individually detected in the soft band contribute approximately half of the X-ray luminosity of the sample (excluding MFFN252).
The stack of BBGs is not detected in the hard band either, with a upper limit of counts. The implied hardness ratio is incompatible with the detected AGN MFFN 252 in the BBG sample at high confidence: the stacked sources are much softer than this. They are also different at from the colors of the directly detected LBGs of HS=0.44. As neither the LBG nor the BBG stack is detected in the hard band, their colors are of course consistent with each other. These starforming galaxies evidently have hard spectra if they have high X-ray luminosity ( erg s-1), which fits in with our suggestion that they are AGN. The lower luminosity stacked sources have softer X-ray colors, which may be indicative of star formation.
3.3 Statistical considerations
The designation of some sources as “detections” and others not is an arbitrary distinction, which is normally applied in a conservative manner to avoid a high probability of false detections (e.g. Miller et al. 2001). This distinction is particularly striking in the case of Chandra surveys for weak sources as the background is so very low. For example, in our optimal extraction radius of 2.5 arcsec radius, we predict 1.25 background counts in the soft band and thus observing only 5 photons in a single cell is significant at per cent confidence. In practice many cells are tested, but given we are strictly in the Poisson regime, the number of sources considered to be “real” depends on an arbitrary threshold. Where this is set (whether at, say 8 or 9 photons, for example) can dramatically change the number of sources considered to significant. This also makes the source detection process severely susceptible to “Eddington bias”: only randomly positive fluctuations are treated as detections.


Stacking of objects not selected in the X-ray band is actually advantageous in this regard, since if all objects are included there is no such bias. The disadvantage is that the stacked objects, while having well-defined selection criteria in some other band (in our case the optical/UV), may have heterogeneous properties in the X-rays. A particular consideration in our case, for example, is whether the X-rays from these high redshift galaxies arise from nuclear accreting black holes (i.e. AGN) or from processes related to star formation (X-ray binaries, SNR, winds etc.). Stacking all of the objects together gives us an estimate of the mean luminosity of the sources, but not much more. In practice we have not stacked all of the objects, but have designated some of them direct detections and excluded them from the stacking procedure. This allows us to examine the properties of those sources individually, compare them with other properties and search for correlations. It also gives more meaning to the stacked signal for the weaker sources, which would otherwise be swamped by inclusion of the direct detections. Nonetheless the application of a detection threshold makes us potentially susceptible to the Eddington bias. Examining the distribution of counts obtained for each galaxy may allow quantification of this bias, and furthermore should let us examine the (related) issue of whether the stacked signal is dominated by just a few sub-threshold objects and therefore not representative of the mean of the population.
Figure 4 shows the distribution of counts obtained in the detection cell for both the LBGs and BBGs. In both cases, we have calculated an arbitrary detection threshold (similar to that of the wavdetect algorithm) corresponding to a number of counts for which there is 99 per cent confidence that the source has more counts than expected from the background level, after accounting for the number of trials. In both cases this threshold is 8 counts.
Looking at the LBGs first, there is a very clear distinction between those sources we consider detections, which are all well above the threshold level, and those we have included in the stacking, which form a continuous distribution. Even for the weakest detected source with 20 counts, the probability that we obtain such a large number based on the background level (vertical dotted line) is vanishingly small. This probability remains negligible when we calculate it based on the mean counts-per-cell derived from the stacked galaxies (i.e. source plus background per cell for all sources with less than 8 counts). Thus the detected sources are not consistent with simply being Eddington biased examples of the stacked population, and must have significantly higher fluxes. This justifies our exclusion of them from the stacking process, particularly because, as we shall discuss below, the luminosity corresponding to these fluxes places them at a level at or above which an AGN origin is almost certain. The X–rays from the remainder of the objects may or may not arise from AGN, but including the X-rays from the brightest objects would clearly swamp the stacked emission.
We have also investigated whether the stacked signal could be due to just a few “bright” sources just below the detection threshold. This is particularly relevant to our discussion as it is possible that a few sub-threshold AGN might contribute the entire stacked signal, invalidating our conclusions about the mean emission of the typical galaxy. Four sources in the LBG stack have as many as 6 counts. The probability of individually obtaining such a large amount of counts given the background level is approximately . Accounting for the number of trials, however, we find that the probability of one or more sources being observed with such a high number of counts is 0.73. To calculate the probability that four (or more) such bright cells would be detected it is easiest to use simulations. We find this probability to be about per cent, offering some (weak) evidence that the distribution is “top heavy”. A highly conservative way of determining the minimum number of galaxies that must contribute to the stacked signal is to remove the galaxies with the most counts systematically until the signal becomes insignificant. For the LBGs we can remove all 4 sources with 6 counts and still obtain a significant signal at the level. If we further remove all 7 cells with 5 counts the signal drops to below . Thus in principle the detected signal could be reproduced even if 90% of the LBGs emitted no X-rays at all. In practice the count distribution is a random realization of the Poisson fluctuations in each cell, and it is highly unlikely that - even if the above null hypothesis is true - the X-ray “active” cells would happen to produce the highest number of counts. In addition, the mean counts per cell for these 11 bright cells is 5.36, yet we observe no cells with greater than 7 counts. The probability that this would happen in 11 trials with the given mean is per cent. It is therefore much more likely that a large number of the LBGs contribute to the signal. Having said that, given the wide range of optical magnitudes, extinctions, star formation rates and nuclear AGN contributions in the LBGs, it is highly likely that the sources in the “stack” exhibit a range of X-ray luminosities. This will only be quantifiable with improved X-ray data.
For the BBGs there appears to be a more continuous distribution around the threshold level and a less clear distinction between detected and non-detected sources. Here the mean source-plus-background signal per cell for the stacked sources is 2.37, and both the probability calculations and simulations show that obtaining 12 counts is very unlikely by chance if this is the mean of the distribution (). We (and wavdetect) have also designated the two sources with 8 and 9 counts as significant and the simulations confirm that indeed the probability of obtaining them is less than 1 per cent based on the background level. It is not especially unlikely, however, that these sources have a significantly different flux from the remainder of the stack. The simulations give 9 counts or more given a mean of 2.37 about 7 per cent of the time, and eight counts or more per cent of the time. The 8 and 9 count cells are therefore consistent with simply being sources that are part of the “stack”, which are undergoing random positive fluctuations. None the less, there is a clear range in luminosities in the BBG sample, which is again expected on other grounds. The results from the BBGs circumstantially support our conclusion that the LBG signal is not dominated by a few objects: when the X-ray bright end of the BBG distribution is removed (by the sources being detected), a highly significant signal remains from the weaker objects. This is also likely the case for the LBGs. The fact that we do directly detect the bright end of the BBG population and can therefore identify the brightest sources means we can examine whether or not they stand out in any other way. We now discuss the non X-ray properties of these galaxies.
4 Multi-waveband properties of the sources
A crucial question which we discuss in detail below is that of whether the X-rays we have detected from these high redshift galaxies are due to accreting nuclear black holes (AGN), or processes associated with star formation such as X-ray binaries, supernovae, diffuse emission etc. The non-X-ray properties of our sample of high redshift galaxies offer some clues to this. As we have already mentioned, there are two LBGs detected directly in the X-rays and for which spectroscopy is available. Both show evidence for AGN activity in their ultraviolet spectra. It is very likely that the X-rays from these arise from the active nucleus. The other two LBGs that are bright X-ray sources have not been attempted spectroscopically, and it will be interesting to see if future observations reveal AGN signatures in their UV spectra. At least one additional LBG, oMD49 at z=2.21 (=12h37m04.3s, =+62h14m46.2s) shows AGN signatures, specifically strong (albeit narrow) Ly, Civ, Heii and C III] emission lines, in its UV spectrum (Steidel et al. 2002), but is not detected in the X-ray. Here it will be interesting to see if planned, deeper Chandra data reveal a direct X-ray signal. We further note that excluding this source (which has 6 counts in the detection cell) from the stacking has a negligible affect on the results.
Turning to the BBGs, as discussed above the brightest of the X-ray sources is a well known AGN. As shown in Table 1, however, 6 of the remaining BBGs are also directly detected in the soft X-ray band. These are among the brightest sources optically. They also have significantly redder colors in the 2500-3500Å band than is typical for these galaxies. Three of these six are also ISO 15 sources. Finally, these sources are exceptionally bright in the radio. Two have been reported by Richards et al. (2000) at 1.4 GHz, J123633.7+621006 (FFN64) and J123634.5+621241 (FFN228). The first has a very steep radio spectrum - it is undetected at 8.5 GHz - and is unresolved at the 2.0” VLA A-array resolution. The second is detected at 8.5 GHz but also has a steep spectrum, and it was barely resolved at the same resolution. A further two of the BBGs - MFFN205 and MFFN 307 are marginally detected at 20cm in the deep radio map. Summing up the flux of the 6 soft X-ray detected BBGs (excluding the bright AGN), they account for per cent of the total radio flux of all the BBGs. We note that these objects contribute a similar, but indeed even larger fraction of the total X-ray flux: about per cent of the total. All the above properties are strong star formation indicators, so the brightest X-ray sources in the BBG sample appear to be the ones forming stars at the most rapid rate. We discuss this in detail below.
For completeness we also note that the single hard-band only detection FFN379 is also a significant 20cm source (but not an ISO source), which may support its identification as an AGN. Finally, for MFFN252, the bright AGN associated with VLA J123646+621404, Garrett et al. (2001) give a peak flux at 1.4 GHz of 180.0 Jy and the same total flux at 20mas resolution, indicating an extremely core-dominated source. None of the LBGs is bright enough to be detected in the radio.
5 Discussion
We have used the Chandra ultra-deep image of the HDF-N region to determine and constrain the X-ray properties of 148 z LBGs and LBG candidates in a survey field centered on the central HDF. We have also examined X-rays from a BBG sample for comparison. Of the 148 LBGs, 4 are relatively bright X-ray sources in their own right, with luminosities of greater than erg s-1and detections in both the soft and hard Chandra bands. The remaining sources not individually detected are nonetheless detected om the soft band at very high significance (6) when stacked, with a flux corresponding to a mean luminosity of erg s-1. Of the BBGs, 1 of the 95 galaxies is a bright Chandra source with a luminosity of erg s-1and again a hard band detection. Another 6 BBGs are identified by the source detection algorithm in the soft band with luminosities of erg s-1. One additional source is detected in the hard band alone. The remaining stack of BBGs shows a detection with a mean luminosity of erg s-1. Applying the same luminosity detection threshold to the BBGs appropriate for the LBGs results in a mean luminosity per BBG of erg s-1. Thus, when the most X-ray luminous sources ( erg s-1) are excluded, we find that the BBGs have average X-ray luminosity a factor 5 less than the LBGs. There is a range of luminosities in the BBGs and, even when the bright AGN is excluded, we find that the 6 detected bright objects in the BBG sample provide 50 per cent of the observed luminosity.
5.1 AGN vs. starbursts
As has already been mentioned, a critical issue is whether the X-rays we detect from the LBGs and BBGs arise from AGN or starforming process. B01b made no clear distinction between the two, noting that low-luminosity AGN are very common in nearby galaxies (Ho, Filippenko & Sargent 1997) and therefore at least some contribution from a nuclear accreting black hole may be considered “normal”. While this may be so, discriminating between starbursts and accretion is extremely important if the X-ray observations are to be interpreted in detail and astrophysical conclusions drawn. For example, the stacking shows that the LBGs have X-ray luminosities approximately 2 orders of magnitude greater than spirals in the nearby universe. If these additional X-rays are from AGN, it implies that the LBGs are typically going through a fairly vigorous phase of black hole growth, accompanying their copious star formation. Such a conclusion would have strong implications for ideas connecting galaxy and black hole formation (e.g. Silk & Rees 1998; Haehnelt & Kauffmann 2000). On the other hand, the enhanced X-ray emission may simply reflect the intense star-formation in these objects. If this is the case, it may be possible to use the X-ray emission as a tracer of the star-formation rate (SFR), and as we are able to observe the hard X-ray emission, the estimates should suffer relatively little bias due to absorption (c.f. the UV; S99; Adelberger & Steidel 2000). X-ray observations of high redshift, non-AGN galaxies are therefore potentially an important tracer of the cosmic star formation history (e.g. Lilly et al. 1996; Madau et al. 1996, 1998; S99; Blain et al. 1999; Cowie, Songaila & Barger 1999; Barger, Cowie & Richards 2000). Clearly there are important conclusions to be drawn whether or not the X-rays from these high redshift galaxies are from AGN or star formation, but the conclusions are quite different depending on which mechanism dominates. In passing we note that a similar debate between AGN and star-formation exists in the discussion of luminous infrared/submm galaxies (e.g. Sanders et al. 1988; Sanders & Mirabel 1996; Genzel et al. 1998), which is still not resolved. Both processes are likely to contribute to some extent. We now discuss in detail the likely origin of the X-rays we have observed.
The X-rays from the four directly-detected LBGs and the one very bright BBG are almost certainly from nuclear, accreting supermassive black holes (i.e. AGN), based on their X-ray luminosity alone. In the extreme, local starburst luminosities never exceed erg s-1 (Zezas, Georgantopoulos & Ward 1998; Moran et al. 1999). The star formation rates may be even higher in these high redshift galaxies, but the observation of X-ray luminosities erg s-1 is a good indicator that an AGN is the dominant X-ray emission mechanism. The detection of these sources in the hard band (above 8 keV rest frame for the LBGs), and their hard X-ray color is another strong indication that these are AGN: star-forming processes tend to present softer spectra. Where optical/UV spectra are available, they also exhibit high ionization (and sometimes broad) emission lines confirming their AGN nature. The other source that is very likely to be AGN-dominated is the hard-band only detected BBG: galaxies with such hard X-ray spectra are very likely to house obscured AGN.
For the remainder of the sources, X-ray luminosity cannot be used to discriminate, as they have erg s-1. This could be accounted for by either AGN or starforming processes. The colors are unremarkable for unobscured AGN, but it is noteworthy that at least the stacked BBGs have X-ray colors significantly softer than the directly detected, secure AGN in both the BBG and LBG samples. This is consistent with the idea that the X-rays come from star formation, rather than AGN. The only unambiguous way to determine the origin of the emission in these sources is by high quality X-ray imaging at arcsec resolution. Such data are unlikely to be available for some time. Time variability in the X-rays would be another clear indication that an AGN dominates, but once again such diagnostics are not currently available, and will not be unless we can detect the galaxies directly, rather than by stacking. There are further clues, however, from the multi-waveband data, and these tend to favor star formation over accretion as the likely source of the X-rays.
Firstly, we note that only one LBG not directly detected in the X-ray band shows prominent high excitation or broad line emission in its UV spectrum. None of the BBGs save for the single, bright X-ray source shows clear AGN signatures in the optical spectrum. This in itself is not a certain indicator that an AGN is not present, as deep Chandra surveys clearly show that there is a large population of high luminosity X-ray sources which exhibit no optical signature of AGN activity (Mushotzky et al. 2000; H01). Unless the reddenning is large, however, low-level AGN activity may be easier to pick up in the rest frame UV than in the optical, because so many of the high excitation AGN signatures are UV lines. We observe this band in the LBGs and find no such evidence, but UV spectroscopy is lacking for the BBGs. It would clearly be interesting to see if any AGN spectral lines are revealed at 1000-2000Å rest frame in the X-ray bright BBGs.
Another fairly robust discriminator between AGN and starburst activity is the radio emission. The 1.4 GHz source counts show an upturn below a few mJy, above which AGN dominate and below which starburst galaxies dominate the counts (e.g. Windhorst et al. 1985, 1993). Sub-mJy sources may therefore have contributions from both, but extended radio emission is expected from starburst activity, and core-dominated emission from AGN. The radio morphology can therefore in principle be used to discriminate and quantify the AGN and starburst contributions. As mentioned above, none of the LBGs have been detected at 1.4 GHz and therefore no strong inferences can be made - only the relatively weak statement that there appear to be no radio-loud AGN in the sample. For the BBGs, one object is strong and clearly core-dominated at 20mas resolution (Garret et al. 2001). This is CXO/VLA J123646.3+621405 (=MFFN252), which we have already noted as the brightest X-ray source and a known AGN. Of the other two strong radio detections, one is marginally resolved and the other unresolved at 2 arcsec resolution. The other important inference from the radio is that the brightest BBGs in the X-ray are also the brightest in the radio, with the detections contributing similar percentages of the total flux in each band. If the bulk of the X-rays come from star-formation this is expected, as roughly speaking both fluxes should scale with the SFR of the galaxy (e.g. Condon 1992). In the AGN case this is not expected: the radio fluxes of standard QSOs have a bimodal distribution which is dominated by radio quiet AGN, so we do not expect bright X-ray sources necessarily also to be bright radio sources. The implication would be that the new population of obscured AGN revealed by Chandra have different radio properties to normal QSOs. The key test in the radio is to perform higher resolution radio imaging at sub-Jy levels. If the galaxies are typically resolved in the radio they are almost certain to be starbursts.
As discussed in section 4, in addition to being strong radio sources, the X-ray bright end of the BBG population stands out in other ways. For example, they tend to be ISO sources. This is again expected for starbursts, with the mid-IR following the SFR (e.g. Rowan-Robinson et al. 1997). This may also be expected for AGN, however, as the mid IR is thought to be emitted by dust heated by the active nucleus (e.g. Alonso-Herrero et al. 2001). They also have rather red near UV colors, and are among the brightest BBGs in the optical. All these properties point suggestively, if not conclusively, towards star formation: the brightest X-ray objects in the BBG sample also have the strongest star formation indicators.
The final and arguably most compelling argument for star formation comes from comparing the LBG and BBG samples. The mean UV luminosity of the LBGs in our sample ( at 1700Å rest-frame) is L⊙. The mean UV luminosity of the BBGs ( at 2000Å rest-frame) for our adopted cosmology is L⊙. Thus the LBGs are on average 4.6 times more luminous in the UV than the BBGs, reflecting the fact that they have star formation rates higher by roughly the same factor. When we subject the BBG sample to the same X-ray luminosity threshold as the stacked LBGs, the ratio of the X-ray luminosities of is remarkably similar to and entirely consistent with the ratio of the UV luminosities. In other words the ratio of the X-ray to UV luminosity, is the same at z=1 as at z=3. This very strongly implies that the X-ray emission follows the current star formation rate, as measured by the UV.
Although we cannot at this point be completely certain about the origin of the X-rays in the low galaxies, the evidence favors an origin in star-formation processes, rather than a dominant AGN contribution. We will therefore make this assumption for the purposes of discussing our results further.
5.2 Bright AGN in star-forming galaxies
The Lyman Break technique should select all objects that are bright enough in the UV to show the spectral break due to IGM absorption, regardless of whether the UV emission is from hot stars or, say, an AGN accretion disk. Selection of AGN from the LBG sample can therefore be based on the existence of high excitation lines in the UV spectra or by the detection of strong X-ray emission. We find four clear AGN in our sample of 148 LBGs - about 3%. Although the numbers are clearly very small at this point, this agrees rather well with the proportion of LBGs that show high excitation UV emission lines (2.6%; Steidel et al. 2002). This, and the fact that we detect no strong X-ray sources in LBGs which have no UV AGN signatures, suggests that there are no powerful AGN in the LBGs which are completely hidden in the UV. At first glance this is surprising, as Chandra observations have shown a large population of X-ray sources in galaxies with no obvious optical or UV AGN signatures (Mushotzky et al. 2000; Barger et al. 2001a; H01). It should be noted, however, that these “X-ray only” AGN tend to lie in galaxies that are either very faint in the optical (Mushotzky et al. 2000; Alexander et al. 2001) or are evolved bulge galaxies (e.g. Mushotzky et al. 2000; Cowie et al. 2001). The very faint optical sources would not have been picked up in the LBG survey and there may not have been enough time for massive bulge galaxies to evolve by z=3. Alternatively or additionally, these AGN may simply be too heavily obscured to be detected in the rest-frame UV in the LBG surveys. Therefore the AGN number counts derived from this work represent a lower limit, as there may be bright accreting black holes in galaxies which are too red or faint to be selected by the Lyman Break technique. Strenuous followup of detected X-ray sources in the HDF-N and other deep fields will show whether there is such a population. Indeed it has been suggested that X-ray emission may be used as a “signpost” to find relatively evolved galaxies at very high redshift (Cowie et al. 2001).
The AGN fraction in the LBGs also agrees roughly with the estimate of Barger et al. (2001b) on the basis of Chandra data, that at any given time 4% of galaxies are going through a luminous (X-ray) AGN phase. Certainly, we do not find any evidence that the LBGs are going through a more active period of radiatively-efficient black-hole accretion than galaxies at lower redshift, or galaxies that are not going through a period of extreme star formation. The connection between black holes and galaxy formation/evolution appears to be very strong, at least for massive galaxies in the local universe (Ferrarese & Merritt 2000; Gebhardt et al. 2000). One might therefore naively expect that the LBGs, which are the likely progenitors of these local galaxies and are in the process of forming a large fraction of their stars, should also be actively growing black holes (e.g. Page et al. 2001). This appears not to be the case, unless the accretion proceeds in a radiatively inefficient flow (e.g. Narayan & Yi 1994; Blandford & Begelman 1999). On the other hand, Shapley et al. (2001) have shown that the typical stellar mass of LBGs is . Assuming these form a future bulge, and using the local relation between black hole and bulge mass of approximately 0.2% (Merritt & Ferrarese 2001), we therefore expect them to host black holes of mass . The 2-10 keV luminosity of our detected AGN is erg s-1, and the bolometric luminosity of the AGN is therefore likely to be few erg s-1(Padovani & Rafanelli 1988; Elvis et al. 1994). They are therefore radiating at a relatively high fraction (%) of the Eddington limit.
Turning to the BBGs we find one very clear AGN, MFFN252 out of a sample of 95. This object is extremely bright in X-rays and shows optical broad lines and extremely compact radio emission. The other likely AGN in the sample is the object detected only in the Chandra hard X-ray band. This implies an AGN fraction similar to the LBGs, but any conclusions about the proportion of AGN in z1 starforming galaxies are considerably less robust. As these are selected on the Balmer break - a feature of the stellar SED - one could miss galaxies in which this feature was masked by strong AGN emission. Indeed H01 report as many as 9 additional identified X-ray sources (presumably AGN) in the redshift range in the HDF-N. However, these objects may simply have been excluded from the BBG sample due to the narrowness of the selection function, or because no spectroscopic redshift has yet been obtained. We await larger samples to clarify this issue.

There is good evidence that MFFN252 is absorbed in the X-ray both from the X-ray color and direct fitting (B01a), and this is also indicated by the X-ray color of the detected LBGs. The fact that there is significant obscuration is no great surprise, given the existence of dusty starburst gas in these galaxies. At least in MFFN252 we clearly see the broad emission lines, however, so it appears that while the nuclear X-rays are obscured, the broad line region is not. This is therefore more suggestive of obscuration close to the nuclear regions, perhaps which is relatively dust free. The local analogue is the “archetypal” Seyfert NGC 4151, which has strong optical and UV broad lines, but is heavily absorbed in the X-ray. Presumably the absorbing material in this object is either very close to the nuclear source (i.e. within the broad line region), or has very little dust, perhaps due to the fact that it is above the sublimation temperature. MFFN252 may therefore contain a “warm absorber” at high redshift.
5.3 Star-formation rates from the X-ray data
While a contribution from an AGN cannot be strongly ruled out, the vast majority of these high redshift starforming galaxies appear to have X-ray emission dominated by star-formation processes. As mentioned in the Introduction, X-ray emission in normal galaxies arises from the evolved stars - primarily LMXB - but in starburst galaxies it is mainly from systems involving massive stars. The LBGs in particular are not thought to contain any evolved stellar populations, and are almost certainly too young to have formed a large population of low-mass X-ray binaries, which have formation time scales of order 0.5-1 Gyr (White & Ghosh 1998 and references therein). Therefore the strong X-ray emission is much more likely to be associated with high-mass X-ray binaries and type II supernovae, perhaps further enhanced by hot diffuse gas and hot stars, associated with star-forming regions. In addition, many local galaxies are found to contain “superluminous” X-ray sources (e.g. Colbert & Mushotzky 1999; Kaaret et al. 2001; Fabbiano, Zezas & Murray 2001), which can account for a large fraction of the hard X-ray (2-10 keV) luminosity. There is suggestive evidence that these mysterious sources are located preferentially in starburst galaxies, and if so they are potentially a major contributor to the luminosity observed in our high redshift samples.
The typical luminosity of the LBGs of erg s-1 is much larger than that observed in normal galaxies at low redshift, by around two orders of magnitude. Furthermore, as we have already stated, the X-ray luminosity seems to scale with the UV luminosity to a high degree of accuracy. This strongly suggests that the hard X-ray luminosity follows the star formation: the LBGs are selected to be UV luminous and have much higher star formation rates than normal spirals in the nearby universe. The fact that we expect and observe more X-ray emission from galaxies exhibiting starburst activity suggests that one may be able to use the X-ray luminosity as a probe of the individual and global SFRs (Cavaliere et al. 2000; Menci & Cavaliere 2000). There is considerable uncertainty, however, about the formation and evolution of the stellar systems which produce X-rays, not least the “superluminous” sources mentioned above, and therefore there is no simple way of, say, turning an Initial Mass Function into an estimate of the instantaneous X-ray luminosity. We await further theoretical work in this area, and verification in local starburst galaxies. In the meantime, we adopt an empirical approach to estimating the star-formation rate in the LBGs.
David et al. (1992), have shown that there is a strong correlation between the 0.5-4.5 keV X-ray luminosity () and the FIR bolometric luminosity , in a large sample of IRAS-selected normal and starburst galaxies. As the FIR luminosity is an excellent indicator of the current star-formation rate (e.g. Leitherer & Heckman 1995; Kennicutt 1998) we can use the David et al. correlation to convert to SFR via the predicted . We predict an average FIR luminosity for the LBGs of L⊙, similar to that inferred by Adelberger & Steidel (2000). We can then convert to SFR using the expressions given in Kennicutt (1988) or the very similar one in Rowan-Robinson (2000). This crude method yields the following conversion:
where L41 is the 2-10 keV X-ray luminosity in units of erg s-1 for our adopted cosmology. Thus the X-ray luminosity of the LBGs corresponds to an SFR of M⊙ yr-1 for each LBG. The corresponding value for the BBGs is M⊙ yr-1. The errors given are statistical only. In practice systematic errors in the determination of the SFR and uncertainties in the various conversions dominate.
It is not currently possible to make an independent estimate of the global star-formation rate from the X-ray data alone. This would require determining the X-ray contribution from star forming processes from all detected sources at a given redshift and then correcting for incompleteness. As we cannot even directly detect individual star forming galaxies at z, much more sensitive X-ray data are needed. We can, however, use the X-ray data to make an estimate of the contribution of the UV-selected LBGs to the global SFR. The UV survey is in itself incomplete, but S99 have calculated the effective cosmological volume corrected for incompleteness in the UV sample. We can then use these estimates to derive the global SFR from the LBGs The corresponding estimate, along with those from other wavebands, is shown in Fig. 5. Note that this plot has been converted into our preferred cosmology (, , h=0.7) and therefore differs from most global SFR plots.
It can be seen that the X-ray estimate of the SFR at z=3 is far higher than the UV estimates uncorrected for extinction. They agree extremely well, however, with the extinction-corrected values of S99. The X-ray estimate is slightly higher, which may reflect larger UV extinction estimates as inferred by Adelberger & Steidel (2000). It should be noted that, of course, the point plotted in Fig. 5 does not represent a true X-ray estimate of the global SFR, as we have only considered the X-ray properties of the UV-selected LBGs. In one sense it represents a lower bound, as we cannot exclude the possibility that there are X-ray emitting, starforming galaxies that are too heavily obscured to be picked up in the LBG surveys. On the other hand, the X-ray estimate of the SFR does represent a validation of the extinction corrections presented by S99 and Adelberger & Steidel (2000). Alternatively, if we assume the extinction corrections are accurate, the agreement validates the conversion between X-ray luminosity and star formation rate and confirms that the contamination of the X-ray emission of the stacked LBGs by AGN is relatively minor (barring a conspiracy in which they cancel each other out). As already mentioned this conclusion is strongly supported by the fact that the ratio of the average UV luminosity - a primary SF indicator - to the X-ray luminosity is the same for rapidly starforming galaxies at and , despite a large difference in the absolute values.
Our data can also be used to estimate the average X-ray fluence at that originates from the Lyman break galaxies, which may be relevant to, e.g., models of He ii reionization, which occurs around this epoch (Kriss et al. 2001). Assuming a spectrum with extending from 0.1-100 keV, the total X-ray fluence is found to be erg cm-2 s-1 Mpc-1, around 75 per cent of which arises from the sources we have designated AGN, and around 25 per cent that we have attributed to star forming processes.
Our observations also indicate that, when considering the X-ray emission of high redshift starforming galaxies, the primary factor in determining the X-ray luminosity is the current star formation rate. As has been pointed out by White & Ghosh (1998) and further explored by Ghosh & White (2001) and Ptak et al. (2001), there is a secondary effect due to the long evolutionary time scale of LMXBs. Their prediction is that galaxies should exhibit enhanced X-ray emission Gyr after their major episode of star formation due to the “turn on” of the LMXB population. Indeed, the original galaxy stacking experiments of B01a and Hornschemeier et al. (2002) were in part intended to test this hypothesis, and in doing so these authors have explored the “evolution” of the ratio of the X-ray to B-band luminosity of spiral galaxies as a function of redshift. H02 in particular find a modest increase out to , which is consistent with the revised estimates of this effect given by Ghosh & White (2001). In the context of this model, our LBGs should show lower ratios than intermediate redshift galaxies, as there has not been sufficient time for the LMXB binary populations to evolve to produce X-rays. Performing such comparison with these heavily star-forming galaxies is rather difficult, however, as their blue light is completely dominated by massive, young stars. This may also be true of some of the higher redshift galaxies considered by H02. When making such comparisons it is therefore essential to consider the contributions (in all wavebands) of both young and evolved stellar populations. In our case it appears that the former completely dominate the X-ray emission.
Apparently the most extreme examples of the high redshift starburst phenomenon are the hyper-luminous IRAS galaxies and bright sub-mm sources discovered by SCUBA. Estimates of the individual SFRs are even higher than the LBGs, at M⊙ yr-1 or even higher (e.g. Rowan-Robinson 2000). Our analysis has shown a fairly strict scaling between the hard X-ray luminosity and star formation rate, and if this continues to the level of these extreme FIR galaxies we predict X-ray luminosities of erg s-1. Very few hyper-luminous IRAS galaxies have been observed sensitively in the hard X-ray, but several deep Chandra surveys have been undertaken of fields surveyed by SCUBA including the HDF-N. Bautz et al. (2000) have reported the detection of two gravitationally lensed sub-mm sources in the field of the cluster A370. They both have observed fluxes corresponding to luminosities of few erg s-1, and Bautz et al. argue that the intrinsic luminosities are probably much higher if they are absorbed. These objects probably host AGN responsible for much of the X-ray emission. On the other hand most SCUBA sources are rather weak X-ray sources (e.g. Fabian et al. 2000; Barger et al. 2001c; Almaini et al. 2002). Very deep X-ray data are required to reveal the X-ray emission from star formation, however, and it remains to be seen whether the correlation between and SFR is extended to these extreme FIR galaxies.
We stress that the above estimates of the SFR rely on the assumption that the stacked X-rays are primarily associated with star-forming processes. Although we have been able to exclude the brightest AGN contributions based on their X-ray luminosity, low-level AGN activity remains a possible contributor, particularly if AGN and starburst activity is co-eval (Page et al. 2001; Priddey & McMahon 2001).
5.4 Future prospects
Our work, and that of B01c and H02, has demonstrated that star forming galaxies at are significant X-ray sources. Indeed, it appears that these objects may dominate the X–ray number counts at faint fluxes. Miyaji & Griffiths (2002) have performed a fluctuation analysis of this same field, constraining the number counts, logN-logS, at very faint fluxes. At the level of detection of the stacked LBGs and BBGs erg cm-2 s-1, they find X-ray sources deg-2, albeit with a large uncertainty (range of ). Our stacking analysis indicates that at this flux level the LBGs and BBGs alone contribute 10,000 sources deg-2. When we consider that these sources occupy only small slices in redshift space, it seems almost certain that actively starforming galaxies such as these will dominate the X–ray number counts at faint fluxes (below erg cm-2 s-1). Future high sensitivity X-ray satellites such as XEUS and Generation-X will therefore detect them in very large numbers and, of course, will be able to define their individual properties, rather than the group properties we have described here. With the development of detailed population synthesis models for the X-ray sources this will allow independent estimates of both the individual and global SFRs from the X-ray data alone. As shown by Fig. 2, in order to avoid excessive contamination by background and galaxies outside the cell, a arcsec PSF is necessary to be able to detect these sources without suffering from confusion problems. This sets a minimum requirement for the spatial resolution of these future missions if they are to be able to detect and study high redshift starforming galaxies. To provide a clear distinction between AGN and starforming processes - which is necessary for a clean estimate of the SFRs from the X-ray data - it is necessary to resolve the X-ray emission from the star forming regions. Here the requirement is for arcsec resolution, based on the UV morphologies.
We have found several LBGs and at least one BBG which contain bright, nuclear X-ray sources, which are almost certainly AGN. If these objects are otherwise typical in terms of their star formation properties, the nuclear AGN X-rays can be used as a diagnostic tool with future high throughput, high spectral resolution data. Absorption of the X-rays in the starburst gas will present not only a measurement of the total column density (and therefore the gas mass), but absorption line spectroscopy can be used to determine the elemental abundances, kinematics etc. This too offers great potential for future X-ray satellites, beginning with Constellation-X.
References
- (1) Adelberger, K.L., Steidel, C.C., 2000, ApJ, 544, 218
- (2) Alexander, D.M., Brandt, W.N., Hornschemeier, A.E., Garmire, G.P., Bauer, F.E., Griffiths, R.E., 2001, AJ, 122, 2156
- (3) Almaini, O., et al., 2002, MNRAS, submitted
- (4) Alonso-Herrero, A., Quillen, A.C., Simpson, C., Efstathiou, A., Ward, M.J., 2001, AJ, 121, 1369
- (5) Awaki, H., Koyama, K., Inoue, H., Halpern, J.P., 1991, PASJ, 43, 195
- (6) Barger, A.J., Cowie, L.L., Richards, E.A., 2000, AJ, 119, 2092
- (7) Barger, A.J., Cowie, L., Mushotzky, R.F., Richards, E.A., 2001a, AJ, 121, 662
- (8) Barger, A. J., Cowie, L. L., Steffen, A. T., Hornschemeier, A. E., Brandt, W. N., Garmire, G. P., 2001b, ApJ, 560, L23
- (9) Barger, A.J., et al., 2001c, AJ, 122, 2177
- (10) Bautz, M., et al., 2000, ApJ, 543, L119
- (11) Blain, A.W., Jameson, I., Smail, I., Longair, M., Kneib, J.-P., Ivison, R., 1999, MNRAS, 309, 715
- (12) Blandford, R.D., Begelman, M.C., 1999, MNRAS, 303, L1
- (13) Brandt, W.N., et al., 2001a, AJ, 122, 1
- (14) Brandt, W.N., et al., 2001b, AJ, 122, 2810
- (15) Brandt, W.N., Hornschemeier, A.E., Schneider, D.P., Alexander, D.M.,Bauer, F.E., Garmire, G.P., Vignali, C., 2001c, ApJ, 558, L5
- (16) Campana, S.; Moretti, A., Lazzati, D., Tagliaferri, G., 2001, ApJ, 560, L19
- (17) Casertano, S., et al., 2000, AJ, 120, 2747
- (18)
- (19) Cohen, J.G., Hogg, D.W., Blandford, R., Cowie, L.L., Hu, E., Songaila, A., Shopbell, P., Richberg, K., 2000, ApJ, 538, 29
- (20) Cohen, J.G., 2001, AJ, 121, 2895
- (21) Colbert, E.J.M, Mushotzky, E.F., 1999, ApJ, 519, 89
- (22) Condon, J.J., 1992, ARAA, 30, 575
- (23) Connolly, A.J., Szalay, A.D., Dickinson, M., SubbaRao, M.U., Brunner, R.J., 1997, ApJ, 486, L11
- (24) Cowie, L.L., et al., 2001, ApJ, 551, L9
- (25) Cowie, L. L., Garmire, G. P., Bautz, M. W., Barger, A. J., Brandt, W. N., Hornschemeier, A., 2002, ApJ, 566, L5
- (26) Cowie, L.L., Songaila, A., Barger, A.J., 1999, AJ, 118, 603
- (27) David, L.P., Jones, C., Forman, W., 1992, ApJ, 388, 82
- (28) Della Ceca, R., Castelli., G., Braito, V., Cagnoni, I., Maccacaro, T., 1999, ApJ, 524, 674
- (29) Elvis, M., et al., 1994, ApJS, 95, 1
- (30) Fabian, A.C., et al., 2000, MNRAS, 315, L8
- (31) Fabbiano, G., 1989, ARAA, 27, 87
- (32) Fabbiano, G., Trinchieri, G., 1985, 296, 430
- (33) Fabbiano, G., Trinchieri, G., MacDonald, A., 1984, 284, 65
- (34) Fabbiano, G., Zezas, A., Murray, S.S., 554, 1035
- (35) Ferrarese, L., Merritt, D., 2000, 539, L9
- (36) Fomalont, E. B., Kellermann, K. I., Richards, E., Windhorst, R. A., Partridge, B. P. 1997, ApJL, 475, L005
- (37) Gardner, J.P., Brown, T.M., Ferguson, H.C., 2000, ApJ, 542, L79
- (38) Garrett, M. A., et al. 2001, A&A, 366, L5
- (39) Garrett, M. A., de Bruyn, A. G., Giroletti, M., Baan, W. A.; Schilizzi, R. T. 2000, A&A, 361, L41
- (40) Gebhardt, K., et al., 2000, ApJ, 539, L13
- (41) Genzel, R., et al., 1998, ApJ, 498, 579
- (42) Ghosh, P., White, N.E., 2001, ApJ, 559, L91
- (43) Giacconi, R., et al., 2001, ApJ, 551, 624
- (44) Giacconi, R., et al., 2002, ApJ, in press
- (45) Giavalisco, M., Steidel, C.C., Macchetto, F.D., 1996, ApJ, 470, 189
- (46) Green, P.J., et al., 1995, ApJ, 450, 51
- (47) Griffiths, R.E., Padovani, P., 1990, ApJ, 360, 483
- (48) Haehnelt, M.G., Kauffmann, G., 2000, MNRAS, 318, L35
- (49) Hasinger, G., et al., 1998, A&A, 329, 482
- (50) Ho, L., Fillipenko, A., Sargent, W.L., 1997, ApJ, 487, 568
- (51) Hornschemeier, A.E., et al, 2000, ApJ, 541, 49
- (52) Hornschemeier, A.E., et al, 2001, ApJ, 554, 742 (H01)
- (53) Hornschemeier, A.E., et al, 2002, ApJ, in press
- (54) Kaaret, P., et al, 2001, MNRAS, 321, L29
- (55) Kennicutt, R.S., 1998, ARAA, 36, 189
- (56) Kriss, G.A., et al., 2001, Sci, 293, 1112
- (57) Lanzetta, K.M., Yahil, A., Fernandez-Soto, A., 1996, Nature, 381, 759
- (58) Lehmann, I., et al., 2001, A&A, 371, 833
- (59) Leitherer, C., Heckman, T.M., 1995, ApJS, 96, 9
- (60) Lilly, S.J., Le Fevre, O., Hammer, F., Crampton, D., 1996, ApJ, 460, L1
- (61) Lowenthal, J.D., et al., 1997, ApJ, 481, 673
- (62) Madau, P., Ferguson, H.C., Dickinson, M.E., Giavalisco, M., Steidel, C.C., Fruchter, A., 1996, MNRAS, 283, 1388
- (63) Madau, P., Pozzetti, L., Dickinson, M.E., 1998, MNRAS, 498, 106
- (64) Menci, N., Cavaliere, A., 2000, MNRAS, 311, 50
- (65) Merrit, D., Ferrarese, L., 2001, MNRAS, 320, L30
- (66) Miller, C.J. et al., 2001, AJ, 122, 3492
- (67) Miyaji, T., Griffiths, R.E., 2001, ApJ, in press
- (68) Mobasher, B., Rowan-Robinson, M., Georgakakis, A., Eaton, N., 1996, MNRAS, 282, L7
- (69) Moran, E.C., Lehnert, M.D., Helfand, D.J., ApJ, 526, 649
- (70) Mushotzky, R.F., Cowie, L.L., Barger, A.J., Arnaud, K.A., 2000, Nature, 101, 159
- (71) Nandra, K., Pounds, K.A., 1994, MNRAS, 268, 405
- (72) Narayan, R., Yi, I., 1994, ApJ, 428, L13
- (73) Padovani, P., Rafanelli, P., 1988, A&A, 205, 53
- (74) Page, M.J., Stevens, J.A., Mittaz, J.P.D., Carrera, F.J., 2001, Science, 294, 2516
- (75) Priddey, R.S., McMahon, R.G., 2001, MNRAS, 324, L17
- (76) Ptak, A., Griffiths, R.E., White, N., Ghosh, P., 2001, ApJ, 559, L91
- (77) Richards, E. A., Kellermann, K. I., Fomalont, E. B., Windhorst, R. A., Partridge, R. B. 1998, AJ, 116, 1039
- (78) Risaliti, G., Maiolino, R., Salvati, M., 1999, ApJ, 522, 157
- (79) Richards, E. A. 2000, ApJ, 533, 611
- (80) Rosati, P., et al., 2002, ApJ, 566, 667
- (81) Rowan-Robinson, M., 2000, MNRAS, 316, 885
- (82) Rowan-Robinson, M., et al., 1997, MNRAS, 289, 490
- (83) Sanders, D.B., Soifer, B.T., Elias, J.H., Madore, B.F., Matthews, K., Neugebauer, G., Scoville, N.Z., 1988, ApJ, 325, 74
- (84) Sanders, D.B., Mirabel, I.F., 1996, ARAA, 34, 749
- (85) Shanks, T., Georgantopoulos, I., Stewart, G.C., Pounds, K.A., Boyle, B.J., Griffiths, R.E., 1991, Nature, 353, 315
- (86) Silk, J., Rees, M.J., 1998, A&A, 331, L1
- (87) Stark, A.A., Gammie, C.F., Wilson, R.W., Bally, J., Linke, R.A., Heiles, C., Hurwitz, M., 1992, ApJS, 79, 77
- (88) Steidel, C.C., Adelberger, K.L., Giavalisco, M., Dickinson, M., Pettini, M., 1999, ApJ, 519, 1 (S99)
- (89) Steidel, C.C., Hunt, M., Shapley, A., Adelberger, K., Pettini, M., Dickinson, M., Giavalisco, M., 2002, ApJ, in press
- (90) Steidel, C.C., Giavalisco, M., Pettini, M., Dickinson, M., Adelberger, K.L., 1996, ApJ, 462, L17
- (91) Steidel, C.C., Pettini, M., Hamilton, D., 1995, AJ, 110, 2519
- (92) Tozzi, P., et al., 2001, ApJ, 562, 42
- (93) Turner, T.J., Pounds, K.A., 1989, MNRAS, 240, 833
- (94) Ghosh, P., White, N.E., 2001, ApJL,
- (95) White, N.E., Ghosh, P., 1998, ApJ, 504, L31
- (96) Williams, R.E., et al., 1996, AJ, 112, 1335
- (97) Wilson, G., Cowie, L.L., Barger, A.J., Burke, D.J., 2002, AJ, submitted (astro-ph/0203168)
- (98) Windhorst, R.A., et al., 1985, ApJ, 289, 49
- (99) Windhorst, R.A., et al., 1993 ApJ, 405, 498
- (100) Zezas, A., Georgantopoulos, I., Ward, M.J., 1998, MNRAS, 301, 915