OBSERVATIONS OF THE X-RAY AFTERGLOWS OF GRB 011211 AND GRB 001025 BY XMM-NEWTON
Abstract
We present the XMM-Newton observations of X-ray afterglows of the -ray bursts GRB 011211 and GRB 001025. For GRB 011211 XMM detected fading X-ray object with an average flux in 0.2-10 keV declining from erg cm-2 s-1 during the first 5 ks of 27-ks observation to erg cm-2 s-1 toward the end of the observation. The spectrum of the afterglow can be fit to a power law with =2.160.03 modified for the Galactic absorption. No significant evolution of spectral parameters has been detected during the observation. Similar X-ray spectrum with =2.010.09 has been observed by the XMM from the GRB 001025. The non-detection of any extra absorption in these spectra above the Galactic value is an interesting fact and may impose restrictions to the favorable GRB models involving burst origin in star-forming regions. Finally we discuss soft X-ray lines from GRB 011211 reported by Reeves et al. and conclude that there is no definitive evidence for the presense of these lines in the spectrum.
Subject headings:
gamma-rays: bursts – X-rays: individual (GRB 011211, GRB 001025)1. Introduction
Cosmic bursts of gamma-rays are some of the most elusive and mysterious events in the Universe. Typical burst lasts less than a minute and disappears thereafter. However, since the BeppoSAX’s first discovery on 1997 February 28 (Costa et al. 1997) it is known that gamma-ray bursts (GRBs) also produce X-ray afterglows, which can be detected with modern X-ray observatories for several hours and sometimes several days after the burst. More than a few X-ray afterglows have been observed in last five years by BeppoSAX, ASCA and Chandra satellites. Several afterglow observations were carried out with XMM-Newton. In this Letter we report on two of the latter observations.
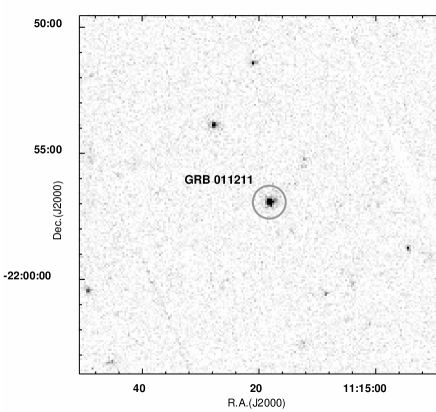
GRB 011211 was detected and localized in BeppoSAX WFC1 on 2001 December 11, 19:09:21 UT(Gandolfi 2001). The distinguishing features of GRB 011211 were its long duration (the longest event localized with BeppoSAX) and its faintness both in X- and -rays (Frontera et al. 2002). Grav et al. (2001) discovered a new point source in optical R-band (R19) at R.A.=11h15m17s.98, Dec=215656.2 (J2000, 1) identified as the afterglow of GRB 011211. Fruchter et al. (2001) and Gladders et al. (2001) measured the optical spectrum and found an absorption line system corresponding to a redshift of z=2.14. Later the optical transient was found to be superposed on an apparent host galaxy with R = 25.00.3 (Burud et al. 2001).
GRB 001025 was detected by the RXTE All-Sky Monitor on 2000 October 25 at about 03:10:05 UT (Smith et al. 2000). lasted approximately 15-20 s and reached a peak 5-12 keV flux of 4 Crab. Optical afterglow of GRB 001025 has never been detected down to R=24.5 for any significantly variable object (Fynbo et al. 2000).
2. XMM-Newton Observations and Data Analysis
The observation of GRB 011211 afterglow was started on 2001 December 12 at 06:16:56 UT (Santos-Lleo et al. 2001). A source was initially located so close to the edge of CCD#7 in EPIC-PN detector that some of the source photons were falling in the inter-CCD gap. Therefore, the telescope was re-pointed The re-pointing slew started at 08:31:16UT and finished at 08:40:50UT. Useful exposure of total observation is 27 ks.
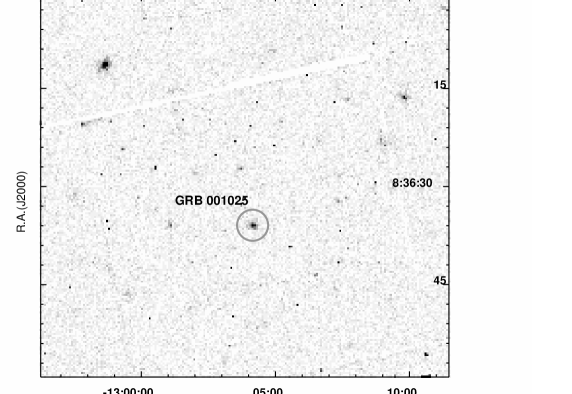
XMM-Newton observed the location of GRB 001025 from Oct.27.003 to Oct.27.46 UT, starting 1.9 days after the burst. Two X-ray sources were detected in the error box (Altieri et al. 2000). Below we discuss the brighter source (R.A.=8h36m35s.92, Decl.=-130409.9, J2000).
We analyzed data products from the two XMM-Newton observations. In all observations the EPIC instruments (Turner et al. 2001, Strueder et al. 2001) were operated in the full window mode ( diameter FOV). The medium optical blocking filter was used with MOS detectors for GRB 011211 observation. Thin filter was used with PN detector for GRB 011211 and with MOS detectors in GRB 001025 observation. No PN data were available for GRB 001025. We reduced EPIC data with the XMM-Newton Science Analysis System (SAS v.5.2)111See http://xmm.vilspa.esa.es/user. EPIC detectors data were fit together with common model parameters. The count rates were converted into energy fluxes using analytical fits to the spectra. We have used Galactic absorption values provided by the HEASARC222http://heasarc.gsfc.nasa.gov “nH” tool (Dickey & Lockman, 1990).
3. Results
3.1. GRB 011211
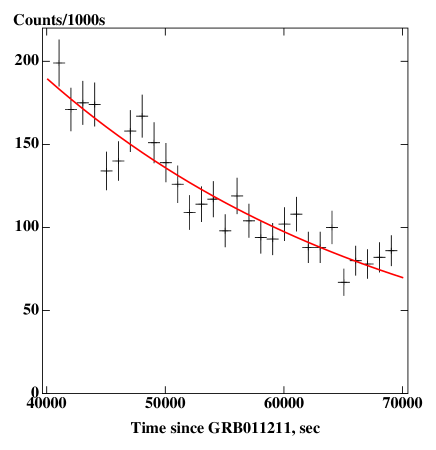
Central part of MOS1 detector (converted to celestial coordinates) is shown in Fig. 1a. The bright source in the middle of the image corresponds to the position of GRB 011211 optical afterglow. Significant X-ray flux decline during the observation (Fig. 1b) provides an additional evidence for an identification of the X-ray source with the GRB. X-ray light curve can be fit with Ft-β (=1.5-1.7) or with Fe-t/τ (=30.0.5 ks). Average measured flux in 0.2-10 keV band was equal to 1.710-13 erg/s/cm2. Extrapolating back to t=100 s since the initial detection of the burst we get an X-ray flux FX=510-9 erg/s/cm2 or X-ray afterglow luminosity LX=21050 erg/s (0.6-30 keV) in the rest frame at z=2.14 and a =65 km s-1Mpc-1, , cosmology. Spectrum of the GRB 011211 afterglow can be described as a simple power-law with photon index =2.160.03 modified by the Galactic absorption only (Fig. 2a). No significant spectral evolution has been found in a sequence of 5-ks intervals within the observation (Fig. 2b).
3.2. GRB 001025
We built the spectrum of the brightest source in error box of GRB 001025 (Fig. 3). Combined spectrum of two MOS detectors can be readily approximated by a power-law with photon index =2.010.09 and Galactic absorption value NH=61020 cm-2. Average flux from the source during the observation was 5.310-14erg/s/cm2. No significant flux variability was detected, but the spectrum is very typical for X-ray afterglows of GRB, supporting the identification of this source with GRB 001025.
It is interesting to consider an alternative identification of the X-ray source with a background quasar. An X-ray bright quasar 3C273 has a R magnitude of 12.5 (Odell et al. 1978) and the 0.5-10 keV X-ray flux of 2310-11 erg/cm2/s (Reeves & Turner 2000). Neglecting the K-correction and simply scaling the R magnitude to the X-ray flux we find that if a 3C273-like quasar is a source of the detected X-ray flux of 4.710-14 erg/cm2/s (0.5-10 keV) then its optical counterpart would have a R magnitude of 21.7. As in fact an optical counterpart for GRB 001025 had not been found down to R=24.5 (Fynbo et al. 2000) we consider unlikely that the X-ray source is an AGN.
4. Discussion
4.1. X-ray spectra of GRB afterglows
We have detected power-law spectra with index 2 from two GRB afterglows. In case of GRB 011211 an identification of the X-ray source with the GRB is supported by the observation of optical transient and also by the decline of X-ray flux during the XMM-Newton observation. For GRB 001025 we do not have such supporting evidence, but the spectral shape itself together with the position of X-ray source inside IPN/RXTE error box allows us to suggest that the source is indeed an afterglow of GRB 001025. Power-law fit with slope 2 is very typical for detected X-ray afterglows of GRBs (see e.g. Harrison et al. 2001, in’t Zand et al. 2001, Antonelli et al. 2000, ). We did not detect any significant changes in the X-ray spectrum during the long observation of GRB 011211. Afterglow of GRB 001025 was observed significantly later after the burst, and measured X-ray flux was much lower, but the spectrum was almost identical to GRB 011211. Conspicuously the X-ray spectra in all or most of the observed afterglows are generated by common physical process and do not depend much on the differences in the burst environments. Overall spectral shape can be fit to popular model of synchrotron emission with possible inclusion of inverse Compton scattering (Piran 1999; Granot & Sari 2002; Sari & Esin 2001).
No significant absorption above the Galactic values has been detected in the X-ray spectra. High absorption would be naturally expected if the burst occurs in a high-density star-forming region. Ramirez-Ruiz, Trentham & Blain (2002) suggested that high absorption in nearby (relative to the burst birthplace) interstellar media may be the reason for a lack of optical detections in a significant fraction of GRB. The absorption should be detectable in soft X-rays (0.5-2 keV). Contrary to such expectations, we did not detect any significant absorption above the Galactic value in both a GRB with optical afterglow (GRB 011211) and without it (GRB 001025). The lack of X-ray absorption in GRB 011211 is consistent with the lack of detected reddenning in the spectrum of optical afterglow (Simon et al. 2001).
4.2. On the spectral lines in GRB 011211
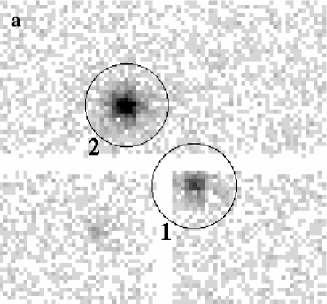
Reeves et al. (2002a, hereafter RWO) reported on the discovery of a blue-shifted line complex in the spectrum of GRB 011211. The lines have been detected only with PN detector and only during first 5 ks of the observation, with the source located close to the CCD chip boundary (Fig. 4a). We have extracted source and background spectra from the same regions as RWO (Reeves et al. 2002b). The spectrum can be satisfactory fit to power-law with =2.4 and NH = 8 1020 cm-2 (=1.03 for 44 d.o.f., Fig. 4b). Joint fit of PN, MOS1 and MOS2 data gives =0.92 (72 d.o.f.) for =2.150.06 and an absorption fixed at the Galactic value. Hence we are able to get the perfect fit using a simple power-law model we do not see much value in adding extra lines to the model. Addition of 5 lines at the energies specified by RWO gives =0.93 (62 d.o.f.) for joint fit of the PN and MOS data. The analysis of PN data alone allowed us to reproduce line fluxes reported by RWO with somewhat lower significance (Fig. 4c and Table 2). We note that the PN data should be treated with special caution for the first 5 ks of the observation because of the unfortunate position of the source on the CCD. In their analysis RWO collected source data from two different PN chips and from the areas near the interchip boundary, which are the least suitable for fine spectroscopy. Our extensive analysis showed that any alternative choice of extraction regions for the source and background leads to further reduction in the lines significance. We also found that background spectrum collected over the interchip edge is dominated by a strong feature at 0.7 keV, exactly at the energy of the most significant “line” reported by RWO (see Fig.4f). Though the bulk of the events forming this line are eliminated by the event filtering we are still concerned that some of these bad events may be present in the spectrum of GRB 011211. Our concern is amplified by the lack of any of the RWO “lines” in the PN spectrum after the reorientation (Fig.4d). Spectral evolution of the source in sync with satellite revolutions looks quite suspicious unless one suggests that presense of the “lines” depends on the position of the source on the chip. Such alternative hypothesis is further confirmed by a lack of “lines” in the MOS data (Fig. 4e). It may therefore be concluded that there is no definitive evidence for the presence of the line complex at a redshift of 1.88 in the X-ray spectrum of GRB 011211. The existence of such complex is a possibility, but its statistical significance is greatly overestimated by RWO. Our analysis suggests that the spectrum of GRB 011211 is featureless and does not contain any significant line emission.
References
- (1) Altieri, B., Schartel, N., Santos, M., Tomas, L., Guainazzi, M., Piro, L., Parmar, A. 2000, GCN Circ. 869
- (2) Antonelli, A., Piro, L., Vietry, M., et al. 2000, ApJ, 545, L39
- (3) Burud, I., Rhoads, J., Fruchter A., & Hjorth J., on behalf of GRACE (Gamma-Ray Afterglow Collaboration at Eso), 2001, GCN Circ. 1213
- (4) Costa, E., Frontera, F., Heise, J., et al. 1997, Nature, 387, 783
- (5) Covino, S., Ghisellini, G., Saracco, P., et al., 2002, GCN Circ. 1214
- (6) Dickey, J. M., & Lockman, F. J. 1990, ARAA, 28, 215
- (7) Frontera, F., Amati, L., Guidorzi, C., Montanari, E., Costa, E., Feroci, M., Piro, L., Heise, J., in’t Zand, J.J.M., 2002, GCN Circ. 1215
- (8) Fruchter, A., Vreeswijk, P., Rhoads, J., Burud, I., 2001, GCN Circ. 1200
- (9) Fynbo, J. P. U., Moller, P., Milvang-Jensen, B., Burud, I., Andersen, M. I., Pedersen, H., Jensen, B. L., Hjorth, J., Gorosabel, J. 2000, GCN Circ. 867
- (10) Gandolfi, G., on behalf of BeppoSAX Mission Scientist, 2001, GCN Circ. 1189
- (11) Gladders, M., Holland, S., Garnavich, P. M., Jha, S., Stanek, K. Z., Bersier, D., Barrientos, L.F., 2001, GCN Circ. 1209
- (12) Granot, J., Sari, R. 2002, ApJ, 568, 820
- (13) Grav, T., Hansen, M.W., Pedersen, H., Hjorth, J., Michelsen, R., Jensen, B.L., Andersen, M.I., Gorosabel, J., Fynbo, J.U., 2001, GCN Circ. 1191
- (14) Harrison, F.A., Yost, S.A., Sari, R., Berger, E., Galama, T., et al. 2001, ApJ, 559, 123
- (15) in’t Zand, J.J.M., Kuiper, L.M., Amati, L., Antonelli, L.A., Butler, R.C., et al. 2001, ApJ, 559, 710
- (16) Odell, S. L., Puschell, J. J., Stein, W. A., Owen, F., Porcas, R. W., Mufson, S., Moffett, T. J., Ulrich, M.-H. 1978, ApJ, 224, 22
- (17) Piran, T. 1999, Phys.Rep., 314, 575
- (18) Ramirez-Ruiz, E., Trentham, N., & Blain, A. W. 2002, M.N.R.A.S., 329, 465
- (19) Reeves, J. N., & Turner, M. J. L. 2000, MNRAS, 316, 234
- (20) Reeves, J. N., Watson, D., Osborne, J. P., Pounds, K. A., O’Brien, P. T. et al., 2002a, Nature, 416, L512 (RWO)
- (21) Reeves, J. N., Watson, D., Osborne, J. P., Pounds, K. A., O’Brien, P. T. 2002b, astro-ph/0206480
- (22) Santos-Lleo, M., Loiseau, N., Rodriguez, P., Altieri, B., and Schartel, N., 2001, GCN Circ. 1192
- (23) Sari, R., Esin, A.A. 2001, ApJ, 548, 787
- (24) Simon, V., Hudec, R., Pizzichini, G., Masetti, N., 2001, GCN Circ. 1211
- (25) Smith, D. A., Levine, A. M., Remillard, R., Hurley, K., Cline, T. 2000, GCN Circ. 861
- (26) Strueder, L. et al., 2001, A&A, L18
- (27) Turner, M. et al., 2001, A&A, 365, L27
| Time, ksa | Photon index | (d.o.f) | Flux (0.2-10 keV) |
|---|---|---|---|
| 10-13erg cm-2s-1 | |||
| 5 | 2.140.06 | 0.91 (74) | 2.69 |
| 5–10 | 2.170.07 | 1.23 (62) | 2.10 |
| 10–15 | 2.230.08 | 0.98 (45) | 1.55 |
| 15–20 | 2.090.08 | 1.11 (41) | 1.57 |
| 20–25 | 2.060.10 | 0.89 (35) | 1.37 |
| 25 | 2.150.12 | 1.06 (28) | 1.01 |
-
– from the start of EPIC-PN observation
| Line | Central | Flux/Significancec | Flux/Significancec | Redshift |
|---|---|---|---|---|
| IDb | energyb | in the PN data | in the PN + MOS data | Zb |
| keV | 10-15erg cm-2s-1 | 10-15erg cm-2s-1 | ||
| Si XIV | 0.700.02 | 11. / 3.0 | 6.5 / 2.1 | 1.86 |
| S XVI | 0.890.01 | 10. / 3.1 | 7.2 / 2.8 | 1.94 |
| Ar XVIII | 1.210.02 | 9.3 / 2.8 | 2.9 / 1.2 | 1.74 |
-
– data for three most significant lines are provided; the other two lines are less significant (Reeves et al. 2002a, b)
-
– adopted from Reeves et al. (2002a)
-
– with PN regions for source and background as in Revees et al. (2002b)