A Spectropolarimetric Atlas of Seyfert 1 Galaxies
Abstract
We present optical spectropolarimetry of the nuclei of 36 Seyfert 1 galaxies, obtained with the William Herschel and the Anglo–Australian Telescopes from 1996 to 1999. In 20 of these, the optical emission from the active nucleus is intrinsically polarized. We have measured a significant level of polarization in a further 7 objects but these may be heavily contaminated by Galactic interstellar polarization. The intrinsically polarized Seyfert 1s exhibit a variety of characteristics, with the average polarization ranging from to 5 per cent and many showing variations in both the degree and position angle of polarization across the broad H emission line. We identify a small group of Seyfert 1s that exhibit polarization properties similar to those of Seyfert 2 galaxies in which polarized broad-lines have been discovered. These objects represent direct observational evidence that a Seyfert 2-like far-field polar scattering region is also present in Seyfert 1s. Several other objects have features that can be explained in terms of equatorial scattering of line emission from a rotating disk. We propose that much of the diversity in the polarization properties of Seyfert galaxies can be understood in terms of a model involving both equatorial and polar scattering, the relative importance of the two geometries as sources of polarized light being determined principally by the inclination of the system axis to the line-of-sight.
keywords:
polarization – scattering – galaxies: active – galaxies: Seyfert1 Introduction
Spectropolarimetry has proved to be an important tool in the development of unified theories of active galactic nuclei (AGN). Its strength is that it provides an alternative view into the inner regions of the active nucleus, in addition to the direct line-of-sight. This allows us to probe the structure and kinematics of both the polarizing material and the emission source.
The discovery of polarized broad-line emission from the Seyfert 2 galaxy NGC 1068 (Antonucci & Miller 1985), prompted the suggestion that Seyfert Types 1 and 2 nuclei are intrinsically the same class of object viewed at different orientations. In the case of Seyfert 2s our direct view of the continuum source and broad emission line region (BLR) is blocked by an optically and geometrically thick torus. Antonucci & Miller (1985) proposed that the optical polarized flux spectrum of NGC 1068 can be explained as scattering by free electrons above the poles of the torus. Subsequent modelling (Miller, Goodrich & Matthews 1991; Young et al. 1995) has confirmed that scattering by free electrons in a conical region along the poles of the torus can successfully explain the observed optical and ultraviolet polarization characteristics of this source.
This basic polar scattering picture seems to be generally valid for Seyfert 2 nuclei. Since scattered light has an electric vector ( vector) position angle (PA) perpendicular to the scattering plane (the plane containing the incident and scattered ray), the polarized radiation has an vector perpendicular to the scattering cone axis. It seems reasonable to suppose that the principal axis of the system is defined by the rotation axis of the accretion disk and that the radio source axis, the torus and the scattering cone are co-aligned with this axis. Scattered light will then be polarized with its vector perpendicular to the axis of the radio source. Observations support this picture: in Type 2 Seyferts the optical polarization PA is almost always perpendicular to the projected radio source axis (e.g., Antonucci 1983; Brindle et al. 1990).
In contrast, the optical polarization properties of Type 1 Seyfert galaxies are not consistent with simple polar scattering. According to the Seyfert unified scheme Type 1’s are viewed much closer to the system axis than Type 2’s. Nevertheless, if only polar scatterers are present, Type 1’s should still be polarized perpendicular to the projected radio source axis. In fact, the optical polarization vector is more often aligned with this axis (Antonucci 1983, 1984, 2001; Martel 1996; M96). This implies that scattered light emerging from Type 1 nuclei follows a different path to that in Type 2’s, suggesting, in turn, that the simplest unification model geometry including only a single, polar scattering ‘mirror’, is incomplete. Evidently, we require an additional source of scattered light in Seyfert 1s in order to explain the alignment of the polarized light vectors with their radio axes. The location, structure and kinematics of this source are presently unknown. It is possible that in Seyfert 2s this component is hidden from view by the postulated torus or is entirely absent, though the latter case would conflict with the unified theory. Another possibility is that both scattering components are viewed directly but only one dominates the observed polarization in any given object, since the amount of scattered radiation that is polarized is aspect dependent.
The observations presented here are intended to provide a data set with which we can investigate the origin of the optical polarization in Type 1 Seyfert galaxies. There have been relatively few spectropolarimetric observations of Seyfert 1s in comparison to the extensive studies of Seyfert 2s. The first high signal-to-noise spectropolarimetric observations of Type 1 nuclei were carried out by Goodrich & Miller (1994; GM94). These authors studied the polarization of the broad H line and found a diversity of characteristics, including PA rotations across the line profile. They also pointed out that scattering in an optically thin disk, in the equatorial plane of the system, can produce optical polarization PA’s aligned with the radio axis, assuming that the latter is co-axial with the disk. M96 analysed the optical polarization of 7 Seyfert 1s by decomposing the total flux broad H line into several different velocity components and searching for geometrical relationships between the inferred polarizations of these components and morphological and dynamical features of the host galaxy. More recently, Schmid et al. (2000, 2001) have presented ESO VLT spectropolarimetry of 5 Seyfert 1 galaxies, including 3 that are also included in our sample. We have previously presented optical spectropolarimetric observations of Mrk 509 at 3 epochs, obtained as part of this programme (Young et al. 1999). We show that the polarization of the broad H line is variable on relatively short timescales, indicating that some of the scattering occurs in a compact region. The variable component also has an vector that is parallel to the small scale radio axis, consistent with an origin in a compact scattering region in the equatorial plane of the system. Further modelling, Young (2000), shows that altering the flux incident upon the scattering regions can produce the time variable polarization observed.
In this paper we present spectropolarimetric observations of 36 Type 1 Seyfert nuclei, obtained at the William Herschel telescope (WHT) and the Anglo–Australian telescope (AAT) between 1996 and 1999. In Section 2 the observations and data reduction procedures are described. The results are presented in Section 3 along with brief descriptions of the properties of the individual galaxies. In Section 4 we review the results and discuss their implications for the scattering regions, the BLR and the Seyfert unification scheme.
2 Observations and Data Reduction
A log of all observations is presented in Table 1.
2.1 AAT Observations
Observations were made at the 3.9-m AAT on the nights of 1996 August 24; 1997 May 30 & 31; 1997 August 2, 3 & 4. The Royal Greenwich Observatory spectrograph was used in conjunction with the waveplate modulator and a 10241024 pixel Tektronix CCD detector. The 270R (270 lines/mm) grating was used giving a wavelength range of 3460 allowing simultaneous coverage of H and H. The dispersion was 3.4 pixel-1. The slit width for the 1996 August observations was 1.5 and for the remaining observations it was 2.0. A two-hole dekker with 2.72.7 arcsec2 apertures separated by 27 was used, with the object located in one aperture and the other providing a sky measurement.
2.2 WHT Observations
Observations were made at the 4.2-m WHT on the nights of 1997 February
8 & 10; 1997 June 29; 1998 September 30 & October 1 & 2; 1999 June
17 & 18. The red arm of the ISIS dual beam spectrograph was used in
standard polarimetry mode with a 10241024 pixel Tektronix CCD
detector. For all observations, the R316R (316 lines/mm) grating was
used, giving a wavelength range of 1500 which,
when centered on the H line, allows coverage of its extended
wings and the adjacent continuum. The R316R grating has a dispersion
of 1.5 pixel-1. The slit width for 1997 February
& June was 1.0, for the remaining observations it was
1.2. A comb dekker was used to prevent overlapping of the 2
sets of spectra produced by the beam-splitting calcite slab. The
dekker apertures were 2.7 and separated by 18.
| Object | z | Telescope | Date | Exposure |
|---|---|---|---|---|
| (seconds) | ||||
| Akn 120 | 0.032 | WHT | 10/2/97 | 81000 |
| 30/9/98 | 4000 | |||
| 1/10/98 | 4000 | |||
| 2400 | ||||
| Akn 564 | 0.025 | WHT | 30/9/98 | 4000 |
| 2/10/98 | 3600 | |||
| ESO 012G21 | 0.030 | AAT | 4/8/97 | 61200 |
| ESO 113IG45 | 0.047 | AAT | 3/8/97 | 21200 |
| ESO 141G35 | 0.016 | AAT | 30/5/97 | 61200 |
| Fairall 51 | 0.014 | AAT | 4/8/97 | 41200 |
| IZw1 | 0.061 | AAT | 2/8/97 | 61200 |
| WHT | 30/9/98 | 24000 | ||
| 2/10/98 | 22400 | |||
| KUV 18217+6419 | 0.297 | WHT | 1/10/98 | 4000 |
| 2/10/98 | 24000 | |||
| Mrk 6 | 0.018 | WHT | 8/2/97 | 61600 |
| 2/10/98 | 4800 | |||
| Mrk 279 | 0.029 | WHT | 10/2/97 | 61000 |
| Mrk 290 | 0.030 | WHT | 17/6/99 | 4000 |
| 18/6/99 | 2800 | |||
| Mrk 304 | 0.066 | AAT | 30/5/97 | 41200 |
| 4960 | ||||
| Mrk 335 | 0.026 | WHT | 2/10/98 | 3600 |
| 2400 | ||||
| Mrk 509 | 0.034 | AAT | 24/8/96 | 61000 |
| 31/5/97 | 41200 | |||
| 2/8/97 | 41200 | |||
| Mrk 705 | 0.029 | WHT | 10/2/97 | 61200 |
| Mrk 841 | 0.036 | AAT | 30/5/97 | 81200 |
| Mrk 871 | 0.032 | AAT | 31/5/97 | 81200 |
| Mrk 876 | 0.129 | WHT | 29/6/97 | 4000 |
| Mrk 896 | 0.026 | AAT | 31/5/97 | 81200 |
| Mrk 915 | 0.024 | AAT | 4/8/97 | 81200 |
| Mrk 926 | 0.047 | AAT | 2/8/97 | 61200 |
| Mrk 985 | 0.031 | AAT | 24/8/96 | 81600 |
| MS 1849.27832 | 0.042 | AAT | 4/8/97 | 81200 |
| NGC 3516 | 0.009 | WHT | 10/2/97 | 41600 |
| NGC 3783 | 0.010 | AAT | 30/5/97 | 61200 |
| NGC 4051 | 0.002 | WHT | 17/6/99 | 2800 |
| NGC 4593 | 0.009 | WHT | 10/2/97 | 41600 |
| AAT | 31/5/97 | 61200 | ||
| NGC 5548 | 0.017 | WHT | 29/6/97 | 400 |
| 3800 | ||||
| NGC 6104 | 0.028 | WHT | 17/6/99 | 2000 |
| 18/6/99 | 2000 | |||
| NGC 6814 | 0.005 | AAT | 24/8/96 | 41000 |
| WHT | 29/6/97 | 1200 | ||
| 2400 | ||||
| NGC 7213 | 0.006 | AAT | 31/5/97 | 4720 |
| NGC 7469 | 0.016 | WHT | 29/6/97 | 400 |
| 2400 | ||||
| AAT | 3/8/97 | 41200 | ||
| WHT | 30/9/98 | 24000 | ||
| NGC 7603 | 0.030 | WHT | 29/6/97 | 2400 |
| PG 1211+143 | 0.081 | WHT | 8/2/97 | 31600 |
| UGC 3478 | 0.013 | WHT | 2/10/98 | 1200 |
| WAS 45 | 0.025 | WHT | 18/6/99 | 4000 |
2.3 Data reduction and calibration
The target sources and standard stars were observed using the standard spectropolarimetry procedure of taking equal exposures at half-wave plate angles of 0, 22.5, 45 and 67°.
Polarized standards were observed to determine the zero point of the polarization PA. Unpolarized standards were observed to check on the functioning of the system and the instrumental polarization. Observations of spectrophotometric standards were obtained to allow flux calibration of our spectra and the removal of atmospheric absorption features. Wavelength calibration was achieved via observations of CuAr or CuNe lamps.
Data reduction was performed using standard techniques within the Starlink packages tsp (Bailey 1997) and figaro (Shortridge et al. 1999). The relative intensities of the orthogonally polarized o and e rays are measured for each half-wave plate angle and combined using the tsp routine ccd2pol to obtain the Stokes I, Q and U parameters in each wavelength bin.
In most cases, multiple observations were made of each target. Those taken during the same observing run were combined to form average I, Q and U spectra from which the degree and position angle of polarization (hereafter denoted and , respectively) were calculated for each wavelength bin. We have also obtained observations of 7 objects during more than one observing run.
The average values of and for both the continuum and broad H line are listed in Table 2. Both and were calculated using the ptheta routine in the Starlink package polmap (Harries 1996). This sums the Stokes parameters over user-defined wavelength bins and then calculates the average and with their corresponding errors. For sources observed during different observing runs we list the measured polarizations at each epoch. The continuum polarization was measured from wavelength regions, both bluewards and redwards of H, considered to be uncontaminated by strong emission-lines. The exception is Mrk 6, for which the observations obtained in 1997 February had poor wavelength centring, allowing us to define a continuum range only on the red side of H. For consistency, the continuum polarization was also measured only on the red side of H for the 1998 October observations. In all cases where an object was observed at different epochs, the same wavelength ranges were used to measure the continuum polarization.
The average broad H polarization was measured, over the wavelength range given in Table 2, after first subtracting the continuum. Continuum subtraction can be carried out in a number of ways. One is to subtract the average, normalized continuum Q and U parameters from the line complex. This not only removes the continuum contribution to the measured polarization within the line profile but also any similar component of emission line polarization. This method was used by Young et al. (1999) to identify all the polarization components of the broad H emission line in Mrk 509. Here we adopt a different method, which retains all of the polarized broad-line flux, including that which is polarized like the continuum. The polarization of the broad H line was determined by fitting a first-order polynomial to the Stokes spectra (I, Q, U) using polmap. This fit was then subtracted from the polarization spectra to leave the intrinsic polarization of the H emission line complex. In either case, the diluting effect of starlight from the host galaxy is removed. The polarization spectra shown in Figs. 1–21 have not been corrected in this manner and therefore retain a polarized continuum and starlight contribution. However, Figs. 25 and Figs. 26 show the continuum-subtracted plots for Mrk 6 and Akn 120 respectively. For 4 objects, ESO 113IG45, NGC 3516, NGC 4593 (1997 February) and NGC 6104, the data do not have sufficient signal-to-noise to accurately subtract the continuum and hence it was not possible to measure the intrinsic broad H polarization.
| Object | Observing | Broad H | Galactic | Interstellar P | ||||||
| Run | Range () | Cont. | H | Cont. | H | E(B – V) | typical | max | ||
| (per cent) | (per cent) | (∘) | (∘) | (mag) | (per cent) | (per cent) | ||||
| Akn 120 | Feb 97 | 6600-7000 | 0.790.04 | 0.260.05 | 70.91.3 | 64.95.3 | 0.128 | 0.38 | 1.15 | |
| Oct 98 | 0.350.01 | 0.400.02 | 77.01.1 | 74.91.2 | ||||||
| Akn564 | Oct 98 | 6650-6800 | 0.520.02 | 0.340.05 | 87.01.3 | 92.53.9 | 0.060 | 0.18 | 0.54 | |
| ESO 012G21 | Aug 97 | 6710-6860 | 0.410.05 | 0.570.14 | 96.53.6 | 89.97.2 | 0.080 | 0.24 | 0.72 | |
| ESO 113IG45 | Aug 97 | 6650-7100 | 0.370.13 | 45.010.9 | 0.027 | 0.08 | 0.24 | |||
| ESO 141G35 | May 97 | 6550-7050 | 1.300.03 | 0.970.06 | 179.10.6 | 179.91.8 | 0.054 | 0.16 | 0.49 | |
| Fairall 51 | Aug 97 | 6500-6800 | 4.120.03 | 5.190.07 | 141.20.2 | 138.00.4 | 0.108 | 0.32 | 0.97 | |
| IZw1 | Aug 97 | 6875-7050 | 0.720.04 | 0.300.08 | 146.11.7 | 132.67.6 | 0.065 | 0.20 | 0.60 | |
| Oct 98 | 0.670.01 | 0.310.02 | 151.60.5 | 133.81.9 | ||||||
| KUV 18217+6419 | Oct 98 | 8350-8800 | 0.280.01 | 0.120.02 | 143.32.0 | 156.55.5 | 0.043 | 0.13 | 0.39 | |
| Mrk 6 | Feb 97 | 6500-6900 | 0.900.03 | 0.850.04 | 132.41.1 | 130.01.2 | 0.136 | 0.41 | 1.22 | |
| Oct 98 | 0.900.02 | 0.860.03 | 156.50.8 | 155.20.9 | ||||||
| Mrk 279 | Feb 97 | 6640-6880 | 0.480.04 | 0.200.06 | 58.92.4 | 120.37.8 | 0.016 | 0.05 | 0.14 | |
| Mrk 290 | Jun 99 | 6600-6900 | 0.900.04 | 0.400.05 | 157.51.1 | 154.53.8 | 0.015 | 0.05 | 0.14 | |
| Mrk 304 | May 97 | 6700-7200 | 0.510.04 | 0.720.07 | 135.52.5 | 123.32.9 | 0.073 | 0.22 | 0.66 | |
| Mrk 335 | Oct 98 | 6600-6850 | 0.280.01 | 0.520.02 | 113.61.7 | 104.51.2 | 0.035 | 0.11 | 0.32 | |
| Mrk 509 | Aug 96 | 6600-7000 | 0.850.03 | 0.460.03 | 151.80.9 | 145.31.6 | 0.057 | 0.17 | 0.51 | |
| May 97 | 0.700.04 | 0.410.03 | 141.41.5 | 148.22.4 | ||||||
| Aug 97 | 0.550.03 | 0.460.04 | 139.02.0 | 145.02.5 | ||||||
| Mrk 705 | Feb 97 | 6685-6850 | 0.460.07 | 0.410.11 | 49.36.5 | 84.07.5 | 0.041 | 0.12 | 0.37 | |
| Mrk 841 | May 97 | 6640-7000 | 1.000.03 | 0.360.06 | 103.41.0 | 98.04.6 | 0.030 | 0.09 | 0.27 | |
| Mrk 871 | May 97 | 6600-7000 | 0.300.04 | 0.650.13 | 84.23.7 | 90.35.8 | 0.055 | 0.17 | 0.50 | |
| Mrk 876 | Jun 97 | 7050-7740 | 0.810.04 | 0.360.06 | 110.51.4 | 112.44.6 | 0.027 | 0.08 | 0.24 | |
| Mrk 896 | May 97 | 6600-6800 | 0.270.03 | 0.230.11 | 62.03.0 | 66.913.0 | 0.045 | 0.14 | 0.40 | |
| Mrk 915 | Aug 97 | 6580-6860 | 0.250.03 | 0.470.07 | 105.43.7 | 94.73.9 | 0.063 | 0.19 | 0.57 | |
| Mrk 926 | Aug 97 | 6550-7070 | 0.180.04 | 0.200.06 | 44.86.4 | 31.88.8 | 0.042 | 0.13 | 0.38 | |
| Mrk 985 | Aug 96 | 6500-7100 | 1.120.02 | 0.610.03 | 114.30.4 | 98.81.5 | 0.048 | 0.14 | 0.43 | |
| MS 1849.27832 | Aug 97 | 6680-6980 | 1.640.06 | 1.450.16 | 7.01.1 | 19.43.1 | 0.152 | 0.46 | 1.37 | |
| NGC 3516 | Feb 97 | 6500-6740 | 0.150.04 | 30.18.0 | 0.042 | 0.13 | 0.39 | |||
| NGC 3783 | May 97 | 6500-6760 | 0.520.02 | 0.220.03 | 135.51.0 | 115.83.7 | 0.119 | 0.36 | 1.07 | |
| NGC 4051 | Jun 99 | 6520-6640 | 0.550.04 | 0.470.09 | 82.81.8 | 79.94.7 | 0.013 | 0.04 | 0.12 | |
| NGC 4593 | Feb 97 | 6480-6800 | 0.140.05 | 109.510.8 | 0.025 | 0.08 | 0.23 | |||
| May 97 | 0.140.03 | 0.570.05 | 149.95.1 | 143.22.3 | ||||||
| NGC 5548 | Jun 97 | 6520-6860 | 0.690.01 | 0.200.02 | 33.20.5 | 67.32.4 | 0.020 | 0.06 | 0.18 | |
| NGC 6104 | Jun 99 | 6560-6930 | 0.440.12 | 119.58.1 | 0.019 | 0.06 | 0.17 | |||
| NGC 6814 | Aug 96 | 6460-6740 | 1.880.04 | 1.630.12 | 162.50.6 | 165.92.1 | 0.183 | 0.55 | 1.65 | |
| Jun 97 | 1.860.03 | 1.710.07 | 2.20.4 | 1.81.2 | ||||||
| NGC 7213 | May 97 | 6530-6740 | 0.090.02 | 0.200.17 | 146.07.6 | 79.923.9 | 0.015 | 0.05 | 0.14 | |
| NGC 7469 | Jun 97 | 6560-6800 | 0.180.01 | 0.060.02 | 76.81.7 | 102.110.6 | 0.069 | 0.21 | 0.62 | |
| Aug 97 | 0.220.03 | 0.040.05 | 76.23.0 | 101.834.9 | ||||||
| Oct 98 | 0.090.01 | 0.110.02 | 87.34.5 | 95.26.0 | ||||||
| NGC 7603 | Jun 97 | 6500-6980 | 0.250.04 | 0.250.04 | 132.71.8 | 136.44.2 | 0.046 | 0.14 | 0.41 | |
| PG 1211+143 | Feb 97 | 6960-7220 | 0.270.04 | 0.110.06 | 137.74.5 | 112.115.8 | 0.035 | 0.11 | 0.32 | |
| UGC 3478 | Oct 98 | 6580-6710 | 0.840.06 | 1.100.10 | 22.12.2 | 19.72.6 | 0.092 | 0.28 | 0.83 | |
| WAS 45 | Jun 99 | 6660-6830 | 0.770.06 | 2.460.18 | 165.12.0 | 144.02.2 | 0.018 | 0.05 | 0.16 | |
3 Results


Before discussing the results, we must consider the possibility of contamination by foreground interstellar polarization produced in the Galaxy by aligned dust grains along the lines-of-sight to the target source. Estimates of the line-of-sight polarization induced by the interstellar medium can be obtained from the empirical relationship between extinction, E(BV), and percentage polarization established by Serkowski, Mathewson & Ford (1975). For typical conditions the percentage polarization induced is 3E(BV), whilst the maximum observed is 9E(BV), the latter presumably being produced by highly aligned dust grains. In Table 2 the E(BV) from the reddening estimate of Schlegel, Finkbeiner & Davis (1998) as listed in NED, is given for each object, along with the corresponding typical and maximum induced polarizations.
Interstellar polarization may also occur in the galaxy hosting the AGN and the effects of this are more difficult to assess. However, since interstellar polarization varies weakly with wavelength we can conclude that the detection of significant PA rotations or changes in the degree of polarization across a relatively short wavelength range (e.g., across an emission line), indicates that the polarization is at least partly intrinsic to the AGN.
The unpolarized starlight from the host galaxy affects our measurements by diluting the intrinsic polarization of the AGN. Additionally, the level of starlight contribution may not be constant across the wavelength range of our data and can lead to an apparent increase in polarization to shorter wavelengths, as noted in Section 4.3. As discussed in Section 2.3, removal of the continuum also removes the diluting effect of the starlight across the H complex.
When available, published radio maps were used to determine the radio source PA in those objects whose radio source is extended along a preferred axis. In the absence of a published measurement, the PA was determined by eye to a precision of . In several cases, we use PA’s from unpublished maps which are quoted in the literature. In Section 3.1 we give an indication, for each source, of the spatial scale to which the radio axis PA applies. Angular distances were converted to parsecs using a Hubble constant of 75 km s-1Mpc-1.
We have measured significant intrinsic polarization in 20 objects. Our observations of these objects are presented in Section 3.1. The polarization spectra are shown in Figs. 1–21. The polarized flux, percentage polarization and PA are binned in wavelength such that the error per bin in percentage polarization is constant at the values given in the Figure caption. In Section 3.2 we discuss the observations of objects which may be significantly contaminated by interstellar polarization, or which are of poor signal-to-noise.
3.1 Objects exhibiting intrinsic polarization
3.1.1 Akn 120
We observed Akn 120 at two epochs separated by 20 months (Fig. 1), during which time a change in the polarization properties occured. The 1998 October observations are of better quality and show that, while the core and red wing of the broad H profile are polarized at a similar level to the continuum, the blue wing exhibits a distinct peak in . This also appears as a blue-shifted feature in the polarized flux spectrum. In our 1997 February observations both line wings are polarized at a similar level to the continuum but there is a decrease in over the line core. During the period between the two observations the continuum polarization decreased by a factor of 2 whilst the average polarization of the broad H line increased from 0.260.05 per cent to 0.400.02 per cent.
A PA rotation across the broad H line is seen at both epochs. Bluewards of the line peak, is slightly lower than in the continuum but a 50 rotation to a higher value occurs over the red side of the profile. In the continuum-subtracted spectra exhibits a swing of 80 across the line profile (Fig. 26).
The optical polarization of Akn 120 has also been studied by M96 and more recently, by Schmid et al. (2000). M96 observed Akn 120 several times between October 1993 and February 1995 and reports considerable variation between epochs. He found that for the continuum around H, per cent and , whilst for the broad H line itself, per cent and . The polarization structure across the broad H line present in our 1997 February data is consistent with similar structure seen by M96. Schmid et al. observed Akn 120 in 1999 August, about 10 months after our second run. Their results, however, are more consistent with our earlier observations: they measure and for the continuum and per cent with for the broad H line, respectively. The and spectra are also broadly comparable to our 1997 February data (although the fine structure present in Schmid et al.’s VLT data is not seen in our relatively noisy spectra). The large change in the percentage polarization spectrum that occured between our 1997 February and 1998 October observations had evidently been reversed by the time of Schmid et al.’s observation, the spectrum having reverted to something close to its 1997 February form.
Condon et al. (1998) present a 1.4 GHz VLA map showing a slight elongation in PA , extending (6.1 kpc) from the radio core. Most of the blue side of H is polarized at , approximately parallel to the radio axis, but most of the red side has a PA .
3.1.2 Akn 564
This source is a well-known narrow-line Seyfert 1 galaxy (NLS1).
Our spectrum (Fig. 2) shows a decrease in in the blue wing of the broad H line whilst the red side of the profile is polarized at approximately the continuum level. There is also a decrease in near the line centre, which is probably due to weakly polarized narrow H.
The optical polarization of Akn 564 has been studied by Goodrich (1989b), who measured a continuum polarization of per cent at a PA of and concluded that the polarization was probably interstellar in nature. The estimated E(BV) of 0.060 suggests that interstellar polarization may be significant, but the decrease in over H indicates that this source is in fact intrinsically polarized.
Moran (2000) presents a 3.6 cm VLA map of Akn 564, which shows a small scale ‘jet-like’ feature extending (480 pc) from the radio core in PA . The average values of for both the continuum and broad H line differ by from the radio axis.


3.1.3 ESO 141G35
ESO 141G35 exhibits a constant value of over the spectral range covered by our observations (Fig. 3). The continuum is polarized at a level of per cent but decreases to a broad minimum in the core of the broad H line. There is a suggestion that the blue wing of broad H is extended in polarized flux.
3.1.4 Fairall 51
Fairall 51 is by far the most highly polarized source in our sample, exhibiting average continuum and H polarizations of 4 and 5 per cent, respectively. Moreover, rises gradually to the blue, increasing from per cent near H, to over 7 per cent at 4400 (Fig. 4). There are also local increases in over both the broad H and H lines. Sharp dips in are associated with the narrow [O iii] lines and with the narrow-lines in the H complex.
Schmid et al. (2001) observed this source with the VLT in 1999 August (2 years after our observation) and obtained very similar results.
3.1.5 I Zw1
I Zw1, the archetypal NLS1, was observed at 2 epochs and displayed similar polarization characteristics on both occasions (Fig. 5).
The percentage polarization spectrum shows a decrease in over the broad H line and in the higher signal-to-noise 1998 September data there is also evidence for similar decreases associated with emission features at observed wavelengths of 6229, 6248 and 6623. These features can be identified as emission-lines of He i 5876, Na i 5889.9, 5895.9 and Fe ii respectively (e.g., Phillips 1976).
A small change in is evident over the broad H line, giving it a lower average value than the continuum. In the continuum-subtracted spectra there is a 40 PA rotation from the blue to the red side of the line.
Kellerman et al. (1994) present a 6 cm VLA radio image of I Zw1 which shows an asymmetric structure with several contours elongated at a PA of 320 on a scale of 30 (34 kpc). Both the continuum and broad H line have average polarization PA’s approximately parallel to this elongation.
3.1.6 KUV 18217+6419
This quasar is weakly polarized, but exhibits significant changes in percentage polarization and PA over the spectral range covered by our data (Fig. 6).
The most notable feature is a 70 PA rotation on the red side of the broad H profile. The bulk of the line is polarized at a level similar to that of the continuum, but there is also a significant increase in associated with the far blue wing. As a result, the polarized flux profile appears to have an extended blue wing, whilst the total flux profile is asymmetric in the opposite sense.
Blundell & Lacy (1995) present an 8 GHz VLA map showing 2 components, possibly associated with jets, straddling the radio core in PA , and further extended emission in PA . The ‘jets’ are separated from the core by (4.95 kpc). On larger scales, there is an additional feature extending (9.9 kpc) from the core in PA . This latter feature may be associated with the southern ‘jet’ component. The average values of for the broad H line and adjacent continuum differ from the PA of the radio ‘jet’ component by and , respectively. However, the average line and continuum values are similar to the PA of the larger scale radio axis.
3.1.7 Mrk 6
Mrk 6 displays a highly asymmetrical broad H profile and unusually strong and broad ‘narrow’ lines.
We have obtained optical spectropolarimetry of Mrk 6 at two epochs separated by 20 months (Fig. 7). At both epochs, striking variations across the broad H line in both degree and position angle of polarization are present. In the continuum per cent but rises steeply to separate peaks at about 1.5 per cent in both the red and blue wings of the line profile. Conversely, drops sharply through the line core to a minimum of per cent. In the polarized flux spectrum the H profile has an asymmetric double-peaked structure, the red peak being the more prominent. The structure in the percentage polarization spectra is very similar to that seen in Mrk 509 (Young et al. 1999; this paper, Fig. 12).
The polarization PA also varies significantly across the H profile. In the line core and red wing, is slightly smaller than in the continuum but there is a rotation over the blue side of the profile. In the continuum-subtracted spectra the amplitude of the PA swing is (Fig. 25).
The average levels of polarization are similar at both observation epochs, as are the general forms of the structure in both the and spectra. However, the average values of for the two epochs differ by . We believe that this shift is due to instrumentation problems affecting the 1997 February (first epoch) observations. Therefore, in subsequent discussion we will use the average polarization PA’s measured from the 1998 October data.
A 6 cm MERLIN radio map presented by Capetti et al. (1995) shows that the inner (140 pc) of the radio structure has a linear, ‘jet-like’, morphology consisting of 3 components aligned along PA . Beyond from the central radio component, the jet widens and bends to the west. The average values of for the continuum and broad H line differ from jet PA by . In the continuum-subtracted polarization spectrum the H E vector rotates from to . This swing in polarization PA is largely confined to the blue side of the line profile and is roughly centred on the PA of the radio axis.


(c) 1997 August (Epoch 3).

3.1.8 MRK 279
Mrk 279 is polarized at about 0.5 per cent, but shows a significant decrease in through the broad H line (Fig. 8). There is also a sharp change in over the line, which results in a large difference () between the average values for the line and continuum.
There are no published radio maps of this source. However, Ulvestad & Wilson (1984a) report that a 6 cm VLA map shows a resolved radio source with an axis in PA . The average values of for the continuum and broad H line both differ by from this PA but in opposite senses, the continuum and line having polarization PA’s lower and higher than the radio PA respectively. In the continuum-subtracted polarization spectrum, is approximately constant over the H line at .
3.1.9 MRK 290
The continuum of Mrk 290 is about 1 per cent polarized. The degree of polarization decreases strongly through the broad H line but there is no significant change in across the spectrum (Fig. 9).
M96 studied the optical polarization of Mrk 290 in 1994 April. He found similar continuum polarization (1.03 per cent in PA ) and his data also show a decrease in associated with the H line. However, he measured an average broad H polarization of only 0.10 per cent, rather lower than our value of 0.400.05 per cent.
The radio source of Mrk 290 is unresolved in a 5 GHz radio map obtained by Kellerman et al. (1994).


3.1.10 MRK 304
The broad H and H lines in Mrk 304 both display prominent shoulders redwards of the line peak.
The percentage polarization spectrum shows structure across the broad H line similar to that seen in Mrk 6 and Mrk 509 (Fig. 10). The polarization increases from the continuum level ( per cent) in the line wings but decreases to below that level through the line core. The polarization error bins are wider at the blue end of the spectrum but there is a hint that similar structure is present in H. After continuum subtraction, the broad H line has a higher average degree of polarization than the continuum. This appears to be largely due to the increase in the line wings. There is also a PA change of across the blue wing of the line.
M96 studied the optical polarization of Mrk 304 at various epochs. His August 1994 Keck observations show a continuum polarization of 0.6 per cent at a PA of 132∘ and an average broad H polarization of 0.62 per cent at a PA of 121∘. Our measurements are consistent with these results.
M96 cites a private communication from Neff, reporting that in a 6 cm VLA map Mrk 304 has a double radio nucleus separated by 1.4 (1.7 kpc) along a PA of 42. The average polarization PA’s for both the continuum and broad H are approximately orthogonal to the radio axis.
3.1.11 MRK 335
Mrk 335 has been described as a ‘marginal’ NLS1 (Giannuzzo et al. 1998).
The continuum is weakly polarized at about 0.3 percent but increases significantly over the broad H line (Fig. 11). The most prominent feature is a distinct peak in polarization ( per cent) in the blue wing of the line. This feature appears to be associated with a sharp swing in , by with respect to the value in the line core, which itself is polarized at a slighly smaller angle than the adjacent continuum. Unusually for an object that exhibits a PA rotation, there is no decrease in polarization through the line core.
3.1.12 MRK 509
Our observations of Mrk 509 have been discussed in detail by Young et al. (1999) and are presented here for completeness. The percentage polarization spectra exhibit structure similar to that seen in Mrk 6 and Mrk 304. At all 3 observation epochs increases above the continuum level in the broad H line wings but decreases below that level at the line core (Fig. 12). A small rotation in is evident over the line profile.
Schmid et al. (2000) observed Mrk 509 in 1999 August, 2 years after our last (1997 August) observation of this source. Their average polarization measurements are consistent with ours: for the H line they find per cent with and for the continuum, with . Their spectra also show similar variations in and across the H profile.
Singh & Westergaard (1992) present a 6 cm VLA map showing elongations on opposite sides of the radio core along a PA of . These ‘jets’ extend (650 pc) from the radio core. The average values of for the broad H line and adjacent continuum differ by from the ‘jet’ PA. At longer wavelengths (20 cm) Singh & Westergaard observe radio emission extending over (1.3 kpc) along PA .
3.1.13 MRK 841
This object also exhibits significant polarization structure across the broad emission-lines (Fig. 14). Broad minima in are associated with both the H and H lines and there appears to be a similar dip corresponding to the He i line. In addition, both H and H exhibit distinct peaks in associated with their blue wings at approximately the same velocity shift from the line peak. However, there is no clear evidence for a corresponding polarization peak on the red side of the broad H line, as is seen in Mrk 509 and other sources.
The strong narrow lines (e.g., [O iii] ) also appear to depolarize the continuum.
3.1.14 MRK 876
Mrk 876 is an extremely disturbed system with a double nucleus, tidal tails extending over (85 kpc) and a spiral companion (Hutchings & Neff 1992). The H line is extremely broad; its wings extending beyond [S ii] 6716, 6731 in the red and [O i] 6300 in the blue.
There is a decrease in over the broad H line, predominantly to the blue of the line peak. There is also a swing in of across the line, with the blue wing having a slightly larger, and the red a smaller, value than the adjoining continuum (Fig. 15).
Kellerman et al. (1994) present a 6 cm VLA map showing that the radio source has faint extensions out to (2.3 kpc) either side of the core in PA . The average polarization PA’s for the continuum and broad H line differ from the radio axis PA by .
3.1.15 MRK 985
In the polarization spectrum both broad H and H lines show decreases in relative to the continuum (Fig. 16). Sharp dips in are also associated with the narrow [O iii] lines. There is a suggestion of an increase in polarization associated with the blue wing of H but no such feature is present in H. In the continuum, there is a slow increase in towards the blue end of the spectrum.
There is a clear PA rotation of from red to blue across the broad H profile, the blue and red wings having values of lower and higher than the adjoining continuum respectively.
3.1.16 MS 1849.27832
The data for this object are relatively noisy. However, there appears to be a PA rotation on the red side of the broad H line. There is also some evidence for a reduction in polarization over the core of the H feature but this may be due to narrow-line region emission (Fig. 17).


3.1.17 NGC 3783
The percentage polarization spectrum shows a peak associated with the blue wing of the broad H line but decreases sharply through the core of the line. There is also a dip in corresponding to the [O iii] lines (Fig. 18).
The polarization PA changes sharply in the core of broad H line (by ) as a consequence of which, the average value of for the broad H line differs from that of the continuum by . The change in associated with the strong [O iii] line suggest that the narrow-lines are polarized at a different PA to that of the continuum. Some, but probably not all, of the PA change over H may, therefore, be due to the blended narrow lines (the narrow component of H and the [N ii] doublet. There is a suggestion that the wings of the broad H line have a slightly larger value of than the continuum.
Although the spectrum is relatively noisy in the blue, the broad H line appears to have polarization properties similar to those of H.
3.1.18 NGC 4593
We observed NGC 4593 at two epochs separated by days (Fig. 19). The data obtained in our 1997 May observations cover a wider spectral range and are of much higher quality than our 1997 February data. The May data show that increases strongly to the blue in the continuum. The broad H line is much more highly polarized ( per cent) than the adjacent continuum, for which per cent at the red end of the spectrum. The peak in associated with H is blue-shifted relative to the line peak. There is also an apparent increase in at around , which is perhaps associated with the broad He i 5876 line, but this feature is sensitive to the error binning and may, therefore, be spurious.
The blue-shifted polarization peak associated with H is also clearly present in our poorer quality 1997 February data. The average continuum polarization measured from these data is consistent with the second epoch. It is not possible to compare the broad H polarizations for the two epochs since we were unable to perform a satisfactory continuum subtraction for the earlier data.
3.1.19 NGC 5548
Our data show that the broad H line is polarized at a much lower level than the adjacent continuum (Fig. 20). Indeed, the degree of polarization in the broad H line is one of the lowest that we were able to measure in our sample. There is a sharp drop in on the blue side of the line and a gradual increase over the core and red wing back to the continuum level. The sharp drop produces a corresponding dip in the polarized flux profile which, as a result, appears to show an isolated component in the blue wing.
The polarization PA spectrum displays unusual structure across the broad H line. There are two separate PA swings, each of about 40 relative to the continuum, in the blue and red sides of the line profile. These excursions are separated by a narrow interregnum, just bluewards of the line peak, in which the value of is comparable to that of the continuum. It seems unlikely that this is due to contamination by narrow-line emission polarized at a different PA, since it does not coincide in wavelength with the narrow component of the H line, the strongest of the blended narrow-lines.
Data obtained by M96 show similar features, including the changes in and the separate blue-shifted structure in the polarized flux profile (as do data obtained by GM94). M96 observed NGC 5548 at 3 epochs and found the continuum near H to be polarized at between 0.65 and 0.48 per cent whilst H itself was polarized at between 0.17 and 0.24 per cent. GM94 observed this object at 2 epochs and found no variation in the average polarization, which they measured to be 0.67 per cent at a PA of 45.4 over the wavelength range . Our polarization measurements are consistent with these earlier results.
Wilson and Ulvestad (1982) present 4885 and 1465 MHz VLA maps showing lobes of radio emission extending (1.6 kpc) to either side of an unresolved core in PA . The average value of for the continuum differs by from the radio axis PA whereas the average polarization PA for the broad H line is approximately orthogonal to the radio axis.
3.1.20 Was 45
In this Seyfert 1.8, the broad component of the H line is relatively weak compared to the narrow-lines. However, the broad component has a significantly higher polarization than the adjoining continuum (, compared with per cent) and as a result, is rather more prominent in the polarized flux spectrum than in the total flux spectrum (Fig. 21). A small PA change is apparent across the broad H line, the average values of in the line and continuum differing by .
Goodrich (1989a) made spectropolarimetric observations covering the wavelength range 4416 – 7190 and measured an average polarization of per cent at . He concluded that his measurements were entirely consistent with interstellar polarization. However, the Galactic extinction in the direction of Was 45 is E(BV), and therefore we would expect a maximum interstellar polarization of only 0.16 per cent. Since we detect degrees of polarization of 1 to 2 per cent, and also see significant changes in both the and in our data, we conclude that the measured polarization is largely intrinsic to the source. In addition, inspection of the percentage polarization spectrum reveals dips in coincident with the narrow H and [N ii] 6583 lines, conclusive evidence that at least some of the observed polarization is intrinsic to the source.
3.2 Objects lacking clear evidence for intrinsic polarization
The data for nine objects are too noisy for firm evidence of polarization intrinsic to the AGN to be discerned. These objects (ESO 113IG45, ESO 012G21, Mrk 705, Mrk 915, Mrk 926, NGC 6104, NGC 7213, PG 1211+143 and UGC 3478) may simply have levels of intrinsic polarization that are too low to be detectable with the signal-to-noise that we were able to achieve. In some cases, a high starlight contribution from the host galaxy to the optical continuum may significantly dilute the intrinsic polarization.
There is weak evidence for intrinsic polarization in a further six objects – Mrk 871, Mrk 896, NGC 3516, NGC 6814, NGC 7469 and NGC 7603. However, in these cases, we cannot rule out a substantial contribution from interstellar polarization. The Galactic extinction in the lines-of-sight to these objects suggests that the interstellar polarization is comparable with what we have measured. Nevertheless, Mrk 871, Mrk 896 and NGC 7603 show marginal evidence for increases in the degree of polarization over the broad H line, relative to the continuum level. In addition, several objects exhibit polarization PA’s either closely parallel to or approximately orthogonal to their radio axes. This behaviour is characteristically exhibited by Seyfert nuclei, and while we cannot exclude mere coincidence, suggests that we may be detecting intrinsic polarization in some cases.
In NGC 7603 the average polarization PA of the continuum and broad H line () is approximately orthogonal to the radio axis PA of reported by Kukula et al. (1995) and Van der Hulst, Crane & Keel (1981). Goodrich (1989a) measured an average optical polarization of per cent in PA and concluded that this was consistent with interstellar polarization. We measure a much lower level of polarization than Goodrich (1989a), but a comparable PA.
NGC 3516 has a continuum polarization PA of , which is approximately parallel to a ‘jet-like’ radio feature. Miyaji et al. (1992) present a 20 cm map showing the ‘jet’ to consist of two components separated by (350 pc) in PA . M96 studied the optical polarization of NGC 3516 and detected both a PA rotation and a variation in the degree of polarization over the broad H line. He measured an average continuum polarization of 0.65 per cent in PA 173 and found the H line to be polarized at 0.44 per cent in PA 163. Our results are significantly different (Table 2). In particular, we measure a much lower continuum polarization, per cent, which is comparable with the typical interstellar polarization expected for the line-of-sight E(BV). It is unclear why there is such a large difference between our polarization measurements and those of M96.
NGC 6814 has a measured polarization per cent, among the highest in our sample. The polarization PA is also approximately orthogonal to the East–West extension of the radio source (Ulvestad & Wilson 1984b). However, this galaxy suffers comparatively large line-of-sight extinction and the measured degree of polarization is comparable to the maximum expected for Galactic interstellar polarization. Furthermore, neither nor vary significantly over the spectrum, consistent with interstellar polarization being the dominant component. GM94 similarly concluded that the polarization measured in NGC 6814 is entirely interstellar in origin.
NGC 7469 is weakly polarized at a level consistent with the expected interstellar polarization. However, in the 1998 October observations (Fig. 22), the red wing of the broad H line exhibits a marked increase in above the continuum level, a feature not present at the previous 2 epochs. In addition, the presence of sharp dips in at the wavelengths of the narrow lines indicates that at least some of the measured polarization is intrinsic to the AGN. NGC 7469 has previously been studied by GM94 who found it to be essentially unpolarized at 0.020.02 per cent.
NGC 4051 is included in this Section because its measured polarization does not vary with wavelength across the spectrum (Fig. 24). However, the line-of-sight Galactic extinction to NGC 4051 is relatively small, implying a maximum interstellar polarization of 0.12 per cent, which is significantly lower than the measured average polarization ( 0.5 per cent). Furthermore, the polarization PA is closely aligned with the radio source axis. Christopoulou et al. (1997) present a MERLIN 18 cm map of NGC 4051 showing a 0.8 (30 pc) triple radio source in PA , compared to a polarization PA of .


(c) 1998 October.

4 Discussion
We have detected intrinsic polarization in 20 Type 1 Seyfert nuclei. The polarization spectra of these sources all exhibit variations with wavelength associated with the broad H line in either the degree or position angle of polarization, or both. Some objects also exhibit wavelength-dependent continuum polarization. In this Section, we discuss mechanisms by which rotations in position angle and changes in percentage polarization may arise. We also outline a model involving a rotating emission disk and two scattering regions, which can at least partly account for the diversity in polarization properties exhibited by our sample.
4.1 Rotations in polarization position angle
Our spectropolarimetric data show that rotations in polarization PA associated with the broad H line are a common characteristic of Seyfert 1 nuclei; three-quarters of the intrinsically polarized objects exhibit significant rotations ranging up to . In some cases, this effect may arise from a difference in polarization PA between the H and continuum emission. However, in several sources (e.g., Akn 120, KUV 18217+6419, Mrk 6, Mrk 335 and Mrk 985), the polarization PA changes as a function of line-of-sight velocity shift within the broad-line profile. The full amplitude of these rotations in the H polarization PA is only evident after subtracting the underlying continuum polarization. In Mrk 6, for example, there is an abrupt swing of in the blue side of the profile core (Fig. 25), whereas in Akn 120 the H polarization PA rotates monotonically by across the profile from the blue to red wings (Fig. 26). These swings in polarization PA indicate that the orientation of scattering plane varies with line-of-sight velocity across the line profile which, in turn, places constraints on the geometry and kinematics of the scattering and/or emitting regions.
A velocity-dependent rotation in the broad emission line polarization PA requires either that the BLR is resolved by the scattering region or is subject to two distinct scattering regions that are arranged so that their scattering planes subtend a large angle to one another. In either case, the velocity field in the BLR and/or scatterers must also be so ordered that there is some discrimination in wavelength for rays following different scattering paths. Thus, if two scattering regions produce line profiles covering somewhat different wavelength ranges (because, one is shifted, or broadened, with respect to the other), the ratio of polarized fluxes from each scattering geometry will vary across the total line profile, resulting in a rotation in polarization PA. This could occur if the line profile produced by the BLR is orientation-dependent, as would be the case if, for example, the emitting gas resides in a rotating disk. Scatterers located along the poles of the disk will ‘see’ a narrower line profile than those in or near the equatorial plane. The scattered line profiles from these two locations will therefore have different widths and, since the scattering planes are perpendicular, orthogonal polarizations. The variation across the line profile in the amounts of polarized flux from the two scattering regions will produce corresponding changes in the polarization PA.
If, on the other hand, the BLR velocity field is isotropic (e.g., an ensemble of line-emitting clouds following virialized Keplerian orbits), motions in the scattering media are needed to provide the necessary discrimination in wavelength space. Thus, an outflowing scattering region will tend to impart a red-shift to the scattered profile and the combination of outflowing polar and stationary equatorial111In this case, we may define the ‘equatorial’ and ‘polar’ scattering regions in relation to the circum-nuclear torus. scattering regions would, in certain orientations, result in a rotation in the polarization PA across the line profile.
A rotation in polarization PA can also be produced if the scattering region is close enough to the BLR that the latter appears spatially extended as seen by the scatterers (near-field scattering). Returning to the example of a rotating line-emitting disk, blue- and red-shifted emission from opposite sides of the disk will have different scattering angles at the same scattering element. If the scatterers lie near the equatorial plane of the disk, this will, in general, result in the red and blue sides of the broad-line profile being polarized at different PA’s. Cohen et al. (1999) have proposed that the PA rotation observed across the broad H line in the radio galaxy 3C 445 can be explained in this way and recently, Cohen & Martel (2001) have discussed a simple scattering model based on this picture in relation to both 3C 445 and the Seyfert 1 galaxy Mrk 231. We will consider a similar model in relation to our own results in Section 4.5.

4.2 The radio axis–optical polarization relationship
It is well established that Type 1 Seyferts and broad-line radio galaxies tend to exhibit optical polarization PA’s parallel to their radio axes whereas Type 2 Seyferts and narrow-line radio galaxies have optical polarizations orthogonal to the radio axis (e.g., Antonucci 1983, 1984, 2001). More recently, in his spectropolarimetric study of Seyfert 1s, Martel (M96) finds a preference for parallel alignments but also shows that when the small-scale radio axis is considered, there is an apparently bi-modal distribution, with several objects having an optical polarization PA orthogonal to this axis.
We have been able to obtain information on the radio axis for 10 of the objects in which we have detected polarization intrinsic to the AGN. The differences () between the PA of the projected axis of the radio source and the average polarization PA’s of, respectively, the broad H line and the adjacent continuum, are listed for these objects in Table 3. The radio axis PA’s are taken from the references cited in Section 3 and are listed in the table. We have either used the published value, or where none is available, made our own estimate from a published radio map. In Seyfert galaxies, it is often difficult to establish the radio source axis unambiguously. We have used the PA of obvious ‘jet-like’ features if one is present, otherwise we have used the PA of the innermost contour tracing an elongation in the source.
Considering the H polarization PA, 6 of the objects listed in Table 3 have , whilst 3 have . In only one object, KUV 18217+6419, is the PA difference intermediate between these two ranges. The values of for the continuum are similarly distributed. Like M96, therefore, we find a dichotomy in the alignment of the optical polarization E vectors (both H and the adjacent continuum) with the radio source axis, the E vectors being roughly parallel to this axis in the majority of objects but roughly perpendicular to it in a significant minority. Note, however, that 4 of the objects listed in Table 3 also appear in M96’s sample, two having parallel (Akn 120 and Mrk 509) and two perpendicular (Mrk 304 and NGC 5548) alignments.
| Object | Epoch | Radio PA | Scale | (H) | (Cont.) | Notes |
|---|---|---|---|---|---|---|
| (∘) | (kpc) | (∘) | (∘) | |||
| Akn 120 | Feb 97 | 50 | 6.10 | 15 | 21 | Contour elongations |
| Oct 98 | 25 | 27 | ||||
| Akn 564 | 170 | 0.46 | 78 | 83 | Jet–like | |
| IZw1 | Aug 97 | 140 | 34.4 | 7 | 6 | Contour elongations |
| Oct 98 | 6 | 12 | ||||
| KUV 18217+6419 | 20 | 0.54 | 44 | 57 | Jet–like | |
| Mrk 6 | Oct 98 | 170 | 0.14 | 15 | 14 | Jet–like |
| Mrk 279 | 90 | ? | 30 | 30 | Unpublished radio map | |
| Mrk 304 | 42 | 1.70 | 81 | 86 | Unpublished radio map | |
| Mrk 509 | Aug 96 | 165 | 0.65 | 20 | 13 | Jet–like |
| May 97 | 17 | 24 | ||||
| Aug 97 | 20 | 26 | ||||
| Mrk 876 | 140 | 2.30 | 28 | 30 | Contour elongations | |
| NGC 5548 | 155 | 1.63 | 88 | 58 | Jet–like |
The simplest interpretation is that the polarized light in the ‘parallel’ and ‘perpendicular’ groups is produced by different scattering geometries. Scattering in a plane perpendicular to the radio jet axis would tend to produce polarization parallel to that axis, whereas scattering in a plane aligned with the jet axis would produce orthogonal polarization. Assuming that the radio jet is co-aligned with the torus axis, parallel and perpendicular polarizations correspond to scattering in the equatorial plane of the torus and along its poles, respectively.
However, as we have noted, several objects exhibit large swings in polarization PA across their broad H lines. This suggests that considering only the average polarization PA for the line is too simplistic and may cause us to miss important clues to the scattering geometry. Therefore, for each of the galaxies in Table 3, we have used the continuum-subtracted spectra to calculate the polarization PA’s in three separate wavelength bins corresponding to the red wing, core and blue wing of the broad H line profile. These polarization PA’s are listed, together with the radio axis PA, in Table 4.
In the three objects of the ‘perpendicular’ group (Akn 564, Mrk 304 and NGC 5548) large PA differences with respect to the radio axis are maintained across the line profile, although with some variation between bins. Other objects exhibit more complex relationships between the polarization E vector and the radio axis. At first sight, KUV 18217+6419 is anomalous in that its average broad H polarization PA differs by from that of its ‘jet-like’ radio source and therefore falls into neither ‘parallel’ nor ‘perpendicular’ groups. However, the binned PA measurements show a rotation such that the E vector is roughly perpendicular to the radio axis in the blue wing () but nearly parallel in the red wing ().
Akn 120 falls comfortably into the ‘parallel’ group in Table 3, but there is a similar change in E vector alignment across the broad H profile. This is not very apparent from the binned PA measurements listed in Table 4, but inspection of the continuum-subtracted spectra from our 1998 October observations (Fig. 26) reveals a PA swing from in the blue wing to in the red. So while, on average, the broad H PA differs by 25 from that of the radio axis, the E vector rotates from a parallel alignment () in the blue wing to a roughly perpendicular orientation in the red wing ().
In at least three other ‘parallel’ objects, the blue and red wing polarization PA’s straddle the radio source PA, the E vectors, typically pointing a few 10’s of degrees to either side of the projected radio axis. As discussed in Section 4.5, this behaviour is consistent with near-field scattering of line emission from a rotating disk, by scatterers co-planar with the disk.
In making these comparisons, it is important to bear in mind the uncertainties inherent in establishing the radio axis PA. One problem, already alluded to, is that the radio axis may not be well-defined in partially resolved or amorphous sources. Another is that, even when detailed maps are available, the large scale ( kpc) structure of the radio source often has a different axis to that of the core. In these cases, it is not clear whether the systemic axis of the AGN is best represented by the large or small scale structure. For example, if the radio jet is precessing, the large scale axis may represent the time-averaged direction of the radio jet, in which case, it would be the most appropriate axis with which to compare the polarization PA. On the other hand, the large scale radio structure may itself be significantly influenced by the circumnuclear environment. For example, once the radio ejecta has spent its kinetic energy, the plasma will tend to expand along the local pressure gradient and might, therefore, become more elongated along the galactic minor axis than the jet axis. It is also possible that kiloparsec-scale radio lobes are contaminated or even dominated by starbursts (e.g., Baum et al. 1993).
| Object | Epoch | Radio PA | Scale | Blue Wing PA | Core PA | Red Wing PA | Average broad H PA |
|---|---|---|---|---|---|---|---|
| (∘) | (kpc) | (∘) | (∘) | (∘) | (∘) | ||
| Akn 120 | Feb 97 | 50 | 6.10 | 65.02.2 | 74.02.6 | 67.12.3 | 64.95.3 |
| Oct 98 | 62.11.7 | 79.01.4 | 91.97.2 | 74.91.2 | |||
| Akn 564 | 170 | 0.46 | 113.814.6 | 92.84.0 | 73.89.4 | 92.53.9 | |
| IZw1 | Aug 97 | 140 | 34.4 | 119.912.9 | 126.08.1 | 166.316.0 | 132.67.6 |
| Oct 98 | 121.75.1 | 129.32.3 | 151.53.2 | 133.81.9 | |||
| KUV 18217+6419 | 20 | 0.54 | 127.94.1 | 170.16.7 | 11.17.5 | 156.55.5 | |
| Mrk 6 | Oct 98 | 170 | 0.14 | 175.01.3 | 148.21.8 | 147.31.1 | 155.20.9 |
| Mrk 279 | 90 | ? | 79.218.8 | 133.97.3 | 109.311.5 | 120.37.8 | |
| Mrk 304 | 42 | 1.70 | 122.53.3 | 111.35.6 | 139.56.6 | 123.32.9 | |
| Mrk 509 | Aug 96 | 165 | 0.65 | 152.72.1 | 135.82.7 | 147.93.1 | 145.31.6 |
| May 97 | 162.13.3 | 135.34.4 | 147.03.8 | 148.22.4 | |||
| Aug 97 | 156.84.5 | 130.94.4 | 147.53.1 | 145.02.5 | |||
| Mrk 876 | 140 | 2.30 | 157.19.5 | 113.83.9 | 88.08.2 | 112.44.6 | |
| NGC 5548 | 155 | 1.63 | 32.16.4 | 78.12.3 | 53.34.4 | 67.32.4 |

Nevertheless, if we take the radio axis PA’s we have compiled at face value, there is evidence that two different scattering geometries, producing orthogonal polarizations, are present in Type 1 Seyfert nuclei. The ‘parallel’ group is presumably dominated by scattering in the equatorial plane of the torus and the ‘perpendicular’ group by polar scattering along the radio jet/torus axis. The very large rotations in polarization PA that occur across the broad H line in KUV 18217+6419 and Akn 120, where the polarization changes from parallel to orthogonal to the radio axis, might imply that both scattering routes are important in some objects.
It is worth recalling that optical polarization perpendicular to the radio axis is a well-established characteristic of Type 2 Seyfert nuclei. The presence of several perpendicularly polarized objects in our sample (Akn 564, Mrk 304 and NGC 5548 from Table 3 and possibly also NGC 6814 and NGC 7603 which, although they may be heavily contaminated by interstellar polarization, also have optical polarization PA’s approximately orthogonal to the radio axis) provides evidence for a population of Seyfert 1s which, like Seyfert 2s, are dominated by polar scattering. However, Akn 564, NGC 5548 and, in particular, Mrk 304, all display variations in over the broad-line, most notably depolarizations over the line core, that are more characteristic of equatorial, rather than polar, scattering as discussed in the following Sections.
4.3 Polarization structure across the broad H line
Approximately three-quarters of the objects in which we have detected intrinsic polarization show significant decreases in polarization over the core of the broad H line. Cohen et al. (1999) have proposed that similar features in broad-line radio galaxies are due to dilution of the polarized underlying continuum by unpolarized broad H emission, the BLR being located outside the scattering regions. However, simple dilution is not, in general, a satisfactory explanation for the polarization structure observed in our Seyfert 1 sample. The variations in do not mirror the shape of the broad-line profile and in particular, it is often the case that one or both line wings are more highly polarized than the continuum (e.g., Mrk 6, Mrk 304, Mrk 509). Weakly polarized narrow H and [N ii] lines may cause some dilution, but this cannot account for the large widths of the percentage polarization minima.
Alternatively, M96 has proposed a model in which variations in polarization across the broad H line are “produced by scattering of radiation emitted by the central continuum source from sub-regions of different physical properties in the BLR”. However, the ad hoc nature of this picture makes it unattractive, and we prefer to look for interpretations that are consistent with the basic geometry imposed by the Seyfert unification scheme.
We note firstly, that polarization minima within the broad H line do not necessarily indicate that the scatterers are interior to, or within, the BLR. For example, cancellation between two sources of orthogonally polarized flux overlapping in wavelength space could reduce the net polarization. With the possible exception of Mrk 279, the broad H emission and underlying continuum do not exhibit orthogonal polarizations. Therefore, if the decreases in in the line core are due to cancellation, then it must be between different sources of polarized broad H emission. Many of the objects that show polarization minima also exhibit PA rotations that might indicate the presence of more than one source of polarized H emission. However, the PA rotations are usually rather smaller than might be expected for orthogonally polarized sources and furthermore, polarization minima are also observed in objects which show no evidence for a PA rotation across the broad H line (e.g., Mrk 290).
A more satisfactory explanation for the decreases in in the core of the broad H line is that the line profile in total flux (the direct view) is narrower than that in polarized flux (scattered view). This will occur naturally if the BLR is confined to a rotating disk and is surrounded by a co-planar ring of scatterers. The scatterers view the disk edge-on whereas the direct line-of-sight to the BLR has to pass within the opening angle of the circum-nuclear torus and therefore provides a more face-on view (assuming that the disk and torus are roughly co-axial). Thus, the line profile in scattered (polarized) light will always be broader than that in direct (unpolarized) light and the latter will dilute the polarization of the scattered component in the core of the combined line profile. If the underlying continuum has a constant polarization, will increase relative to the continuum level in the line wings, but will drop below that level in the core. This type of H polarization structure – a decrease in polarization over the line core flanked by increases in both line wings – is clearly observed in 3 objects, Mrk 6, Mrk 304 and Mrk 509. A similar effect will, in general, result from electron scattering regardless of the exact scattering geometry, since the scattered line profile can be significantly broadened by the thermal velocity dispersion of the scattering electrons (e.g., the velocity dispersion for electrons at a temperature K is km s-1).
A few objects, notably Fairall 51, NGC 4593 and Was 45, show significant increases in polarization, relative to the continuum level, covering not just the wings, but the entire profile of the broad H line – including the core. Similar broad peaks in polarization associated with the Balmer lines are present in those Type 2 Seyfert nuclei that exhibit Type 1 spectra in polarized flux. In these objects, the nuclear continuum source and BLR are hidden by the torus and only visible in scattered, hence polarized, light. However, since the continuum and line emission are presumably subject to the same scattering geometry (polar scattering) they should have the same polarization level. The increase in over the broad H line is explained by the presence of a further, unpolarized continuum component (likely to be starlight from the host galaxy) that dilutes the polarized light from both the nuclear continuum and the BLR. The contribution of polarized flux from the BLR lessens the effect of dilution over the broad-line profile, leading to an increase in percentage polarization.
In the Type 1 Seyferts, we have a direct view of the nuclear continuum source and BLR and the dilution effect of starlight would be small if it is dominated by the AGN continuum. However, it seems plausible that, at least insofar as their scattering and polarization properties are concerned, Fairall 51, NGC 4593 and Was 45, are more akin to Type 2 Seyferts than Type 1’s. In this respect, it is significant that in both Fairall 51 and NGC 4593 the continuum polarization increases to shorter wavelengths.222Unfortunately, we cannot ascertain the polarization wavelength dependence in Was 45 since our data for this object only cover the H region. This is another property common to Type 2 Seyferts, where it is generally believed to indicate dust scattering of light from the obscured AGN continuum source combined with an unpolarized starlight contribution (or, alternatively, electron scattering combined with a red unpolarized continuum). These 3 objects, again like Seyfert 2s, exhibit no significant PA rotation across the broad H line. Their optical polarization properties, therefore, are consistent with far-field polar scattering of the BLR and AGN continuum, combined with a relatively large (for Type 1 Seyferts) starlight fraction contributing to the unpolarized continuum flux. The latter situation could arise, perhaps, from partial extinction of the AGN (which would also serve to reduce the polarized flux from near-field scattering regions which might otherwise produce PA rotations). Schmid et al. (2001) reach similar conclusions from their detailed spectropolarimetric study of Fairall 51. After subtracting a starlight fraction estimated to be per cent (at Å), they find that the AGN spectrum can be explained by a combination of reddened direct light and dust-scattered polarized light. They suggest that in this galaxy, the direct line-of-sight to the AGN passes through the top layers of the dusty circum-nuclear torus, above which is a dusty polar scattering region.
A clear prediction of the polar scattering scenario is that the polarization E vector should be orthogonal to the projected radio axis, as is the case in Type 2 Seyferts. Unfortunately, we have been unable to find published radio maps for Fairall 51, NGC 4593 and Was 45 with which to verify this prediction. Nevertheless, in Mrk 704, another Type 1 Seyfert (not included in our sample) which has very similar polarization properties, the optical polarization PA is known to be perpendicular the radio axis (GM94; M96). There is, therefore, good evidence that the polarization properties of a significant number of Seyfert 1s (roughly 10 per cent of our total sample) are dominated by Seyfert 2-like polar scattering.
However, other objects exhibiting somewhat similar polarization properties (i.e., an increase in polarization over the entire broad H line and/or polarization PA orthogonal to the radio axis) cannot be explained in terms of simple polar scattering. For example, Mrk 335 exhibits a large PA rotation across broad H which is not generally seen in Seyfert 2s. Akn 564 and NGC 5548 both have polarization PA’s orthogonal to their radio source axes, but exhibit decreases in polarization over the core of the line. In addition, whilst Mrk 304 shows a depolarization over the broad H line core flanked by increases in both line wings, consistent with scattering from the equatorial plane of a rotating emission disk, it has a optical polarization PA to the reported radio source PA. However, it is still possible to understand the apparently conflicting behaviours of and in terms of equatorial scattering, as discussed in Section 4.5.1.
4.4 Other considerations
4.4.1 The polarization of narrow-line Seyfert 1 galaxies
Narrow-line Seyfert 1 galaxies (NLS1; Osterbrock & Pogge 1985) have aroused much interest in recent years as it has become increasingly clear that they exhibit extreme optical and X-ray properties (e.g., Grupe 2000). As a sub-class, however, they do not appear to exhibit unusual optical polarization; most are weakly polarized although a few exhibit wavelength-dependent polarization at levels per cent (Goodrich 1989b; Grupe et al. 1998). Nevertheless, among various explanations for the narrowness of the Balmer lines, it has been proposed (i) that the BLR is partly obscured and (ii) that the Balmer lines are emitted by a disk, which, in NLS1’s, happens to have a face-on orientation. Since both scenarios might be expected to produce certain polarization signatures, it is worth examining the Balmer-line polarization properties of the NLS1’s in our sample.
There are 8 objects in our sample that have been classified as NLS1’s. We have detected intrinsic polarization in only three: Akn 564, I Zw1 and Mrk 335. The first two both exhibit decreases in polarization across the H line, but differ in the orientation of the polarization E vector relative to the radio axis. In Akn 564, the average line and continuum polarization PA’s are approximately orthogonal to the radio axis. On the other hand, I Zw1 is, on average, polarized parallel to its radio axis and it is also one of the objects in which there is a PA swing across the broad H line such that the blue and red wing polarization PA’s bracket that of the radio axis (Table 4). The other NLS1 for which we have obtained a radio axis is NGC 4051. We cannot be certain that the measured 0.5 per cent polarization is intrinsic to the AGN in this source (Section 3.2), but if so, the polarization PA is approximately parallel to the radio axis.
The classification of Mrk 335 as a NLS1 is somewhat dubious (Giannuzzo et al. 1998), but we note nevertheless, that unlike Akn 564 and I Zw1, the degree of polarization increases over the broad H line. Mrk 335 is also unusual in that its blue wing is polarized at a higher level and at a roughly orthogonal PA compared to the rest of the line and the local continuum.
With the exception of Mrk 335 (and possibly I Zw1), there is no evidence that, in the NLS1, the H line wings are broader in polarized than in total flux. This argues against obscuration of the inner regions of the BLR as the explanation for the relatively narrow broad-line profiles. The observations similarly do not really support the idea that the face-on orientation of a disk-like BLR is the main characteristic that differentiates NLS1s from ‘normal’ Seyfert 1s. In this case, we would expect them to exhibit similar H polarization properties (in the context of the orientation sequence outlined in Section 4.5.2, NLS1’s would be weakly polarized). In fact, as we have already noted, there are large differences. Collectively, the H polarization properties of the (albeit small) NLS1 sub-sample are indistinguishable from those of the ‘normal’ Seyfert 1s.
4.4.2 Polarization Variability
We have observed several objects at two or more epochs and as noted in Section 3, there is evidence in some cases for significant polarization variability. We have discussed the polarization variations that occured in Mrk 509 between 1996 August and 1997 May in a previous paper (Young et al. 1999). In this case, there was a decrease in the degree of polarization, with a corresponding decline in the very broad H component present in the polarized flux spectrum. There is also evidence for a small swing in polarization PA. The relatively short timescale over which these changes took place implies the presence of a compact scattering region.
Of the other objects, the most convincing case for a real change in polarization can be made for Akn 120 (Section 3.1.1). Both observations of this source, in 1997 February and 1998 October, were obtained at the WHT with almost exactly the same instrumental set-up (a slightly larger slit width was used for the later observation). In the interval between the two observations, there was an overall decrease in the degree of continuum polarization, accompanied by significant changes in the polarization structure over the broad H line, notably the disappearance of the polarization minimum associated with the line core and the appearance of a polarization peak in the far blue wing. The continuum polarization appears to have dropped to the level of the line core, leaving behind the more highly polarized feature in the blue wing. There does not appear to have been any significant change in the polarization PA between the two epochs. A later (1999 August) observation obtained by Schmid et al. (2000) shows polarization structure similar to that in our 1997 February spectrum, suggesting that the large changes that occurred in the interval between our two observations have been reversed. These dramatic changes provide strong confirmation of earlier reports (M96) that Akn 120 undergoes polarization variations.
Another object in which a change in polarization seems to have occurred is NGC 7469. The average levels of polarization in this object are consistent with what we would expect for interstellar polarization and at 2 out of the 3 epochs at which we observed this source, the polarization spectra are featureless, also as would be expected if the polarization is largely interstellar in origin. However, the data from the third epoch (1998 October) reveal a significant local peak in percentage polarization associated with the red wing of the broad H line. The presence of this peak is presumably the reason why the average H polarization is a factor higher than in the 1997 June data, which were obtained with an identical set-up (using the WHT) and are of comparable quality. The AAT data obtained in 1997 August are of lower resolution and quality, but are generally consistent with those of 1997 June. The polarization peak cannot be attributed to any obvious instrumental or spurious observational effects (e.g., cosmic rays, CCD defects) and it is difficult, therefore, to avoid the conclusion that it represents a real variation in the source.
In Section 3 we also compared our polarization measurements with those of other authors. In most cases, the various sets of measurements are reasonably consistent. The only object for which we found significant differences is NGC 3516. Our observations, taken in 1997 February, yield a low level of polarization (0.15 per cent), consistent with the expected interstellar polarization, whereas in 1994 April, M96 measured 0.5 per cent polarization at a PA 40 different from ours. It is possible that this discrepancy represents a real variation, the intrinsic polarization having decreased, by the time of our observation, to the point where the interstellar polarization is dominant. Alternatively, the differences could arise from a difference in slit width and orientation. M96 used a wider slit (2.4 arcsec) in a different PA and since NGC 3516 has a bright, well-resolved, extended emission line region, this could have resulted in contamination by polarized light from an extended scattering medium associated with this gas.
Nevertheless, the observations of Mkn 509, Akn 120 and NGC 7469, at least, are sufficiently robust as to provide convincing evidence that, in some Seyfert 1 nuclei, the broad H polarization can vary on a timescale year. Since the emission line polarization can only be due to scattering, this implies that at least part of the scattering medium is compact, and probably close to the BLR. The variations in percentage polarization could arise from a physical change in the scattering medium (e.g., an increase in the density of scattering particles) or a change in the line flux incident on the scatterers. It is worth noting, in this context, that all three objects are well known to undergo significant broad-emission line variability, resulting from the light-echo delayed response of the BLR to changes in the central ionizing continuum luminosity (e.g., Peterson 1999 and references therein).
4.4.3 Nuclear luminosity
Our sample covers a fairly wide range in luminosity; (Véron & Véron 1998). Nevertheless, there is no clear evidence that the polarization properties are strongly related to luminosity. Even though several of the objects in our sample are luminous enough () to be classified as quasars, their polarization properties do not differ significantly from those of the rest of the sample. It may, however, be significant that the group identified as having polar scattering characteristics similar to those of Type 2 Seyfert nuclei in which polarized broad-lines are detected (Fairall 51, NGC4593 and Was 45) are among the fainter objects in our sample. Respectively, these objects have magnitudes 19.8, 19.7 & 21.0, compared with an average for the objects listed in Table 5, which have polarization properties consistent with equatorial scattering. The slightly lower luminosities of the former group are consistent with our picture in which the line-of-sight to the nucleus is subject to a moderate amount of extinction (Sections 4.3 and 4.5.2).
4.4.4 Host galaxy inclination
It is also of interest to consider polarization properties in relation to the inclination of the host galaxy. There is no discernable relationship between the principal axis of the active nucleus, as defined by the radio jet, and the dynamical axis of the parent galaxy among Seyferts (e.g., Kinney et al. 2000). However, the inclination of the host is likely to govern the amount of obscuring material in the galactic disk, that is present along the line-of-sight to the nucleus and this may have some bearing on our analysis. Indeed, the apparent lack of Seyfert 1 nuclei in edge-on host galaxies suggests that dust within the disk can have a similar effect to the torus, obscuring the direct view of the nucleus (e.g., Keel 1980; Schmitt et al. 2001). Among our sample, however, there is no evidence that the inclination of the disk of the host galaxy (as measured by its aspect ratio) affects the nuclear polarization properties. For example, Mrk 6 and Fairall 51, are probably the most clear-cut cases of, respectively, equatorial and polar scattering. As such, their nuclei are presumably viewed at rather different orientations. However, their host galaxies have similar aspect ratios, implying similar inclinations.
4.5 Inclination-dependent scattering in Seyfert 1 nuclei
Broadly speaking, the intrinsically polarized objects in our sample fall into two groups. A minority (3 out of 20) exhibit polarization properties very similar to those of Type 2 Seyferts (polarization increases to shorter wavelengths, with local increases over the broad Balmer lines, the polarization PA is constant over the lines), which can be attributed to far-field polar scattering. Most of the remainder are characterized by decreases in polarization within the core of the broad H line, in some cases flanked by increases in one or both wings. Many of this group also exhibit significant blue-to-red PA rotations across the line profile. It is clear from the discussion in Sections 4.1 and 4.3, that both of these characteristics (line core depolarization and PA rotation) can be produced by scattering of broad-line emission from a rotating disk, if the scattering medium lies in the plane of the disk and closely surrounds it. Here we outline a model based on this idea in more detail. Detailed calculations of the polarization produced by this scattering configuration will be presented in a forthcoming paper (Smith et al., in preparation).
4.5.1 Equatorial scattering model
The main features of the model are sketched in Fig. 27. The line-emitting disk is centred on a point-like continuum source, C, and is tilted at an arbitrary inclination to the line-of-sight. A co-planar ring of scatterers closely surrounds the disk. Both the disk and ring are surrounded by, and lie in the equatorial plane of, the dusty molecular torus that is the key element of Seyfert unification schemes. The disk, ring and torus are, therefore, co-axial and we assume that this ‘system’ axis also defines the radio axis.
For simplicity, we first consider a single scattering element aligned with the major axis of the disk seen in projection. Light from the disk and from the central continuum source is scattered from this point in the ring into the observer’s line-of-sight and thereby becomes linearly polarized. The E vector of the scattered continuum light will be parallel, in projection, to the system axis (and hence the radio axis). The scattering element will ‘see’ blue- and red-shifted emission from points A and B, respectively, while the corresponding E vectors are directed either side of the continuum E vector with equal but opposite offset angles. The result is a rotation in polarization PA from blue to red across the line profile, centred on the continuum PA.
In general, the blue-to-red PA rotation is still present even when scattering from the complete ring is considered. When the disk is viewed face-on, circular symmetry ensures complete cancellation of the polarization produced by any scattering element by that of its orthogonal counterpart. However, when the disk is inclined, light scattered from elements aligned with the minor axis of the projected disk (opposite points A and B) is less completely polarized, due to the smaller scattering angles, than light scattered by elements aligned with the major axis. This breaks the symmetry and leaves a net polarization with a PA rotation similar to that expected for a single scattering element aligned with the major axis.333The scattering element at the opposite ‘pole’ of the major axis polarizes blue- and red-shifted emission at the same PA’s as its counterpart, since the Doppler shifts for A and B are reversed in sign.
The model also predicts a variation in the degree of polarization with velocity shift across the line profile. A simple rotating disk produces a line profile whose width varies as , where is the inclination of rotation axis to the line-of-sight. Since the scattering ring has an edge-on view of the disk (), the scattered line profile encompasses the whole range in rotational velocity present in the disk. This will not be the case for the direct line-of-sight to the observer, which for a Seyfert 1 nucleus, must pass within the torus opening. Observational evidence suggests that the average torus opening angle in Seyfert galaxies is (e.g., Lawrence 1991), implying that in a Type 1 Seyfert the direct line-of-sight must have . It follows that the line profile in direct, unpolarized, light has a width that in scattered, polarized, light. The combination of scattered and direct line emission will, therefore, result in wavelength-dependent dilution of the polarized component. With the further addition of the underlying continuum, whose polarization is wavelength independent, the observed percentage polarization will increase relative to the continuum level in the line wings, but will drop to a minimum below that level in the core.
To summarize, we expect that the polarized light produced by this scattering configuration will exhibit the following general features to some degree:
-
1.
the position angle of polarization will rotate from blue to red across the broad-line profile (provided that the disk subtends a finite angle at the scattering ring);
-
2.
the underlying continuum will be polarized at a PA intermediate between those of the blue and red line wings. The continuum PA will be aligned with the projected disk rotation axis and hence also the radio axis;
-
3.
the degree of polarization peaks in the line wings and passes through a minimum in the line core. The underlying continuum is polarized at an intermediate level.
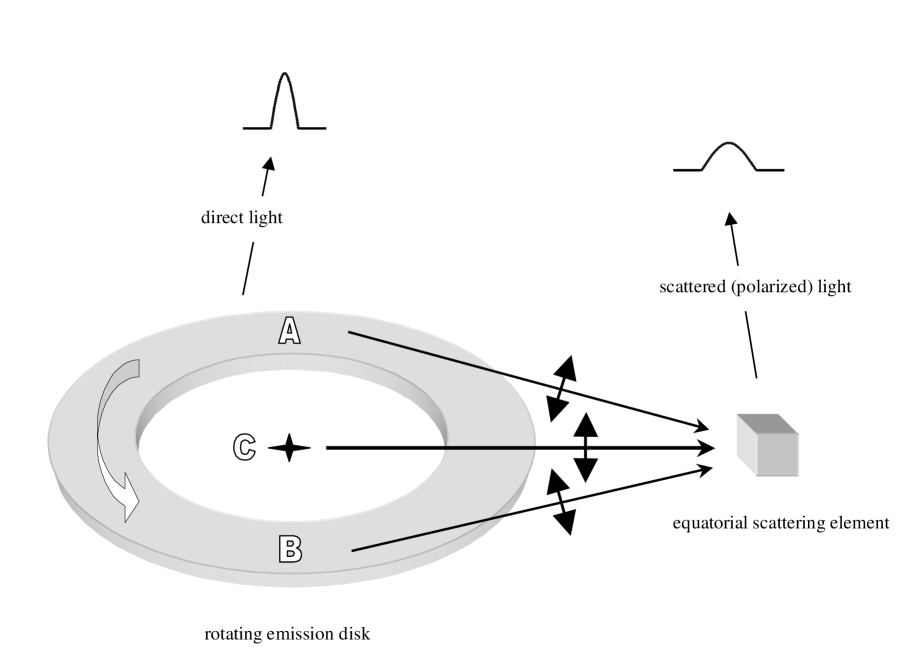
As we have already noted, characteristics similar to those summarized above are observed in several of our objects. Table 5 lists ten galaxies whose broad H lines show either a clear blue-to-red rotation in polarization PA across the line profile (e.g., Fig. 26) or a decrease in the degree of polarization at the line core, accompanied by a peak in polarization, above the continuum level, in either line wing (e.g., Fig. 7).
| Object | PA rotation | Depolarization in | Polarization peak(s) |
|---|---|---|---|
| across line profile ? | line core ? | in either line wing ? | |
| Akn 120 Epoch 1 | YES | YES | NO |
| Epoch 2 | YES | NO | YES |
| IZw1 Epoch 1 | NO | YES | NO |
| Epoch 2 | YES | YES | NO |
| KUV 18217+6419 | YES | NO | YES |
| Mrk 6 | YES | YES | YES |
| Mrk 304 | NO | YES | YES |
| Mrk 509 All Epochs | NO | YES | YES |
| Mrk 841 | NO | YES | YES |
| Mrk 876 | YES | YES | NO |
| Mrk 985 | YES | YES | NO |
| NGC 3783 | NO | YES | YES |
Few of these objects exhibit all of the expected polarization characteristics. However, the PA rotation and percentage polarization structure result from different mechanisms (an anisotropy in scattering angle distribution and differential dilution, respectively) and, although both effects depend on the line-emitting disk being inclined to the line-of-sight, they are also subject to other, independent, parameters. Therefore, these characteristics would not necessarily be strongly correlated.
Mrk 6 provides the best overall match to the qualitative predictions. The most problematic objects are Akn 120, whose percentage polarization spectrum exhibits very different structures at different epochs, and Mrk 304, in which the H polarization structure agrees quite well with that predicted, whereas the polarization PA is nearly orthogonal to the reported radio axis, consistent with polar rather than equatorial scattering.
A blue-to-red PA rotation is seen in only 6 out of the 10 objects. However, increasing the scattering ring radius relative to that of the disk will decrease the angle subtended by the disk at a given scattering element and hence reduce the PA swing. Therefore, the absence of a significant PA rotation in some objects may simply mean that the scattering ring has a relatively large radius in those cases. When a PA swing is seen, we would expect the continuum polarization PA to bisect the blue-to-red rotation across the line. The continuum PA lies within the range covered by the H polarization PA in 5 out of the 6 objects that exhibit a PA swing across the line, but only in two (Mrk 876 and Mrk 985) is it approximately centred with respect to the blue and red wing PA’s.
In only two galaxies, Mrk 6 and Mrk 509, do the observed variations in the degree of polarization across H closely match the model prediction in that the central dip in polarization is flanked by red and blue peaks of similar amplitude. In general, the prominence of the blue- and red-wing polarization peaks varies considerably, as does their relative amplitude. These features are absent in 3 objects (I Zw1, Mrk 876, Mrk 985; which, however, do exhibit PA rotations) while, in the others, the blue-wing peak is usually the stronger.
Mrk 304, whilst showing a peak-trough-peak variation in over broad H, has an optical polarization PA orthogonal to that of the reported radio axis PA – apparently consistent with polar rather than equatorial scattering. Nevertheless, it may still be possible to reconcile the polarization characteristics of Mrk 304 with equatorial scattering. Corbett et al. (1998) show that scattering from the inner, far wall of the circum-nuclear torus can produce scattered light whose polarization PA is perpendicular to the radio axis if an object is inclined such that the observer has a clear view of the emission disk and the far inner wall of the torus, but the scattering material at the nearer inner wall and sides of the torus is obscured by the bulk of the torus material. A similar configuration may explain the optical polarization of Mrk 304 in the context of the equatorial scattering model developed in this work. For example, the torus may partially obscure the equatorial scattering region such that most of the scattering material located at the sides and along the nearer segment (i.e., opposite point B in Fig. 27) of the scattering ring is obscured, while the emission source and the far side of the scattering ring remain visible. The scattered profile would be broader than in the direct view, so a peak-trough-peak variation in would be seen across the emission-line. In addition, the scattered flux from along the far side of the equatorial scattering ring (i.e., opposite point A in Fig. 27) will have an average PA that is perpendicular to the emission disk axis and hence radio axis. A similar explanation may apply to Akn 564 and NGC 5548, however, the lack of polarization peaks in the line wings remains a problem for these objects.
Clearly, the polarization features predicted by the equatorial scattering model are present to very differing degrees in different objects. This is, perhaps, not surprising given the simple geometry of the model and the likely complexity of the emission and scattering regions in reality. For example, the fact that the broad H lines commonly have asymmetric profiles shows that the emission region is more complex than the simple disk envisaged in the model. Additional emission components or scattering centres, perhaps with velocity shifts, will undoubtedly distort the polarization signature of the disk/ring system. For example, a scattering outflow along the system axis would produce red-shifted scattered light, polarized orthogonal to the equatorial component. We might thus expect the amplitude of the red-wing polarization peak to be reduced (by cancellation) relative to that of the blue-wing and its PA of polarization to be preferentially modified, breaking the symmetry of the blue- and red-wing polarization PA’s relative to that of the continuum. Such an outflow might be identified with the polar scattering region which, as we discuss below, must also be present in Seyfert 1 galaxies.
4.5.2 Combined equatorial and polar scattering
While the equatorial scattering model can account for the most striking features that are present in our data, namely the blue-to-red polarization PA rotation and the peak-trough-peak variation in degree of polarization over the broad H line, there is also considerable evidence that polar scattering is important in Seyfert 1 nuclei. In particular, 3 objects have polarization PA’s perpendicular to the radio source axis and 3 more exhibit polarization spectra very similar to those observed in ‘polarized broad-line’ Seyfert 2 nuclei. The latter objects, along with others previously described (GM94), represent direct observational evidence that the ‘scattering mirror’, which is located above the circum-nuclear torus and allows us to detect the obscured BLR in Seyfert 2 galaxies, is also present in Type 1 nuclei. This is, of course, also implied by the Seyfert unification scheme, according to which, similar scattering regions should be present in all Seyfert nuclei.
Consideration of the optical polarization properties of Seyfert 1 nuclei should, therefore, include far-field polar scattering as well as the near-field equatorial component. Our detailed model of Mrk 509 (Young 2000) includes both of these components and also takes into account several other effects, such as scattering off the inner wall of the torus. Here, for simplicity, we discuss only the combination of near-field equatorial scattering, as described in Section 4.5.1, and polar scattering. We envisage the polar scattering region as a cone, containing dust or free electrons, which is co-axial with the torus and has a comparable opening angle.
The observed polarization produced by the combination of equatorial and polar scattering will, in general, depend on the inclination of the system axis to the line-of-sight. At very small inclinations (with the system axis closely aligned with the line-of-sight), we expect a low degree of polarization, since the circular symmetry ensures that both components of scattered light will suffer almost complete cancellation. As the inclination is increased from to , the degree of polarization increases monotonically for both components. Calculations using Young’s (2000) scattering code show that, for the wide scattering cone envisaged, increases more rapidly with inclination for the equatorial than for the polar component. Without the optically thick torus, therefore, the equatorial component would dominate the observed polarization at all inclinations. However, for inclinations , the line-of-sight to the BLR and the equatorial scattering region is blocked by the torus. We would then observe a Seyfert 2 nucleus, with broad Balmer lines visible in polarized light as a result of scattering in the polar region. In order for polar scattering to make a sigificant contribution to the polarization in Type 1 Seyferts, the equatorial component must be suppressed relative to the polar component. An obvious possibility is that, in the objects that exhibit signatures of polar scattering, the direct line-of-sight to the AGN passes through the (presumably relatively tenuous) upper layers of the torus. Light from the the equatorial scattering region might easily suffer sufficient extinction to allows polar scattering to dominate the observed polarization. Direct light from the AGN would, of course, also suffer extinction and as we have already noted in Section 4.3, this would help to explain the polarization wavelength dependence in objects that have ‘Seyfert 2-like’ polarization properties (Fairall 51, NGC 4593 and, to a lesser extent, Was 45).
The above analysis suggests that the wide range in polarization properties displayed by the sample as a whole can be at least partly understood in terms of an orientation sequence. Some of the objects that are evidently dominated by interstellar polarization have low measured polarizations ( per cent) and must, therefore, be intrinsically weakly polarized. In our scheme, these objects (e.g., Mrk 926, PG 1211+143) would have near pole-on orientations. The objects listed in Table 5, which exhibit H polarization features characteristic of equatorial scattering, have intermediate inclinations to the line-of-sight. Objects that show evidence of polar scattering (polarization PA perpendicular to radio axis, or Seyfert 2-like percentage polarization spectra) are viewed at larger inclination angles, comparable to the torus opening angle, and suffer a moderate amount of extinction in the upper layers of the torus. With a further increase in inclination, the line-of-sight to the nucleus passes through the main body of the dusty molecular torus and a ‘polarized broad-line’ Seyfert 2 galaxy is observed.
It is worth briefly considering NLS1’s in relation to the scheme outlined above. If the small widths of their Balmer lines are due to the line-emitting disk having a face-on orientation, the combined scattering model implies that they should be weakly polarized. In fact, in our sample, only two (PG 1211+143 and Mkn 896) have measured polarizations per cent. Of the others, 3 are probably dominated by interstellar polarization (at levels per cent) and the remaining 3 are intrinsically polarized at similar levels to those of the ‘normal’ Seyfert 1s. One of the latter, Akn 564, is polarized perpendicular to the radio axis, indicating that polar scattering is important and hence that the object is viewed at a fairly large inclination. The NLS1’s, therefore, appear to be distributed amongst all three of the postulated orientation classes, rather than being confined to the pole-on group.
While the combination of equatorial and polar scattering outlined above can broadly explain the range of H polarization properties found in the sample, there are a number of intrinsically polarized objects whose status within this scheme is unclear. Most of these show a dip in polarization over the broad H line core but there is little evidence for any of the other features associated with the emission disk/scattering ring model. Better data might, perhaps, reveal such features in some cases (e.g., MS 1849.27832, Mrk 279 and Mrk 290) but in other objects (e.g., NGC 5548 and Mrk 335), there are large variations in the degree and PA of polarization over H line profile that are difficult to understand in terms of the simple scenario presented here.
5 Conclusion
We have detected polarization intrinsic to the active nucleus in 20 out of 36 Seyfert 1 galaxies. We have measured a significant level of polarization in a further 7 objects but in these we cannot exclude the possibility of serious contamination by line-of-sight interstellar polarization. Overall, the sample exhibits a wide diversity in polarization properties. The main characteristics of the intrinsically polarized objects may be summarized as follows.
-
1.
Large variations in both the degree and PA of polarization with line-of-sight velocity across the broad H emission line are common.
-
2.
15 objects exhibit a change in polarization PA over the broad H line with approximately half of these showing PA rotations from blue-to-red within the H profile.
-
3.
The broad H line is usually depolarized relative to the adjacent continuum but in many cases the dip in polarization is associated mainly with the core of the line profile and is often flanked by polarization peaks in the red and blue wings, the blue wing peak usually being the most prominent.
-
4.
In 4 objects there is an increase in percentage polarization over the broad H line relative to the adjacent continuum, and in the two for which we have sufficient wavelength coverage, the continuum polarization rises to the blue.
-
5.
In general, there appears to be no simple relationship between the velocity dependences of the polarization PA and the degree of polarization across the H profile, in the sense that the presence of a blue-to-red PA rotation does not uniquely correspond to any particular type of percentage polarization structure.
-
6.
Several objects were observed at two or more epochs and in 3 of these (Mrk 509, Akn 120 and NGC 7469) there is convincing evidence that the polarization of the broad H line varies over a timescale of year.
-
7.
Of the 10 objects for which radio PA’s are available, the average position angles of polarization are approximately parallel to the radio axis in 6 objects and approximately perpendicular in the remaining 3.
-
8.
In a number of the ‘parallel’ objects, the blue-to-red rotation in polarization PA across the H profile crosses the radio source PA. In some extreme cases (Akn 120 and KUV 18217+6419) the polarization E vector changes alignment across the profile from parallel to perpendicular to the radio axis.
We argue that much of the observed diversity in polarization properties, including the main features of the distinctive polarization structures associated with the H line, can be explained by a model in which the broad Balmer line emission comes from a rotating disk and is scattered by two separate scattering regions producing orthogonally polarized light. These are:
-
1.
a near-field scattering ring co-planar with the line-emitting disk and situated within the torus, in its equatorial plane;
-
2.
a far-field scattering cone situated outside the torus but aligned with the torus/disk axis.
The relative importance of these two scattering regions as sources of polarized light is governed primarily by the inclination of the system axis to the line-of-sight. The polarization properties of Type 1 Seyfert nuclei can be broadly classified in an orientation sequence. Thus,
-
1.
weakly polarized objects are near pole-on systems;
-
2.
objects polarized parallel to the radio axis and exhibiting signatures of equatorial scattering in H polarization (i.e., a peak-trough-peak variation in percentage polarization and/or a blue-to-red PA rotation across the line profile), are viewed at intermediate orientations and are dominated by equatorial scattering;
-
3.
objects polarized perpendicular to the radio axis and exhibiting an increase in polarization to short wavelengths, with local peaks associated with the broad emission-lines, are viewed at grazing incidence to the circum-nuclear torus and are dominated by polar scattering.
The latter category, of which we have identified 3 possible members amongst our sample, with a further example from the literature, have polarization properties that are essentially identical to those of Seyfert 2 galaxies in which polarized broad-lines have been detected. As in Type 2’s, the presence of an underlying, unpolarized continuum is required to explain both the continuum polarization wavelength dependence and the increases in degree of polarization over the broad-lines. The equatorial component of scattered light must also be suppressed for polar scattering to dominate the observed polarization. Both conditions can be satisfied if the direct line-of-sight to the BLR and equatorial scattering region passes through the upper layers of the torus, so that the nuclei of these objects suffer a higher degree of extinction than other Seyfert 1s. This group represents direct observational evidence that a Seyfert 2-like polar scattering region (the ‘mirror’ that allows us to detect the hidden BLR in some objects) is also present in Seyfert 1 galaxies.
Type 2 Seyfert galaxies can, themselves, be straightforwardly incorporated into this scheme, since at yet larger inclinations, the direct line-of-sight to both the BLR and the equatorial scattering region is blocked by the torus and a Seyfert 2 nucleus with polarized (polar-scattered) broad-lines will be observed.
The narrow-line Seyfert 1 galaxies in our sample display a range of polarization properties that is not strikingly different from that of the sample as a whole. There is no compelling evidence that they are viewed from a preferred orientation, or that their broad-line regions are partially obscured.
The model we have outlined, while providing an explanation for the key features of our data, cannot in its basic form account for the entire range of polarization behaviour exhibited by individual objects. There are many possible effects that may modify the H polarization from that predicted by the model. Nevertheless, it serves as a useful framework for a general understanding of the polarization properties of Seyfert 1 galaxies and provides an insight into the relationship between the scattering geometries of Type 1 and 2 Seyfert nuclei. Detailed scattering calculations based on this model will be presented in future papers.
Acknowledgements
JES acknowledges financial support from a PPARC studentship. AR thanks the Royal Society for financial support. The WHT is operated on the island of La Palma by the Isaac Newton Group in the Spanish Observatorio del Roque de los Muchachos of the Instituto de Astrofisica de Canarias. We thank the staff of the AAT for help in performing the observations at this telescope. The work reported in this paper was partly carried out using facilities and software provided by the Starlink project. This research has made use of the NASA/IPAC Extragalactic Database (NED) which is operated by the Jet Propulsion Laboratory, California Institute of Technology, under contract with the National Aeronautics and Space Administration.
References
- [1] Antonucci R.R.J., 1983, Nature, 303, 158
- [2] Antonucci R.R.J., 1984, ApJ, 278, 499
- [3] Antonucci R.R.J., Miller J.S., 1985, ApJ, 297, 621
- [4] Antonucci R.R.J., 2001, in Trujillo-Bueno, J., Moreno-Insertis, F., Sanchez, F., eds, Astrophysical Spectropolarimetry, Cambridge University Press, Cambridge
- [5] Bailey J.A., 1997, tsp–version 2.3, Starlink User Note 66.5
- [6] Baum S.A., O’Dea C.P., Dallacassa D., de Bryuyn A.G., Pedlar, A., 1993, ApJ, 419, 553
- [7] Blundell K.M., Lacy M., 1995, MNRAS, 274, L9
- [8] Brindle C., Hough J.H., Bailey J.A., Axon D.J., Ward M.J., Sparks W.B., McLean I.S., 1990, MNRAS, 244, 577
- [9] Capetti A., Axon D.J., Kukula M., Macchetto F., Pedlar A., Sparks W.B., Boksenberg A., 1995, ApJ, 454, L85
- [10] Christopoulou P.E., Holloway A.J., Steffen W., Mundell C.G., Thean A.H.C., Goudis C.D., Meaburn J., Pedlar A., 1997, MNRAS, 284, 385
- [11] Cohen M.H., Ogle P.M., Tran H.D., Goodrich R.W., Miller J.S., 1999, AJ, 118, 1963
- [12] Cohen, M.H., Martel, A.R., 2001, in Crenshaw, D.M., Kraemer, S.B., George, I.M., eds, ASP Conf. Ser., Mass Outflow in Active Galactic Nuclei: New Perspectives, Astron. Soc. Pac., San Francisco, in press
- [13] Condon J.J., Yin Q.F., Thuan T.X., Boller Th., 1998, AJ, 116, 2682
- [14] Corbett, E.A., Robinson, A., Axon, D.J., Young, S., Hough, J.H., 1998, MNRAS, 296, 721
- [15] Giannuzzo M.E., Mignoli M., Stirpe G.M., Comastri A., 1998, A&A, 330, 894
- [16] Goodrich R.W., 1989a, ApJ, 340, 190
- [17] Goodrich R.W., 1989b, ApJ, 342, 224
- [18] Goodrich R.W., Miller J.S., 1994, ApJ, 434, 82 (GM94)
- [19] Grupe, D., Wills, B.J., Wills, D., Beuermann, K., 1998, A&A, 333, 827
- [20] Grupe, D., 2000, New Astron. Rev., 44, 455
- [21] Harries T.J., 1996, polmap, Starlink User Note 204.1
- [22] Hutchings J.B., Neff S.G., 1992, AJ, 104, 1
- [23] Keel, W.C., 1980, AJ, 85, 198
- [24] Kellerman K.I., Sramek R.A., Schmidt M., Green R.F., Shaffer D.B., 1994, AJ, 108, 1163
- [25] Kinney, A.L., Schmitt, H.R., Clarke, C.J., Pringle, J.E., Ulvestad, J.S., Antonucci, R.R.J., 2000, ApJ, 537, 152
- [26] Kukula M.J., Pedlar A., Baum S.A., O’Dea C.P., 1995, MNRAS, 276, 1262
- [27] Lawrence, A., 1991, MNRAS, 252, 586
- [28] Martel A.R., 1996, PhD Thesis, UCO/Lick Observatory, Univ. California, Santa Cruz (M96)
- [29] Miller J.S., Goodrich R.W., 1990, ApJ, 355, 456
- [30] Miller J.S., Goodrich R.W., Mathews W.G., 1991, ApJ, 378, 47
- [31] Miller P., Rawlings S., Saunders R., 1993, MNRAS, 263, 425
- [32] Miyaji T., Wilson A.S., Perez–Fournon I., 1992, ApJ, 385, 137
- [33] Moran E.C., 2000, New Astron. Rev., 44, 527
- [34] Osterbrock D.E., Pogge R.W., 1985, ApJ, 297, 166
- [35] Peterson B.M., 1999, in Gaskell, C.M., Brandt, W.N., Dultzin-Hacyan, D., Dietrich, M., M. Eracleous, M., eds, ASP Conf. Ser. Vol. 175, Structure and Kinematics of Quasar Broad Line Regions, ed. (San Francisco: ASP), p. 49
- [36] Phillips M.M., 1976, ApJ, 208, 37
- [37] Schelegel D.J., Finkbeiner D.P., Davis M., 1998, ApJ, 500, 525
- [38] Schmid H.M., Appenzeller I., Camenzind M., Dietrich M., Heidt J., Schild H., Wagner S., 2000, in Bergeron, J., ed, Proc. SPIE Vol. 4005, Discoveries and Research Prospects from 8- to 10-Meter-Class Telescopes, p. 264
- [39] Schmid H.M., Appenzeller I., Camenzind M., Dietrich M., Heidt J., Schild H., Wagner S., 2001, A&A, 372, 59
- [40] Schmitt, H.R., Antonucci, R.R.J., Ulvestad, J.S., Kinney, A.L., Clarke, C.J., Pringle, J.E., 2001, ApJ, 555, 663
- [41] Serkowski K., Mathewson D.S., Ford V.L., 1975, ApJ, 196, 261
- [42] Shortridge K., Meyerdierks H., Currie M., Clayton M., Lockley J., Charles A., Davenhall C., Taylor M., 1999, figaro–version 5.5-0, Starlink User Note 86.17
- [43] Singh K.P., Westergaard, N.J., 1992, A&A, 264, 489
- [44] Ulvestad J.S., Wilson A.S., 1984a, ApJ, 278, 544
- [45] Ulvestad J.S., Wilson A.S., 1984b, ApJ, 285, 439
- [46] Van der Hulst J.M., Crane P.C., Keel W.C., 1981, AJ, 86, 1175
- [47] Véron-Cetty, M.-P., Véron, P., 1998, A Catalogue of quasars and active nuclei – 8th ed, ESO Scientific Report no 18, European Southern Observatory, Garching
- [48] Wanders I. et al., 1995, ApJ, 453, L87
- [49] Wilson A.S., Ulvestad J.S., 1982, ApJ, 260, 56
- [50] Young S., 2000, MNRAS, 312, 567
- [51] Young S., Hough J.H., Axon D.J., Bailey J.A., Ward M.J., 1995, MNRAS, 272, 513
- [52] Young S., Hough J.H., Efstathiou A., Wills B.J., Bailey J.A., Ward M.J., Axon D.J., 1996, MNRAS, 281, 1206
- [53] Young S., Corbett E.A., Giannuzzo M.E., Hough J.H., Robinson A., Bailey J.A., Axon D.J., 1999, MNRAS, 303, 227