The B3–VLA CSS sample. III: EVN & MERLIN images at 18 cm
EVN and MERLIN observations at 18 cm are presented for 18 Compact Steep–spectrum radio Sources (CSSs) from the B3–VLA CSS sample. These sources were marginally resolved in previous VLA A-configuration observations at 4.9 and 8.4 GHz or had peculiar morphologies, two of them looking like core–jets. The MERLIN images basically confirm the VLA structures at 8.4 GHz while the EVN and/or the combined images reveal several additional details.
Key Words.:
galaxies: active – radio continuum:galaxies – quasar: general1 Introduction
This paper is the third in a series, aimed at studying in detail the morphology of a new sample of CSSs (Compact Steep–spectrum Sources) & GPSs (GHz Peaked–spectrum Sources) (see O’Dea, ode2 (1998) for the class definition and for a review of its properties).
The sample (Fanti et al. fan3 (2001), Paper I) was selected from the B3–VLA sample (Vigotti et al. vig2 (1989)) with the purpose of increasing significantly the existing statistics for sources with Linear Size ()111 km s-1Mpc-1, q in the range 0.4(kpc). The scientific motivations for such a project have been illustrated in the companion papers by Fanti et al. (fan3 (2001)) and by Dallacasa et al. (dalla (2002), Paper II). The sample consists of 87 CSSs/GPSs and has VLA observations at 1.4 GHz (A and C configurations) and at 4.9 and 8.4 GHz (both A configuration). A number of sources were not or poorly resolved even at the highest VLA resolution ( arcsec at 8.4 GHz). For them two VLBI observing projects were undertaken: VLBA observations, addressed to the most compact sources, are presented in Paper II. This paper, instead, deals with the 18 sources presented in next section.
2 The source sample and the EVN & MERLIN observations
From the B3-VLA CSS sample we selected the sources which were slightly resolved ( arcsec) by the VLA at 8.4 GHz, or showed complex or unclear morphologies on arcsec scales, requiring further investigation for a better morphological classification.
The sample is presented in Table 1, which contains the following information:
| Name | Id | z | LogP0.4GHz | SM | SEVN | Morphology | ||||
|---|---|---|---|---|---|---|---|---|---|---|
| (arcsec) | (W/Hz ) | (mJy) | (mJy) | (arcsec) | (kpc ) | |||||
| (1) | (2) | (3) | (4) | (5) | (6) | (7) | (8) | (9) | (10) | (11) |
| 0039+391 | G | 1.01 | 0.34 | 27.19 | 251 | 156 | 0.38 | 1.6 | MSO | |
| 0110+401 | Q | 20.0 | 1.479 | 27.44 | 481 | 153 | 2.2 | 9.4 | ? | |
| 0123+402 | G | 23.8 | 1.1 | 26.4 | 224 | 161 | 1.22 | 5.2 | MSO | |
| 0140+387 | G | 2.9 K | 0.7 | 28.55 | 340 | 116 | 1.10 | 4.1 | MSO? | |
| 0255+460 | Q | 20.5 | 1.21 | 0.66 | 27.51 | 534 | 148 | 0.75 | 3.2 | MSO |
| 0722+393A | E | 0.25 | 26.9 | 880 | 832 | 0.30 | 1.3 | MSO | ||
| 0748+413B | E | 26.4 | 167 | — | — | — | ? | |||
| 0754+396 | G | 2.119 | 28.06 | 426 | 139 | 2.6 | 10 | ? | ||
| 0810+460B | G | 20.3 | 0.33 R | 0.63 | 26.74 | 932 | 274 | 1.03 | 3.0 | MSO |
| 0902+416 | E | 0.34 | 26.4 | 425 | 414 | 0.33 | 1.4 | MSO | ||
| 1027+392 | E | 26.4 | 339 | — | — | — | ? | |||
| 1039+424 | E | 26.4 | 227 | 8 | 1.5 | 6.4 | ? | |||
| 1128+455 | G | 18.7 | 0.40 | 26.98 | 1765 | 1289 | 0.5 | 1.6 | MSO? | |
| 1157+460 | G | 21.3 | 0.742 | 27.29 | 961 | 763 | 0.62 | 2.5 | MSO? | |
| 1212+380 | G | 24.0 | 1.5 K | 0.3 | 27.63 | 247 | 104 | 0.47 | 2.0 | MSO |
| 1241+411 | G | 17.7 | 0.259 | 25.72 | 330 | 169 | 0.74 | 1.9 | MSO | |
| 2301+443 | G | 1.7 K | 0.5 | 28.34 | 975 | 737 | 0.50 | 2.1 | MSO | |
| 2349+410 | Q | 19.2 | 2.046 | 1.2 | 27.99 | 376 | 145 | 0.82 | 3.3 | MSO |
Column 1 - Source name;
Column 2 - Optical identification (Id) from Paper I (G = galaxy, Q = quasar; E = no known optical counterpart);
Column 3 - R magnitude;
Column 4 - redshift; “K” and “R” indicate that the redshift is estimated by photometric measurements in the respective optical band (see Paper I for details);
Column 5 - VLA Largest Angular Size, , (arcsec) from Paper I;
Column 6 - log P0.4GHz (P in W/Hz ); for E sources lower limits to the observed radio power have been computed for (see also Paper I for a wider discussion);
Column 7 - MERLIN total flux density (mJy) from integration over the source image (Sect. 3);
Column 8 - EVN total flux density (mJy) from integration over the source image (Sect. 3), when available;
Column 9 - Largest Angular Size, , (arcsec) from the present paper, measured on the most appropriate image, (E/M) (see Sect. 3.1 and Fig. 3)
Column 10 - Largest Linear Size, , (kpc) from data in Col. 9. For E sources has been assumed (see also Paper I) and , preceeded by a “”, can be considered a lower limit.
Column 11 - morphology as derived from the present paper: MSO - Medium Symmetric Object (Fanti et al. fan1 (1995), Readhead et al. read (1996)); a “?” marks the cases without classification.
The EVN & MERLIN observations were carried out simultaneously at the frequency of 1.66 GHz, from June 2nd to June 4th, 1999. The combined use of both arrays was dictated by the need of studying the source structures at both high (several mas) and intermediate (tens of mas) resolutions for a better description of both the compact and the more resolved structures.
(a) (b)
The EVN array consisted of the eight telescopes in Effelsberg, Cambridge, Jodrell Bank (MKII), Medicina, Noto, Onsala (26 m), Westerbork (tied array) and Toruń, with projected baselines ranging from 0.8 M to 13 M. The MERLIN made use of the six stations of Defford, Cambridge, Knockin, Darnhall, Tabley and MKII in Jodrell Bank, with coverage approximately in the range 0.04–1.2 M. The baseline Cambridge–MKII, common to both arrays, was used for consistency checks on the flux density scales of the two sets of visibility data.
The EVN recorded left-hand circular polarization (), with a total bandwidth of 28 MHz, divided into seven 4–MHz IFs (MkIII mode B). The MERLIN recorded both right-hand and left-hand circular polarization ( and ), with 16 MHz bandwidth for each polarization hand, at all stations but Cambridge. In fact, due to limitations in the transmission bandwidth of the MERLIN radio–links, for this station had to be recorded also on the channel generally used for in order to be able to use Cambridge also as an EVN element with a bandwidth comparable to that of the other stations. This resulted in the availability of data only in the MERLIN–only data set for all the baselines to Cambridge.
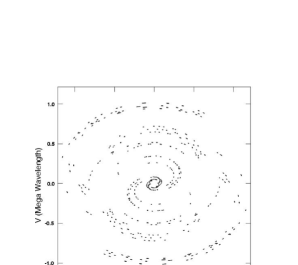
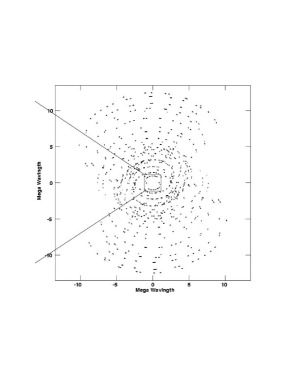
Every source was observed for a total of about 2 hours. Target source observations were interleaved, every 3–4 hours, with observations of the flux density calibration sources DA193 and OQ208. In order to obtain a good coverage, each source observation was spread into several scans, each 400 seconds long. An example of the coverage of the two arrays is given in Fig. 1. The MERLIN coverage is clearly more sparse than that of the EVN, due the smaller number of stations. This however is not critical given the relatively simple structure of the radio sources at MERLIN resolution and has the merit of filling the short baseline gap of the EVN, thus ensuring the possibility of recovering the whole source flux density (Sect. 3) at the resolution of the combined array.
3 Data reduction
All the data reduction was made using the AIPS software except for the a–priori MERLIN calibration. The latter was performed by means of a specific pipeline procedure developed at Jodrell Bank.
The EVN data were correlated with the Bonn processor at the Max Plank Institute für Radioastronomie. Visibility amplitudes were calibrated using the AIPS standard procedure which makes use of the system temperature and gain information provided by the individual stations. The flux density scale was based on DA193 (S2.03 Jy) and OQ208 (S0.98 Jy) whose flux densities were derived from the simultaneous MERLIN observations.


Fringe fitting was then performed by means of the AIPS task FRING. For some sources the rate of failed solutions exceeded 20–30 %. This was not considered satisfactory and two different approaches were adopted to improve the situation. FRING was run on sub–sets of baselines using the same reference antenna in order to force the search for delay, rate and phase on relatively short baselines. When this did not provide a significant decrease in the number of failed solutions, the delay, rate and phase solutions found for the closest well detected target source were applied. For B and all the approaches did not provide significant results, and it was not possible to obtain an EVN image. For and , instead the fraction of failed solutions, occurring mostly on the longest baselines, is just barely acceptable. The images of these sources are therefore poorer (see Sect. 4).
We have compared the total flux densities in our MERLIN images () with those at low resolution () obtained by interpolating to our observing frequency the values from the database by Vigotti et al. (vig (1999)). The two flux density sets agree satisfactorily with an average ratio of 1.02 and a dispersion of 0.06 (r.m.s.). This indicates that no flux calibration errors nor significant flux density losses are present in the MERLIN images. In Fig. 2 we plot vs and the histogram of the ratio , where , if positive, represents the deficiency of MERLIN flux density with respect to the interpolated total flux density. Only for two sources (0255+460, 0748+413B) MERLIN appears to have missed more than 10% of the expected flux density (see Sect. 4). No correlation between and or and is present.
3.1 Source images
The radio images were produced initially for MERLIN and EVN independently, using the AIPS task IMAGR after a number of phase self–calibrations, occasionally ended by a final amplitude self–calibration. This last step was made with great care, and for the MERLIN data alone, as the amplitude self–calibration tends to depress the total flux density when extended components are poorly sampled in the plane. Afterwards the visibilities from the two arrays were merged and these data were self–calibrated again in order to align the phases of the two arrays.
We produced at the end up to three images for each radio source, at low (MERLIN–only, 160 mas), intermediate (EVN & MERLIN 40 mas) and high (EVN–only, 18 mas) resolution. For the two sources B and , whose EVN data were quite poor, only the MERLIN images are given.
In general the source flux density has been fully recovered in the combined EVN & MERLIN images and agrees with the MERLIN total flux density. The ratio of these flux densities has a dispersion of 0.09 (r.m.s.) around the mean value of unity. Exceptions are mentioned in Sect. 4.
The actual median r.m.s. noise level (), measured on the images far from the sources, is, with a few exceptions, around 0.2 mJy/beam, not far from the thermal noise, for all three sets of images. The median dynamic range, defined as the ratio of peak brightness to 1 of the noise, is 1600:1 for MERLIN–only, 300:1 for EVN & MERLIN and 100:1 for EVN–only.
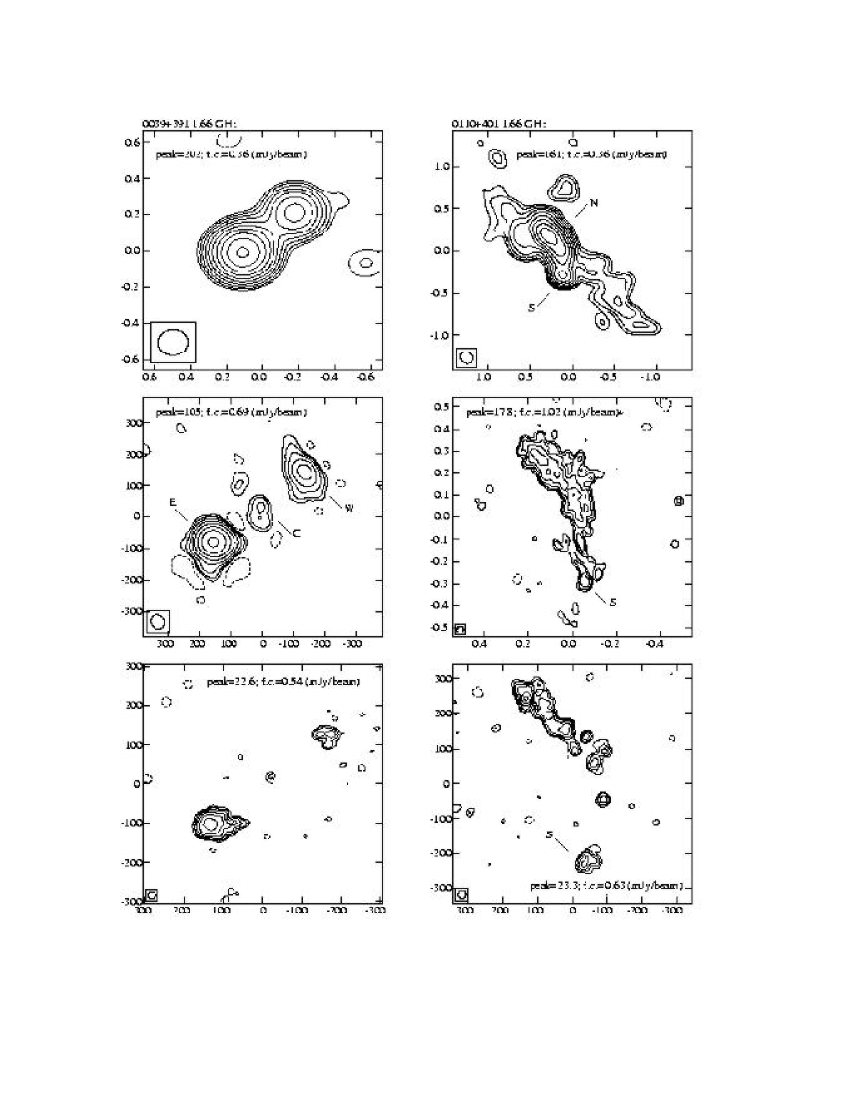
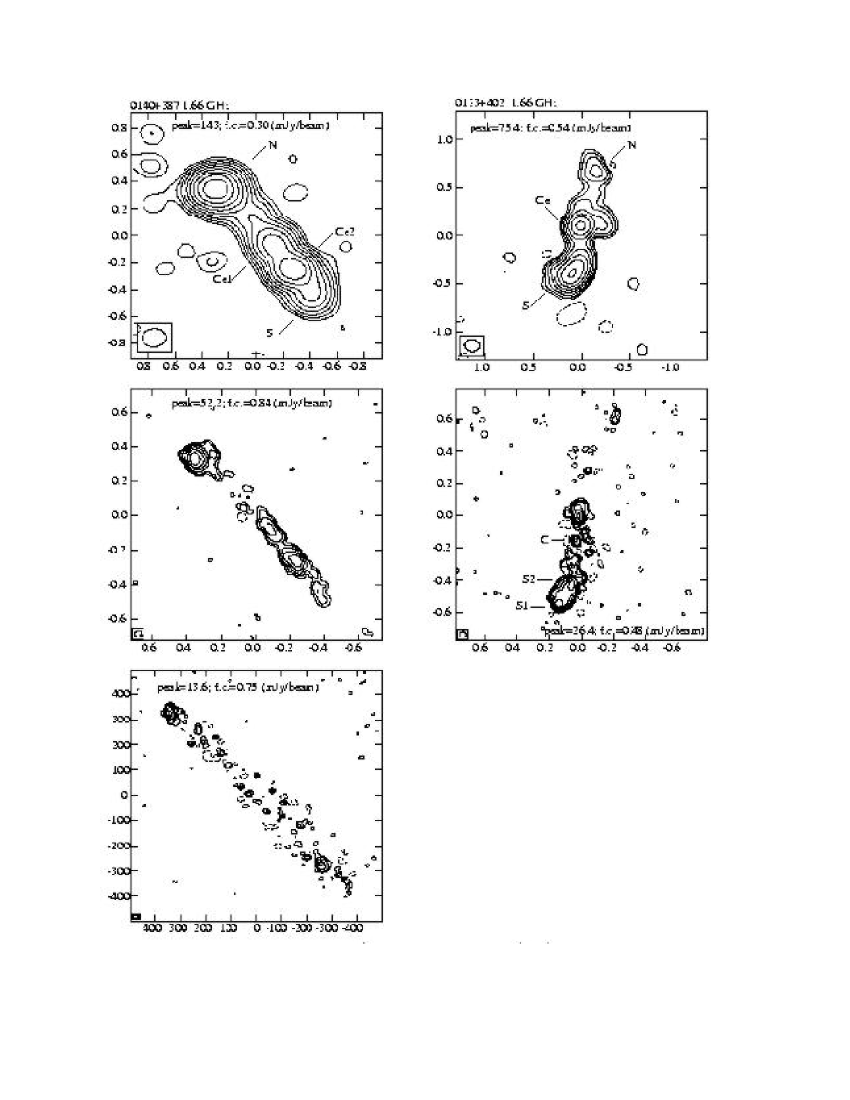
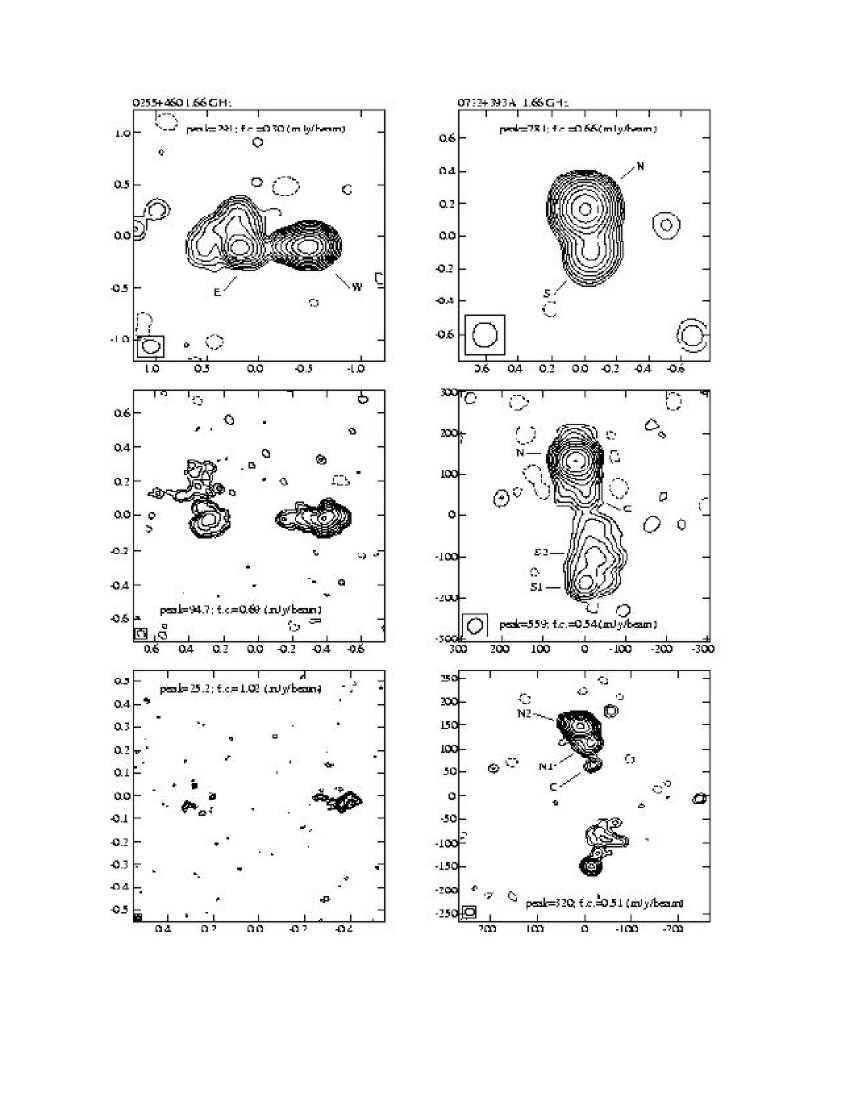
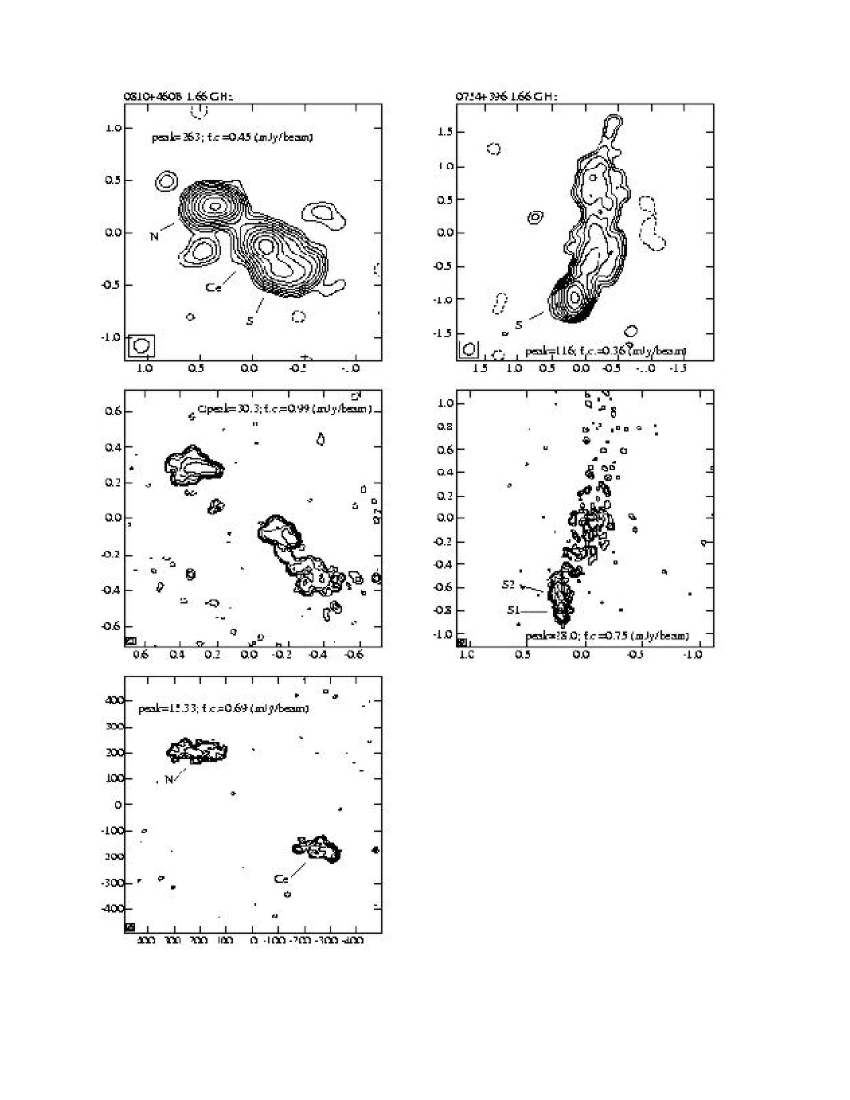
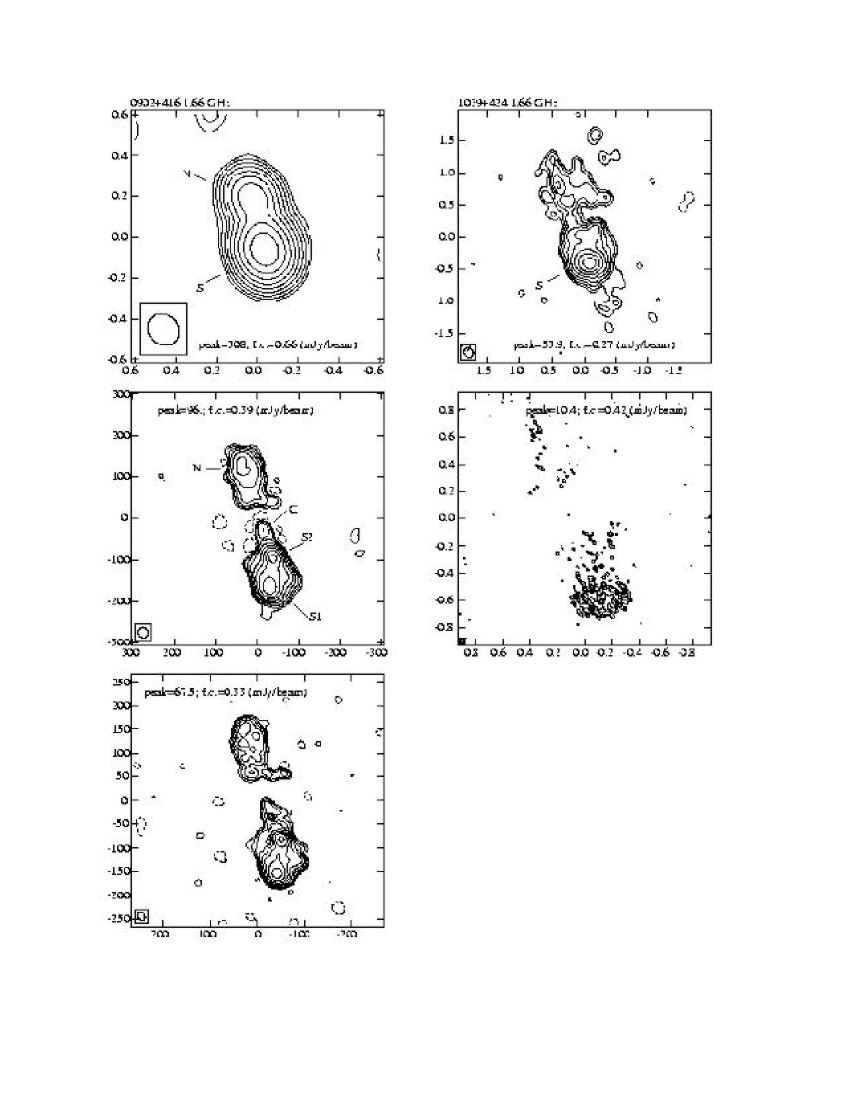
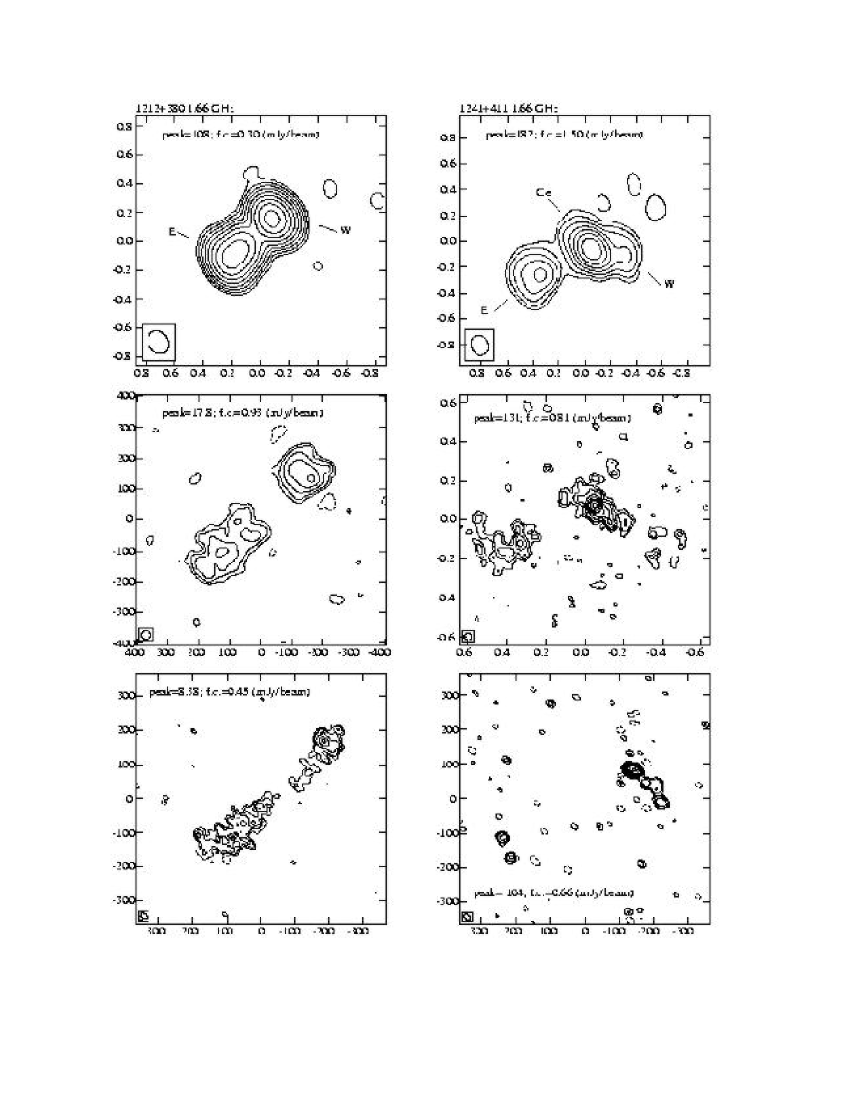
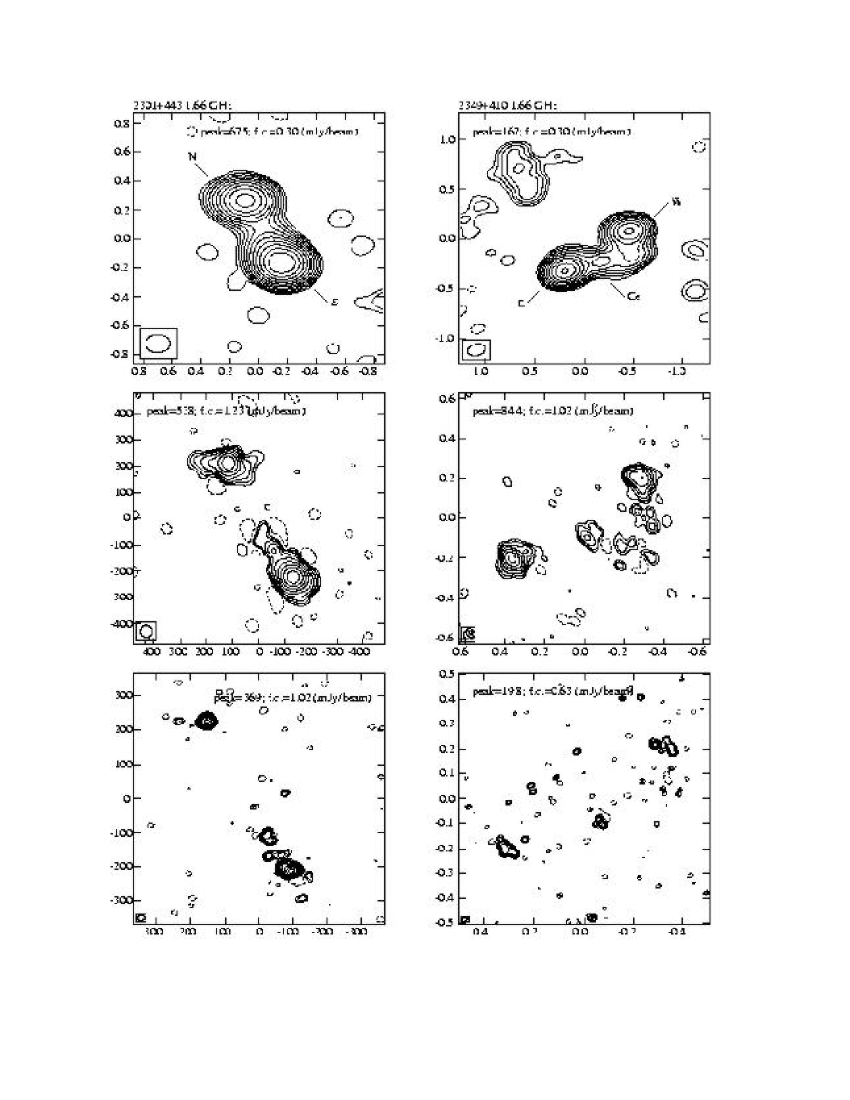
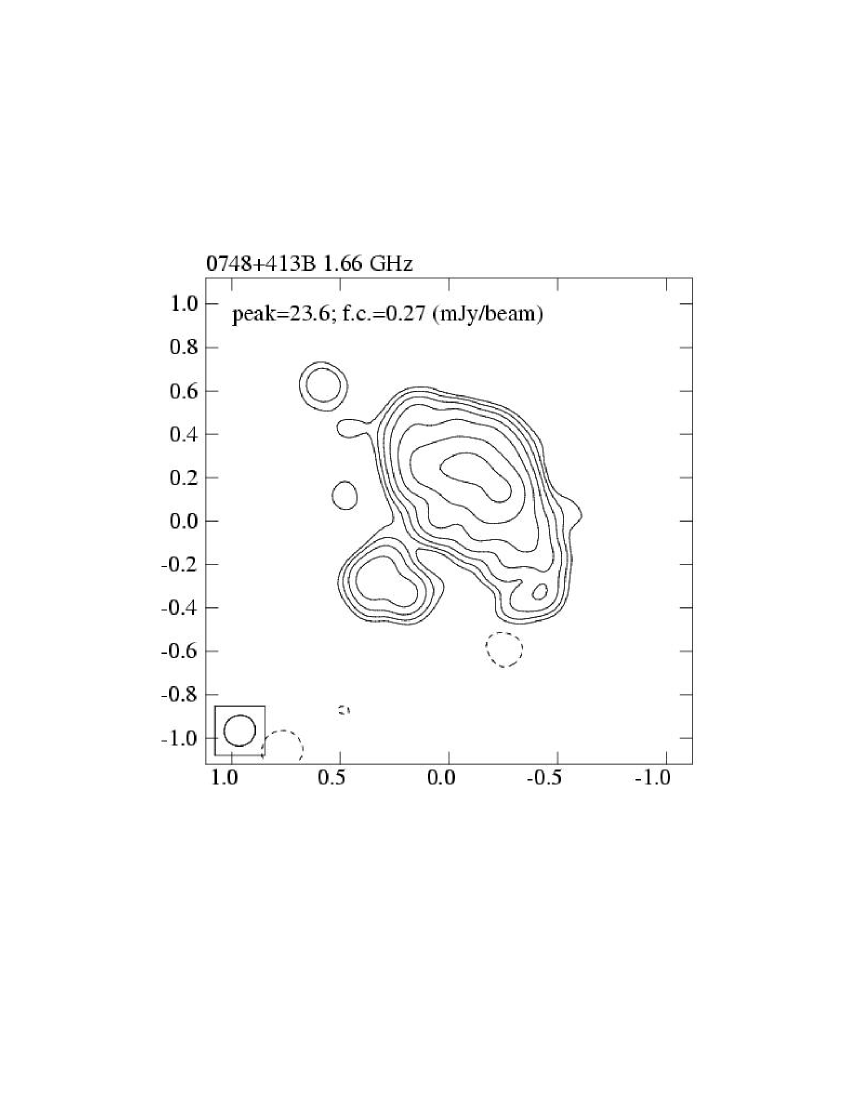
All images are shown in Fig. 3 and Fig. 4. They are usually displayed in R.A. order; exceptions are due to layout constraints. On the plot itself the following information is found: a) peak flux density in mJy/beam; b) first contour (f.c.) in mJy/beam corresponding to the 3 r.m.s. actual noise of the image; contours increase by a factor of 2; c) beam Half Maximum Width (HMW), represented by the lower left–hand corner ellipse.
Moreover: i) components are labelled according to Table 2 on the more convenient image; ii) relative RA and Dec are expressed either in mas (integer) or arcsec (decimal); iii) the coordinate origin corresponds to the center of each image shown in Fig. 3 and has no relation with the actual source position;

3.2 Source Parameters
| Name | c | SM | SE+M | p.a | SEVN | p.a |
| mJy | mJy | mas deg | mJy | mas deg | ||
| (1) | (2) | (3) | (4) | —– (5) —– | (6) | —– (7) —– |
| 0039+391 | W | 35 | 36 | 7039 34 | [12] | |
| C | 7 | 6918 34 | — | |||
| E | 216 | 218 | 5045 98 | 143 | 4437 105 | |
| 0110+401 | N | 373 | [125] | |||
| S | 36 | 18 | 6031 9 | 18 | 4015 153 | |
| ext | [78] | — | — | |||
| 0123+402 | N | 14 | — | — | ||
| Ce | 55 | 36 | 6918 3 | [32] | ||
| C | 5 | unres | 6 | unres | ||
| S | 146 | [124] | ||||
| S2 | 75 | 9243 160 | — | |||
| S1 | 70 | 7353 174 | — | |||
| 0140+387 | S | 22 | — | |||
| Ce2 | 83 | 86 | 8447 47 | 25 | 3624 12 | |
| Ce1 | 49 | 39 | 10843 29 | — | ||
| N | 176 | 150 | 6652 23 | 46 | 4114 10 | |
| 0255+460 | W | 396 | 313 | 9444 115 | [128] | |
| E | 94 | 74 | 8751 120 | — | ||
| E tail | 44 | [52] | — | |||
| 0722+393A | N | 807 | [783] | |||
| N2 | 711 | 2515 72 | 744 | 2516 73 | ||
| N1 | 35 | 4718 104 | 37 | 1613 114 | ||
| C | — | 7 | unres | |||
| S | 73 | [49] | ||||
| S2 | 56 | 8856 2 | — | |||
| S1 | 25 | unres | 24 | 95 38 | ||
| 0748+413B | 167 | — | — | |||
| 0754+396 | N tail | [166] | [36] | |||
| S | 260 | [112] | ||||
| S2 | 78 | 9539 24 | — | |||
| S1 | 58 | 5728 161 | — | |||
| 0810+460B | S | 234 | — | |||
| Ce | 253 | [111] | ||||
| 91 | 5035 48 | 36 | 2716 41 | |||
| N | 407 | [161] | ||||
| 0902+416 | S | 343 | ||||
| S2 | 130 | 3922 12 | 105 | 2915 4 | ||
| S1 | 214 | 3628 18 | 209 | 3825 2 | ||
| C | 4 | 216 11 | 7 | 3416 49 | ||
| N | 83 | [71] | ||||
| 1027+392 | C | 182 | — | — | ||
| ext | [157] | — | — | |||
| 1039+424 | S | 146 | — | |||
| N tail | [76] | [55] | — | |||
| 1128+455 | W | 142 | [123] | [59] | ||
| N | 589 | [533] | [409] | |||
| C | 79 | 11818 135 | 22 | 4210 143 | ||
| S | 1034 | [845] | ||||
| 866 | 5536 178 | 312 | 3115 161 | |||
| 1157+460 | W | 83 | [52] | |||
| 75 | 5555 50 | 37 | 3730 32 | |||
| S | 368 | [247] | ||||
| 204 | 9444 163 | 79 | 4521 158 | |||
| N | 474 | [459] | ||||
| 386 | 3521 131 | 315 | 2613 127 |
| Name | c | SM | SE+M | p.a | SEVN | p.a |
| mJy | mJy | mas deg | mJy | mas deg | ||
| (1) | (2) | (3) | (4) | —– (5) —– | (6) | —– (7) —– |
| 1212+380 | W | 126 | [33] | |||
| E | 121 | [61] | ||||
| 1241+411 | W | 34 | [16] | — | ||
| Ce | 220 | [159] | ||||
| 164 | 2517 52 | 133 | 136 77 | |||
| E | 64 | — | ||||
| 2301+443 | S | 725 | [568] | |||
| 662 | 2621 62 | 516 | 1310 85 | |||
| N | 233 | [142] | ||||
| 190 | 2824 75 | 136 | 1410 17 | |||
| 2349+410 | W | [136] | 93 | 8848 63 | [31] | |
| Ce | 23 | 16 | 7647 44 | [14] | ||
| E | 190 | [82] | ||||
| 171 | 7538 49 | 72 | 4128 16 |
Source parameters are given in Table 2 is as follows:
Columns 1 and 2 – Source name and sub–component label;
Column 3 – MERLIN flux density (usually from JMFIT);
Column 4 – EVN & MERLIN flux density from JMFIT or TVSTAT (in square brackets). Flux densities are not reported when they do not differ significantly from MERLIN’s. A “—” means no component visible at intermediate resolution;
Column 5 – major and minimum, beam–deconvolved, angular size and major axis position angle (from JMFIT) at EVN & MERLIN resolution;
Columns 6 and 7 – as for columns 4 & 5 but for EVN–only images.
Source components are usually named from the lowest resolution image (MERLIN) as North (), South (), East (), West (), and Central (). When a component is split into more pieces, a digit (1,2, etc) is added (e.g. , ). Occasionally a candidate core () is mentioned.
Depending on the component angular scale resolution, flux densities are derived by either gaussian fits to the brightness distribution (AIPS task JMFIT) or by integration over the component brightness distribution (AIPS task TVSTAT, values in square brackets in Table 2). In order not to give redundant information we follow this approach:
– for MERLIN–only images the flux densities of individual source components are always from JMFIT except for a few extended features for which we used TVSTAT (see Sect. 4 for angular sizes);
– at the higher resolutions, we give flux density, Half Maximum Widths (HMW) and p.a. (from JMFIT) for the brightest and most compact sub–structures only;
– for the EVN–only images we give, in addition, also the component total flux density “seen” by the interferometer (from TVSTAT, in square brackets), except when the latter is not too different from the value at lower resolution;
– for EVN & MERLIN images this last information is generally unnecessary since the individual component total flux densities usually agree with those “seen” by MERLIN.

4 Comments on individual sources
– 0039+391: at MERLIN resolution this source is double, thus confirming the hint of structure seen at 8.4 GHz in Paper I. At higher resolutions a third component appears in between the two major ones. It accounts for 2 mJy in the EVN image, and could host the source core, but we do not have spectral information to affirm this.
– 0110+401: part of the extended structure visible in the VLA images (Paper I) is present in the MERLIN image as a two–sided tail, arcsec long, extending on both sides of the compact components. The total flux density in the combined image is 65 mJy (14 %) lower than in the MERLIN one since the extended structure is not visible here. In the EVN image several bright features are aligned along an elongated bent structure, ending with a bright spot at each extreme. Structural uncertainties, however, are likely present due the low data quality of EVN (see Sect. 3).
– 0123+402: at MERLIN resolution the very asymmetric triple structure described in Paper I is confirmed, although all components show now some substructure. At higher resolutions component is mostly resolved out. This is likely the reason why about 20 mJy (9 %) of the MERLIN flux density is missing in the combined image. Several bright knots appear in the other components, but the low quality of EVN data (see Sect. 3) reduces the reliability of some of them. The EVN–only image is not shown for this reason. The compact component could host or be the source core, although the lack of spectral information does not allow to confirm this.
– 0140+387: in Paper I this source looks like a simple double, while at MERLIN and EVN & MERLIN resolutions the two main components appear connected by a bridge of emission. All the components are resolved in the combined image. In the EVN image part of the extended emission is still present, although totally fragmented. Only the two extreme spots stand out and are reliably detected, while no unresolved component is visible to suggest the presence of the candidate core.
– 0255+460: the double structure seen in Paper I is confirmed but the Eastern component displays a sort of curved tail, arcsec in size, pointing to North and then to East (E tail in Table 2). About 12 % of the total flux density ( 70 mJy) is missing in the MERLIN image, probably in the extended eastern component. In the EVN image only component is clearly visible: it appears as a wiggling structure accounting for 128 mJy ( % of the EVN total flux density). Some weak low brightness emission is present at the position of component .
– 0722+393A: at MERLIN resolution the source appears as a very asymmetric double (component flux density ratio 11:1), as it could have been already guessed (Paper I). At intermediate resolution more structure is present. In the EVN image, a number of knots are visible. Remarkable are the hot–spot and component , which, due to its location, could be the source core. However no spectral information is available to confirm this. The confusing source B3 0722+393B of mJy at 1.4 GHz (FIRST, Becker et al. beck (1995)) arcmin to South–East had to be subtracted from the MERLIN visibility data.
– 0748+413B: only the MERLIN image (Fig. 4) could be produced (see Sect. 3.1). The source shape could recall the ending section of a lobe whose core is located somewhere to the South–East. Actually a weak source (=17.3 mJy, Paper I) is present 13.8 arcsec in this direction. No emission is visible between the two structures neither on FIRST (Becker et al. beck (1995)) nor in a low resolution MERLIN image (not shown). About 40 mJy (19 %) are missing with respect to the expected total flux density, only part of which due to the secondary component.
– 0754+396: the arcsec long structure visible in Paper I is confirmed in great detail in the MERLIN image, although some 30 mJy ( 7 %) are missing. In the EVN & MERLIN image the strong component starts with a bright hot–spot () and extends to North to join a wiggling fragmented jet. The EVN–only image (not shown) presents only a set of knots whose location is rather uncertain given the low quality of EVN data (see Sect. 3). This source was classified as “cJ?” in Paper I but a “standard” clear core component is not visible. The EVN & MERLIN image could also be reminiscent of a Narrow Angle Tail () radio galaxy, as often seen in galaxy clusters, usually on larger scales. A weak source of =5.5 mJy, 11.1 arcsec to South West (Paper I) is likely an unrelated source since no emission is visible between the two structures neither on FIRST (Becker et al. beck (1995)) nor in a low resolution MERLIN image (not shown).
– 0810+460B: the double structure seen in Paper I is now split into three well resolved components, none of which has a flat spectrum. When the EVN & MERLIN image is displayed in colours, component appears as a twisted tail. In the EVN image features and are well resolved and look like misaligned lobes while component is totally resolved out.
– 0902+416: at the resolution of MERLIN the source is an asymmetric double, the southern component accounting for 80 % of the source total flux density. The EVN image confirms this basic morphology, displaying additional structure. The weak central component could host the source core, but we have no spectral information to confirm this.
– 1027+392: the MERLIN-only image (Fig. 4) confirms the structure described in Paper I, with some more detail, but it does not have enough resolution to understand the structure of this object any better. A possibility could be that we are seeing only one lobe of a double source extremely asymmetric in flux density like, for instance, 3C299 (van Breugel et al. vB (1992)) whose secondary component, 12 arcsec away, accounts at 1.7 GHz for only 5 % of the main component flux density. However no other feature is visible on the FIRST (Becker et al. beck (1995)) images within a few arcmin at a dynamic range level . No EVN information is available on this source (see Sect. 3).
– 1039+424: in Paper I the source structure was described as a core–jet. The EVN & MERLIN image, instead, rather resembles either a Narrow Angle Tail () radio source, with a tail arcsec long pointing to North, or, alternatively, one lobe (the southern one?) of a double radio source of which we do not detect the companion. A weak source of S1.5=5.9 mJy is present 15.5 arcsec North (Paper I) but no emission is visible between the two structures neither on FIRST (Becker et al. beck (1995)) nor in a low resolution MERLIN image (not shown). About 20 mJy (9 %) of the MERLIN flux density are missing in the combined image. The EVN observations allow to barely detect only the compact feature, accounting for 8 mJy, seen embedded in the extended lobe.
– 1128+455: the MERLIN image shows a very distorted triple source, as in Paper I, with component accounting for 60 % of the source total flux density. All components have a steep spectrum, thus excluding the possibility that any of them is the source core. At EVN resolution component is marginally detected, while a weak feature () shows up in between features and . We mark it in Fig. 3 as the possible core, although there is no spectral information to confirm this. A possibility is that we are in the presence of a small Wide Angle Tail () radio galaxy, as often seen in galaxy clusters, usually on larger scales, with the center of the host galaxy located at component .
– 1157+460: the MERLIN image displays a peculiar triple source, whose components form an angle of about 90∘, confirming the structure seen in Paper I. In the EVN image weak hot–spots are seen at the edges of components and , from where weak tails emerge pointing to component . One cannot exclude, however, that component be an unrelated source.
– 1212+380: the MERLIN image resolves the structure shown in Paper I into a double radio source, symmetric in flux density but not in shape, component being more elongated. At EVN resolution structural uncertainties are likely present due the low data quality of EVN (see Sect. 3).
– 1241+411: the MERLIN image shows a triple structure, with misoriented components. Component , barely detected in the EVN & MERLIN image, disappears completely in the EVN image. At EVN resolution a bright compact component, accounting for 95 % of the EVN total flux density, shows up at . Also this source could be a small Wide Angle Tail () radio galaxy, as often seen in galaxy clusters, usually on larger scales, with the center of the host galaxy located at component . The confusing source B3 1242+410 arcmin to South–East, of Jy at 1.4 GHz (FIRST, Becker et al. beck (1995)) had to be subtracted from the MERLIN visibility data.
– 2301+443: in the MERLIN image about 8 % ( 90mJy) of the total flux density is missing. Both components are mostly resolved in the EVN image which shows only some hints of extended structure along the source axis and two bright spots. They could represent the hot–spots of the source. In the EVN &MERLIN more extended structure is visible in the form of two misoriented lobes.
– 2349+410: in Paper I the source shows a quite strange triple structure, but in the MERLIN image the northern feature (accounting for 21 mJy at 1.66 GHz) is detached from the rest of the structure, suggesting an independent source. The two other components ( and ) are connected by a sort of bridge, where a weaker knot () is also visible. At EVN resolution only the most compact sub–structures are present. The central knot, accounting for 14 mJy, could host the source core, although we do not have any spectral information to affirm this. About 50 mJy (15 %) are missing in the combined image.
5 Discussion
The MERLIN observations, at a resolution roughly a factor of two better than that of the VLA at 8.4 GHz, basically confirm the known morphology. The EVN & MERLIN and EVN–only observations have produced images with high enough resolution to reveal many more details in the source morphology for the large majority of the sources.
At MERLIN resolution most sources (13 out of 18) show a double or triple, sometimes quite distorted, structure. The high resolution images also show that they are preferentially edge brightened. Furthermore we see, in a minority of objects, a compact component, centrally located, which could be the source core. However having only one, relatively low, frequency we restrain ourselves from making any firm statement about.
In spite of the lack of strong evidence of core detection, the overall morphology indicates that most sources are two–sided. We are convinced that we see lobes, often connected with bridges or, perhaps, jets. We classify these sources as MSOs (Table 1). We note that in this sample the lobes tend to be quite asymmetric in flux density. It has been already remarked that in CSOs and MSOs large lobe flux density asymmetries sometime do exist, but here the situation seems more extreme. For instance in six out of the 13 possible MSOs the flux density ratio of the two lobes is larger than three. It is very likely, however, that this is the result of the performed source selection from the B3-VLA CSS sample. In a number of the MSOs the lobes show low brightness wings or tails often distorted from the main source axis, not dissimilar from what found in large size powerful radio sources.
We find it difficult to unambiguously classify five sources (0110+401, 0748+413B, 0754+396, 1027+392 and 1039+424).
Further, in two cases ( and ) another source is found close in projection to the main one, likely unrelated to it. Four other sources (, , and ) could be alternatively classified as or . It is tempting to speculate on the presence of a galaxy cluster around these six radio sources.
We have computed the equipartition parameters for the source components, under the following assumptions: a) proton to electron energy ratio of one; b) filling factor of one; c) maximum and minimum electron (and proton) energies corresponding to synchrotron emission frequencies of 100 GHz and 10 MHz; d) ellipsoidal volumes with axis corresponding to the observed ones. We also computed the brightness temperatures () of each component.
In order to make easier the reading of the paper, we do not report the individual component values, since they can be obtained from the parameters in Table 2, but only mention the typical values.
At the resolution of MERLIN–only images, we find:
i) equipartition magnetic field mG, up to mG; ii) energy densities erg/cm3, up to erg/cm3; iii) K, up to K.
The most compact sub–components detected at the higher EVN resolution have, on average, equipartition magnetic fields higher by roughly a factor of two and energy densities and brightness temperatures higher by about a factor of four.
6 Conclusions
We have presented the results of EVN and MERLIN observations of a
sub–sample of 18 radio sources from the
B3–VLBA CSS sample of Paper I,
which were just marginally resolved with the VLA.
The majority of the sources are classified as MSOs, a number of which very asymmetric in component flux density. At difference of what found in Paper II, no very bright compact component has been detected. This may be due to the lower resolving power of the intra–European EVN configuration used in the present work compared to that of VLBA, but could also be intrinsic, since the radio sources presented in this paper are a few times more extended than those presented in Paper II.
Equipartition parameters are consistent with other findings (e.g. Paper II) when allowance is made for the larger component sizes. In particular we note that brightness temperatures hardly reach K, some hundred times lower than those of the sources of Paper II. Together with the VLA data on the large size sources and with the VLBA data presented in Paper II on the smallest sources, we have a new determination of the Linear Size distribution in the range (kpc) 20 .
This will be discussed it in a separate paper.
Acknowledgements.
MERLIN is the Multi–Element Radio Linked Interferometer Network and is a national facility operated by the University of Manchester on behalf of PPARC. The European VLBI Network is a joint facility of European and Chinese Radio Astronomy Institutes funded by their National Research Councils. This work has been partially supported by the Italian MURST under grant COFIN-2001-02-8773.References
- (1) Becker, R. H., White, R., & Helfand, D. J. 1995,ApJ, 450,559
- (2) Fanti, C., Fanti,R., Dallacasa, D., et al. 1995, A.A., 302, 317
- (3) Dallacasa, D., Tinti, S., Fanti, C., et al. 2002, A.A (this issue) (Paper II)
- (4) Fanti, C., Pozzi, F., Dallacasa, D., et al. 2001, A.A., 369, 380 (Paper I)
- (5) O’Dea, C. P., 1998, PASP, 110, 493
- (6) Readhead. A. C. S., Taylor, G. B., Xu, W., et al., 1996, ApJ., 460, 634
- (7) van Breugel, W. J. M., Fanti, C., Fanti, R., et al. 1992, A.A, 256, 56
- (8) Vigotti, M., Grueff, G., Perley, H., et al. 1989, AJ, 98, 419
- (9) Vigotti, M., Gregorini, L., Klein, U.,& Mack, K. H., A.AS, 1999, 139, 359