The Radio Properties of Composite LINER/H ii Galaxies
Abstract
Arcsec-resolution VLA observations – newly obtained as well as published – of 40 nearby galaxies are discussed, completing a study of the radio properties of a magnitude-limited sample of nearby galaxies of the composite LINER/H ii type. Our results reveal an overall detection rate of at least 25% AGN candidates among these composite sources. The general properties of these AGN candidates, as compared to non-AGN composite sources and H ii galaxies, are discussed.
1 Introduction
As demonstrated by the extensive studies of Ho, Filippenko, & Sargent (1995, 1997a, 1997b), 13% – a substantial fraction – of all nearby galaxies is of the “transition-LINER” type; they display emission-line ratios intermediate between LINER galaxies (Heckman 1980) and H ii nuclei. These objects are most likely truly composite in nature, combining weak accretion-driven nuclear emission with circumnuclear star-formation (Ho, Filippenko, & Sargent 1993; see also Ho 1996). This picture is supported by radio imaging surveys indicating that many LINERs and composite LINER/H ii galaxies exhibit weak compact nuclear radio emission, in addition to more diffuse extended emission (e.g., Filho, Barthel, & Ho 2000, hereafter Paper I; Falcke et al. 2000; Nagar et al. 2000, 2002). Whereas the latter is most likely of stellar and interstellar origin, the former is connected to nuclear accretion processes and as such is qualitatively comparable to classical quasar emission. While dynamical evidence for black holes is now being found in many nearby galaxies (e.g., Richstone et al. 1998), the presence of a high brightness temperature radio core or hard X-ray emission is the clearest evidence that the black hole is actually accreting mass at the current epoch. In turn, knowing the demographics of accreting black holes, one can attempt to ascertain the factors that determine the incidence and properties of the accretion process.
In Paper I, we described our Very Large Array (VLA) C-array observations of a first set of 25 composite LINER/H ii galaxies from the Palomar sample (Ho et al. 1995). The radio morphology combined with the radio flux and spectral index data was used to isolate AGN candidates in the composite source sample. It was found that roughly 20% of the sample objects most likely contain weak AGN. In a similar fashion as Falcke et al. (2000) and Nagar et al. (2000, 2002), subsequent milliarcsec resolution observations have shown that indeed these objects harbour compact, high brightness temperature, flat or inverted spectrum radio cores (Filho, Nagar, & Barthel 2002), confirming the AGN scenario. In this Paper II we apply the arcsec resolution radio imaging technique to the remaining 40 composite sources, thereby completing the analysis of composite objects in the full Palomar bright galaxy sample.
In the following discussion, we adopt a Hubble constant = 75 km s-1 Mpc-1 and define the radio spectral index, , such that .
2 Sample Selection
All of the composite LINER/H ii galaxies presented in Paper I and in the present paper were taken from the original magnitude-limited Palomar survey of 486 bright northern galaxies (Ho et al. 1995), following the classification criteria outlined in Ho et al. (1997a). The Palomar sample contains 65 such composite sources (Ho et al. 1997a), 25 of which were observed in 1997 and had their results published in Paper I. In this Paper II, we discuss VLA archival data for one source, published data for 28 more objects, and new VLA observations for the remaining 11. Properties of these 40 composite LINER/H ii sample galaxies are given in Table 1.
– TABLE 1: Sample Sources –
3 Observations and Data Reduction
The selection of the composite sources to be observed with the VLA was based on the absence of published, sensitive 5 resolution observations and the absence of appropriate archival data. Of these, we choose the 11 sources that fell within the observational time slot allocated to us by the VLA. As will be dicussed below, however, the new observations plus the existing data do permit a more or less homogeneous assessment of the arcsec-scale radio properties of the full sample of 65 composite sources.
Similar to the objects in Paper I, the 11 galaxies were observed with the X-band (8.4 GHz) system of the VLA, on 2000 March 26. The array was in its C-configuration, yielding a typical resolution of 2 .5. Two bands of 50 MHz each were combined, yielding a total bandwidth of 100 MHz. Two snapshot observations of 6–7 minutes each, at different hour angles, were interspersed with the observations of appropriate phase calibrators. Phase calibrators were choosen from the online VLA calibrator manual to have positional accuracies of the order of 1 mas. The occurence of a power glitch during the last hour of our observing run has resulted in the loss of half of the data for IC 356, IC 1727 and NGC 1055.
The flux densities were bootstrapped by observing the primary calibrator 3C 48 (0137+331). The adopted 8.4 GHz flux densities, after applying the appropriate baseline contraints as specified in the online VLA calibrator manual, were 3.23 Jy and 3.22 Jy, at IF1 and IF2, respectively. The calibration uncertainty is dominated by the uncertainty in the absolute flux density of the primary calibrator, which is conservatively estimated to be 5%.
Reduction of the data was performed using standard NRAO AIPS (version 15OCT99) image processing routines. After minor flagging of the data and calibration, the visibilities were Fourier transformed using the AIPS task IMAGR. “Clean boxes” were interactively set in order to remove the sidelobes from the “dirty maps,” following the deconvolution CLEAN algorithm (Clark 1980). The “cleaning” task was halted when the clean flux density reached the noise level as measured in the dirty maps. Full-resolution images, having synthesized beams of roughly 2 .5, as well as tapered maps, having beams of about 5 –7 were made. This proved useful in cases where weak low surface brightness emission was present. For comparison, 1 corresponds to 30–300 pc for the large range of distances (D=7–70 Mpc) involved. To within a factor of two, most images reach the theoretical noise level of 0.04 mJy/beam (Perley, Schwab, & Bridle 1989). Self-calibration was not performed given the weakness of the radio sources.
1995 VLA A-array, 8.4 GHz archive observations of NGC 660 were re-reduced using AIPS as specified above, from the calibrated data files kindly provided by Dr. Jim Ulvestad. Tapered as well as a full resolution image was made.
For the remaining 28 composite sources, we have gathered relevant published radio data, at cm-wavelengths and resolutions between 0.2 and 5 arcsec. These are summarized in Table 5.
4 Results
4.1 Radio images
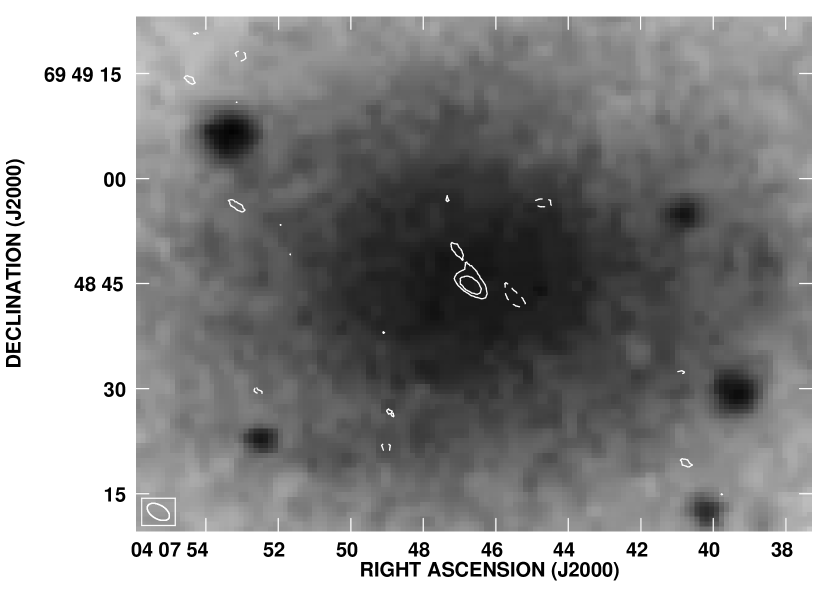
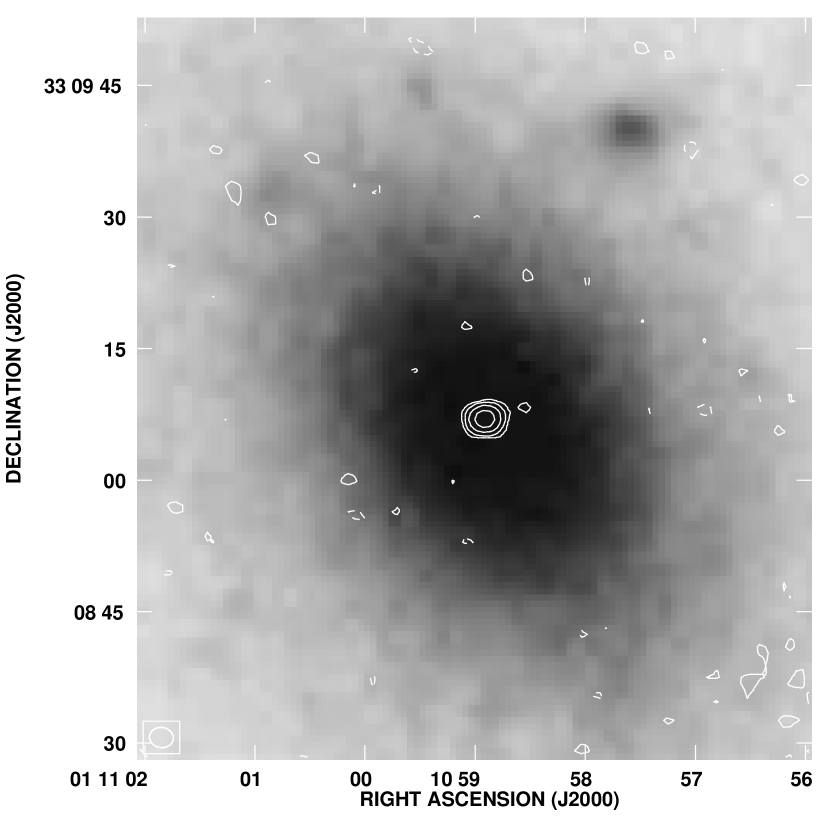
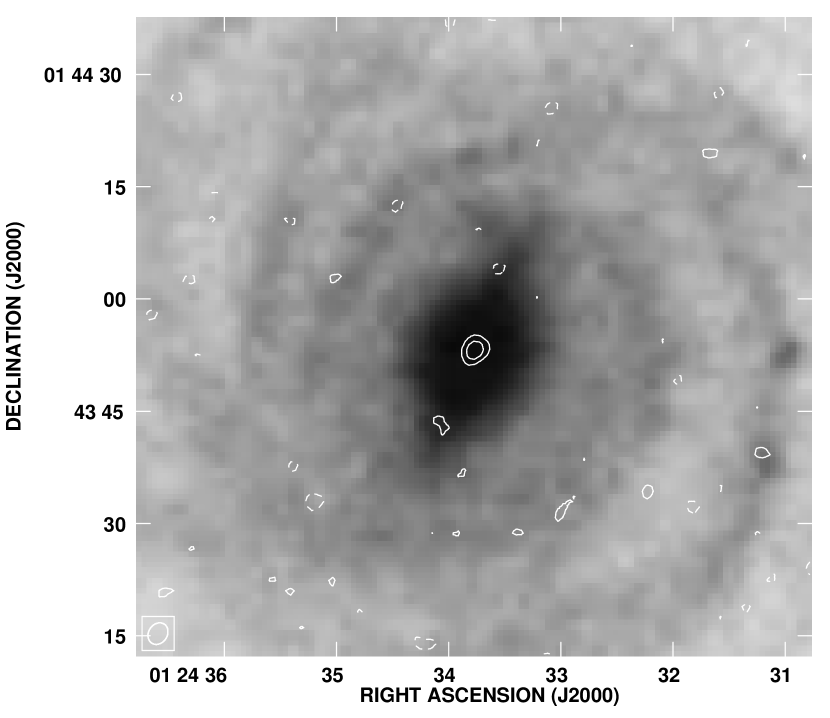
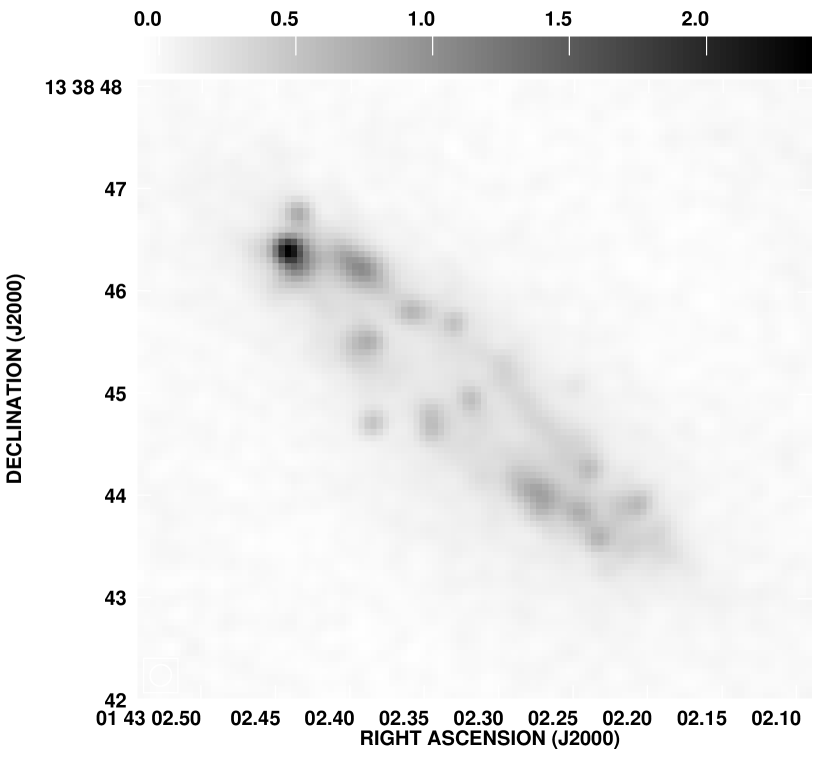
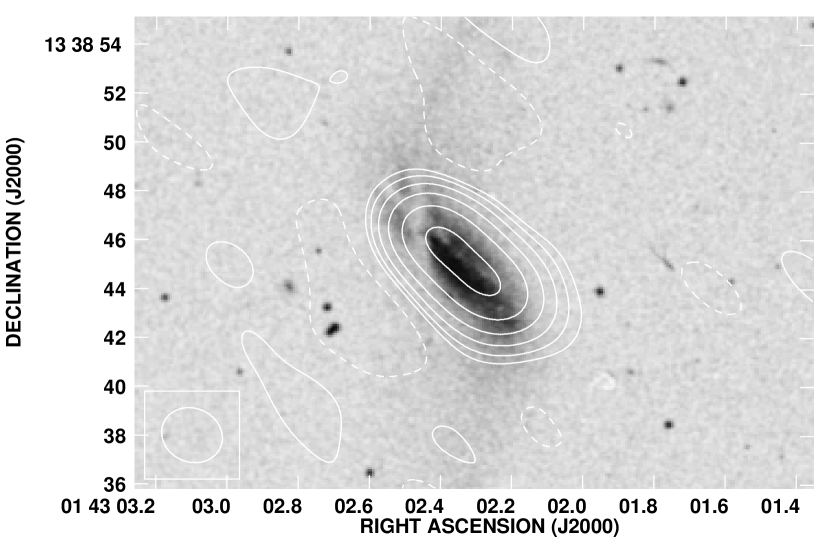
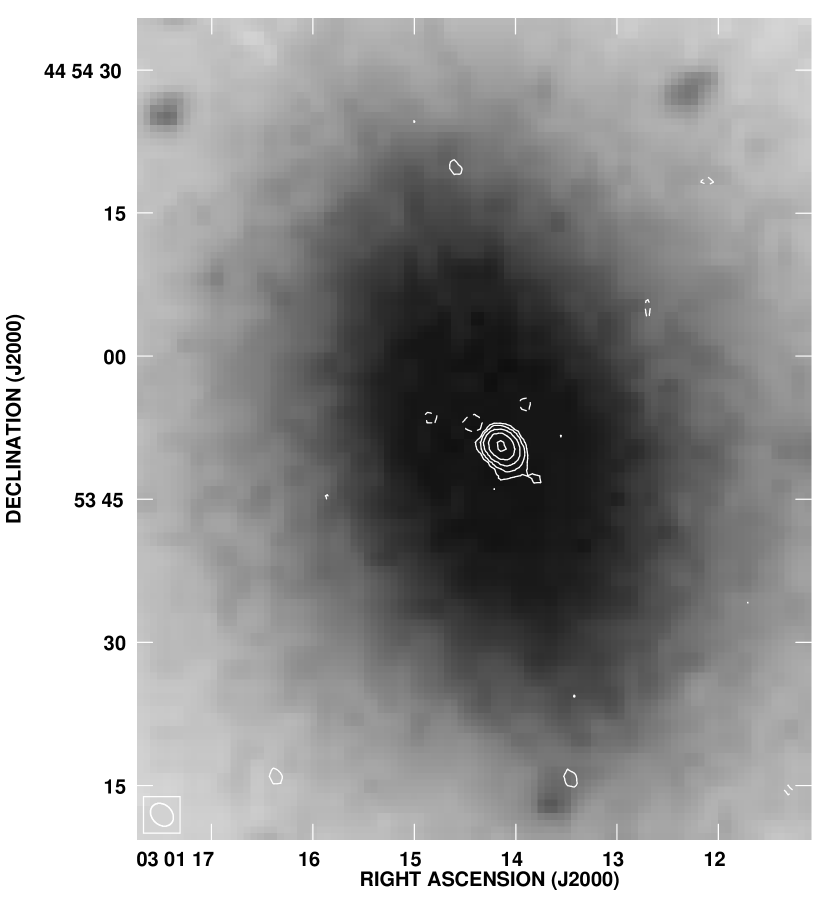
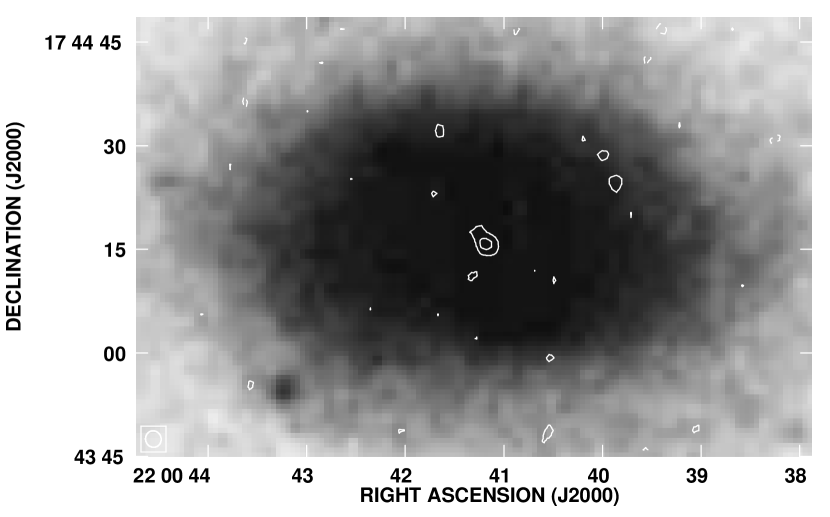
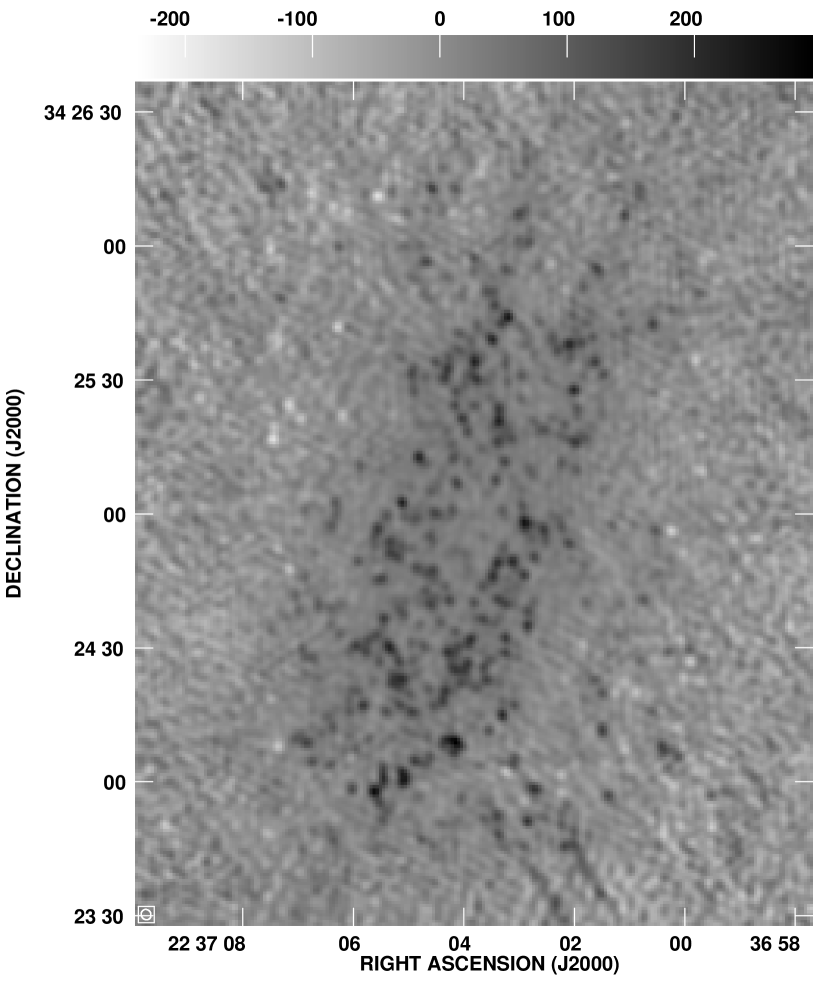
Overall, 10 of the 11 newly observed composite sources were detected. Only IC 1727 remains undetected and we establish a conservative upper limit of 0.5 mJy (5) to any radio emission (see also Section 4.2). Table 2 provides the map parameters of the detected sources, including NGC 660. The map rms has been estimated using AIPS task IMSTAT, in a source-free region. Images of the sources appear in Figures 1 – 3, in the Appendix. We present the radio contour maps (typical beamsize 2 .5) overlayed on optical images taken from the Digitized Sky Survey (DSS), with contouring according to CLEV (3,3,6,12,24,48,96) mJy/beam (CLEV is the map noise level; see Table 2). For the full resolution image of NGC 660 (0 .21 resolution) and for NGC 1055 and NGC 7331, having substantially more complex radio morphologies than the other sources, we present radio grey scale images, with the scale levels given above each image.
– TABLE 2: Radio map parameters –
Given that good phase stability was obtained as judged from the VLA phase calibrators, the astrometric accuracy of the overlay procedure must be dominated by the DSS accuracy, which is known to be about 0.6 (Véron-Cetty & Véron 1996). This is born out by the images of several unresolved and slightly resolved nuclei (NGC 410, NGC 521, NGC 524) which appear accurate to within a few tenths of an arcsec.
We have also detected unrelated background radio sources in several fields: their number is entirely consistent with the statistical probability of finding such sources in a field of a given primary beamsize and sensitivity. Due to their large distances from the field center, primary beam corrections were applied to infer their flux densities. NED (NASA/IPAC Extragalactic Database) and the Cambridge APM (Automatic Plate Measuring) facility have proven useful in identifying some of the background sources. In Table 3 we list basic properties of these sources, where we have designated them by their sky orientation with respect to the field center, for the relevant galaxy. These are discussed below.
– TABLE 3: Field source parameters –
4.2 Comments on Individual Galaxies
In this section we present short discussions on the sample galaxies, starting with the newly observed galaxies (plus background sources). We generally take into consideration data from the VLA 1.4 GHz NVSS and FIRST surveys (45 and 5 resolution, respectively; Condon et al. 1998a; Becker, White, & Helfand 1995), Green Bank 4.85 GHz survey (3 .5 resolution; Becker, White, & Edwards 1991) as well as other available radio data.
IC 356: NVSS did not detect this source. The 1.4 GHz, 54 resolution observations of Condon (1987) did detect a diffuse 29.5 mJy source. We detect a slightly resolved, 1 mJy core, coincident with the optical nucleus of the galaxy.
There is also another object (IC356NE), having about 6 mJy, at about 3 .5 from the target source. We have not been able to identify this source using NED, which indicates that the two nearest objects are 87GB 040255.7+694248 and IRAS 04033+6942, about 1 .3 away. It may possibly be identified with the 80.1 mJy NVSS source at a distance of 5 from our radio position for IC356NE. There are no APM catalogue data for this field.
IC 1727: There is no NVSS detection of this source. 1.4 GHz, 54 resolution observations (Condon 1987) show an uncertain 1.3 mJy detection. Although our full resolution map of this source suggests the presence of very weak low surface brightness emission, tapering showed just noise. The non-detection could also be related to the loss of part of the data, and thereby loss of sensitivity. We establish an upper limit of 0.5 mJy (5) to any radio emission at the resolution achieved in our C-array observations.
We do, however, detect a weak (3.5 mJy) Southwestern source, about 3 .5 from our target center. Consultation of NED shows that the closest object is the NVSS source J014701+272105, 5 away. The APM data show two red objects (=19.25 and 19.28, respectively) at a distance of about 5 on either side of this position – their nature with respect to the radio source remains unclear.
NGC 410: NVSS detected a 6.3 mJy source. We have detected a 1.7 mJy unresolved core, coincident with the optical nucleus of the galaxy.
NGC 488: NVSS did not detect this source. However, 54 resolution observations at 1.4 GHz (Condon 1987) show a diffuse 7.6 mJy source – the radio emission must have low surface brightness. Both our full resolution and tapered map show only a very weak, 0.3 mJy unresolved core, at the optical center of the galaxy.
NGC 521: This source was not detected in the NVSS. 1.4 GHz, 0 .2 resolution observations of Hummel et al. (1985) give an upper limit of 4 mJy to any radio emission. We have detected a slightly resolved 0.5 mJy core in the optical nucleus of the galaxy.
The NGC 521 field also shows two other sources to the Southeast (3 ) and Northeast (3 ) which we have designated as NGC 521SE and NGC 521NE, respectively. NGC 521SE has been identified with the 17.6 mJy NVSS source J012437+014112. It is also seen on both the red and blue APM plates as a stellar object with blue magnitude 21.74. NGC 521NE has been identified with the 5.7 mJy NVSS source J012443+014535. However, there is no optical identification on either the red or blue APM plate.
NGC 524: NVSS reports a 3.5 mJy source. At 5 GHz, 5 resolution, Wrobel & Heeschen (1991), detect a 1.4 mJy core. Our higher resolution observations show a slightly resolved 2 mJy core in the center of the optical galaxy. Comparison of our measurements with the NVSS and Wrobel & Heeschen (1991) flux densities indicates the source to be compact and have a flattish spectrum.
We have also detected a 0.7 mJy source to the Southwest (NGC 524SW), about 2 from the galaxy. As given by NED, the closest object to NGC 524SW is the supernova SN 2000cx, 1.4 away. The nearest NVSS source is at a distance of 1 .8. There is no optical identification on either the red or blue APM plate, although there is a noise-like object on the red plate with magnitude 19.85, less than 4 away.
NGC 660: NVSS detected a 373 mJy source, consistent with the 54 resolution observations of Condon (1987) at the same frequency. 184 mJy were detected in the Green Bank survey. 5 , 1 .5, and 0 .5 resolution maps at 1.4 and 4.85 GHz (Condon 1980; Condon et al. 1982; Condon 1987; Condon et al. 1990) show a double structure in the Northeast-Southwest direction. High resolution, 15 GHz observations (Carral, Turner, & Ho 1990) show an edge-on ring or linear jet structure composed of several aligned components at a position angle of 71∘. The optical nucleus is located about 3 South of the strongest 15 GHz peak.
The overall radio morphology of NGC 660 measures about 6 and appears co-spatial with the small optical galaxy. From the tapered (2 .5 resolution) image, we compute the total flux density to be about 60 mJy. The full resolution 8.4 GHz map shows a beautiful symmetric ring of radio emission and what looks to be a radio source in its center. We shall designate this radio component as the ‘core’ and we estimate it comprises less than 3 mJy. Although individual points of emission can be identified, we call attention to two strong Northeastern components, about 2–2 .5 from the core; these have also been observed by Carral et al. (1990). For consistency with the Carral et al. (1990) maps we have designated them components C1 and C2. Comparison of our and the Carral et al. (1990) measurements of these components shows that they are steep spectrum and/or variable, hence possible supernova remnants.
NGC 1055: NVSS reports a 201 mJy source, and 85 mJy were detected in the Green Bank survey. 1.4 GHz, 54 resolution observations (Condon 1987) show a 302 mJy source oriented in the East-West direction. FIRST shows an 7 mJy peak cradled by a disk of radio emission, totalling 19.3 mJy. Higher resolution observations at the same frequency (Downes et al. 1986) show that most of the radio emission arises from the galactic disk.
Similar to the FIRST image, our observations show edge-on ringlike radio emission over about 2 , co-spatial with the galactic disk in addition to a relatively strong 7 mJy core, apparently originating from the optical nucleus of the galaxy. The total flux density, as judged from tapered maps (7 resolution) is about 40 mJy. Comparison of our observations with the FIRST images shows the core to be compact and have a flat spectrum.
NGC 1161: NVSS detected a 4.9 mJy source. We detect a slightly resolved, 4 mJy core, coincident with the optical nucleus of the galaxy. Comparing this with the NVSS value shows the source to be of a compact and flat spectrum nature.
We also detect a source (NGC 1161S), about 2 due South of the target galaxy. While neither NED nor APM contain this object, there is a 3.9 mJy NVSS source coincident with NGC 1161S.
NGC 7177: NVSS reports a 28 mJy source consistent with the 1.4 GHz, 54 resolution observations of Condon (1987). Hummel et al. (1987) establish an upper limit of 0.8 mJy to any emission at 1.4 GHz, 1 .3 resolution. We detect a somewhat resolved 0.8 mJy core, in the center of the optical galaxy; comparison with the integrated NVSS flux density otherwise indicates strong resolution effects.
NGC 7331: NVSS data imply strong resolution effects for the 2 North-South extended radio emission associated with NGC 7331. The Green Bank survey measured an 80 mJy source. 1.49 GHz, 54 resolution map of Condon (1987), shows a North-South, 373 mJy source. 1 .5 resolution, 1.4 and 5 GHz maps were obtained by Cowan, Romanishin, & Branch (1994). The maps show a central unresolved flat spectrum radio source of 0.23 and 0.12 mJy, respectively and a ring of radio emission around the central source, containing mainly nonthermal sources which may be supernova remnants.
Similar to the high resolution image of NGC 660, we detect a ring of radio emission, co-spatial with the galaxy major axis. Due to the complexity of the source and the reduced sensitivity relative to the observations of Cowan et al. (1994), we were not able to detect the radio core. As judged from tapered maps (7 resolution), the total 8.4 GHz flux density is approximately 50 mJy.
We also detect a strong source (NGC 7331SW), 4 away from the target center, to the Southwest. Since this source is almost at the primary beam edge, our estimate of 20 mJy should be taken as a lower limit. NED shows that the closest source, 6 away, is the 423 mJy radio source TXS 2234+340 (Douglas et al. 1996). There is no NVSS detection, and APM data for this field are as yet lacking.
NGC 7742: NVSS detected a 27 mJy source. However, 0 .2 resolution observations of Nagar et al. (2000) establish an upper limit of 1.1 mJy to any small scale emission at 15 GHz. We detect approximately 20 mJy of low surface brightness emission, extending over most of the galaxy disk.
We also detect a source to the Southwest (NGC7742SW), about 1 .5 away from the target. The nearest source as given by NED is supernova SN 1993R, 1 .7 away and the closest NVSS source is a 4.5 mJy object, about 2 away. Both the red and blue APM plates show there is a nonstellar source ( = 20.82 mag), about 7 from the target position.
The following 28 sample objects were not observed by us – we briefly discuss their literature data as relevant to, and in the context of, our observations.
NGC 2859: This source was not detected in the NVSS. Reported upper limits for any radio emission at moderate resolution are 10 and 0.5 mJy at 1.4 GHz and 5 GHz, respectively (Hummel & Kotanyi 1982; Fabbiano et al. 1987; Wrobel & Heeschen 1991).
NGC 3245: NVSS reports a 7.2 mJy source, similar to the 6 mJy detected within FIRST. Wrobel & Heeschen (1991) find an unresolved 3.3 mJy core at 5 GHz, 5 resolution. Judging from these data, the source could be flat spectrum and compact.
NGC 3489: NVSS did not detect this source. Other 1.4 GHz observations at moderate resolution quote an upper limit of 10 mJy (Hummel & Kotanyi 1982; Fabbiano et al. 1987) to any radio emission. 5 resolution, 5 GHz observations of Wrobel & Heeschen (1991) give an upper limit of 0.5 mJy.
NGC 3692: NVSS detected a 8.4 mJy source. The 15 GHz, 4 and 0 .2 resolution observations of Nagar et al. (2000) yield an upper limit of 1.2 mJy to any radio emission – its nature must be diffuse and of low surface brightness.
NGC 3705: There is no NVSS detection of this source. Condon (1987), 1.4 GHz observations at 54 resolution show a 21 mJy Northwest-Southeast elongated source. At the same resolution, 10.7 GHz observations measure a 10 mJy source (Niklas et al. 1995). The 15 GHz, 4 and 0 .2 resolution observations of Nagar et al. (2000) give an upper limit of 1.2 mJy to any compact scale radio emission.
NGC 3898: NVSS reports a 8.7 mJy source and FIRST a 2.4 mJy source. The 1.4 GHz, 54 resolution observations of Condon (1987) detect an uncertain 6.3 mJy source, spatially confused by a strong, nearby, unrelated core. The same radio structure is seen in the Gioia et al. (1987) map.
NGC 3917: NVSS and FIRST did not detect this source. Condon, Yin, & Burnstein (1987) show an uncertain 2.1 mJy detection at 1.4 GHz, 54 resolution. The 15 GHz, 4 and 0 .2 resolution observations of Nagar et al. (2000) give an upper limit of 1.2 mJy to any small-scale radio emission.
NGC 3953: This source was not detected in the NVSS. Condon (1987) shows a 45 mJy North-South source at 1.4 GHz, 54 resolution. Single-dish observations at 5 and 11 GHz (Garcia-Barreto et al. 1993) show that this source is steep-spectrum. Hummel (1980) establish an upper limit of 10 mJy to any core emission at 1.4 GHz, while the 15 GHz, 4 and 0 .2 resolution observations of Nagar et al. (2000) give an upper limit of 1.3 mJy to any radio emission.
NGC 3992: NVSS did not detect this source. 54 resolution, 1.4 GHz observations (Condon 1987) show a 21.3 mJy diffuse source. High resolution observations at various frequencies (Heckman 1980; Hummel et al. 1985; Garcia-Barreto et al. 1993) show this object to harbour a flat-spectrum, 2 mJy core. However, for unclear reasons, the 4 and 0 .2 resolution 15 GHz observations of Nagar et al. (2000) give only upper limit of 1.3 mJy to any radio emission.
NGC 4125: There is no NVSS detection of this source. 1.4 GHz, 18 resolution observations (Condon et al. 1998b) detect an uncertain 1.8 mJy source. Moderate-resolution observations at 1.4 and 5 GHz (Heckman 1980; Hummel 1980; Hummel et al. 1983) give an upper limit of 10 mJy to any core emission, while the high-resolution, 5 GHz observations of Wrobel & Heeschen (1991) establish a 0.5 mJy upper limit.
NGC 4145: NVSS did not detect this source. 1.4 GHz, 54 resolution observations (Condon 1987) detect an uncertain 2.8 mJy source, while the 15 GHz, 4 and 0 .2 resolution observations of Nagar et al. (2000) give an upper limit of 1.3 mJy to any small-scale radio emission.
NGC 4150: This source was not detected in the NVSS. 1.4 GHz 15 resolution observations (Condon et al. 1998b) show a weak 0.8 mJy source. The high-resolution, 5 GHz observations of Wrobel & Heeschen (1991) establish a 0.5 mJy upper limit to any radio emission.
NGC 4192: NVSS reports a 24 mJy source, while 33 mJy were detected in the Green Bank survey. 1.4 GHz, 54 resolution observations (Condon 1987) show a 74 mJy North-South oriented source. FIRST detected a 16.8 mJy source, slightly extended to the Southeast, while 15 GHz, 4 resolution observations of Nagar et al. (2000) detect 1.3 mJy – the source must be dominated by low surface brightness emission. The same authors give an upper limit of 1.3 mJy to any small-scale radio emission at 15 GHz (0 .2 resolution).
NGC 4216: NVSS detected a 7 mJy source. 1.4 GHz, 54 resolution observations (Condon 1987) detect a 13.4 mJy North-South source. However, this source was not detected at 10.7 GHz, at the same resolution (Niklas et al. 1995). 15 GHz, 4 resolution observations of Nagar et al. (2000) detect 2.0 mJy. The same authors give an upper limit of 2.0 mJy to any small-scale radio emission at 15 GHz (0 .2 resolution.)
NGC 4220: NVSS reports a 4 mJy source. Wrobel & Heeschen (1991) establish an upper limit of 0.5 mJy to any emission at 5 GHz, 5 resolution, while the 4 and 0 .2 resolution observations of Nagar et al. (2000) give an upper limit of 1.4 mJy to any radio emission at 15 GHz.
NGC 4281: NVSS did not detect this source. There is an upper limit of 0.5 mJy to any emission at 5 GHz, 5 resolution (Wrobel & Heeschen 1991).
NGC 4324: There is no NVSS detection of this source. Wrobel & Heeschen (1991) establish an upper limit of 0.5 mJy to any emission at 5 GHz, 5 resolution.
NGC 4350: NVSS did not detect this source. At 5 GHz, 5 resolution, there is an upper limit of 0.5 mJy to any emission (Wrobel & Heeschen 1991).
NGC 4419: NVSS reports a 55.4 mJy source and 1.4 GHz observations at 15 resolution (Condon et al. 1990) show a 50 mJy source. FIRST reports a 39.5 mJy detection. 15 GHz, 4 resolution observations of Nagar et al. (2000) show a slightly resolved source with a total flux density of 7.4 mJy. Moderate resolution observations at various frequencies reveal a compact, flat-spectrum core (Hummel et al. 1987; Condon et al. 1990, Condon, Frayer, & Broderick 1991a), although the 0 .2 resolution observations of Nagar et al. (2000) give an upper limit of 2.8 mJy to any small-scale radio emission at 15 GHz.
NGC 4429: This source was not detected in the NVSS. Wrobel & Heeschen (1991) establish an upper limit of 0.5 mJy at 5 GHz, 5 resolution, while the Nagar et al. (2000), 0 .2 resolution observations give an upper limit of 1.1 mJy for any small-scale radio emission at 15 GHz.
NGC 4435: NVSS did not detect this source, while FIRST shows a 2.2 mJy detection. 5 GHz, 5 resolution observations (Wrobel & Heeschen 1991) detect a weak 1.2 mJy source. However, the 15 GHz, 0 .2 resolution observations of Nagar et al. (2000) give an upper limit of 1.1 mJy to any small-scale radio emission.
NGC 4459: There is no NVSS detection of this source. FIRST detected a 1.8 mJy source, which together with the Wrobel & Heeschen (1991) 0.8 mJy detection at 5 GHz, 5 resolution, shows the compact and flattish spectrum nature of the source.
NGC 4527: NVSS detected a 178 mJy source, 151 mJy were detected in the Green Bank survey and FIRST reports a 74 mJy source – the radio source displays resolution effects. 1.4 GHz, 54 resolution observations (Condon 1987) detect a 214 mJy source. While 0 .2 resolution, 15 GHz observations of Nagar et al. (2000) give an upper limit of 1.1 mJy to any small-scale emission, the high-resolution observations of Vila et al. (1990) show a small ( 2 ) core (1.1 and 4.2 mJy at 5 and 1.4 GHz, respectively) and East-West extended emission (73 and 24 mJy at 5 and 1.4 GHz, respectively). The annulus-like extended emission, roughly aligned with the galaxy major axis, is suggestive of star-formation in the disk.
NGC 4569: NVSS reports a 73 mJy source, while FIRST detected a 14.3 mJy source. 1.4 GHz, 48 resolution observations (Condon 1987; Condon et al. 1990, 1998b) detect a 83 mJy source. High resolution 2.4 GHz observations show an uncertain 3 mJy core detection (Turner, Helou, & Terzian 1988), while the 0 .2 resolution observations of Nagar et al. (2000) give an upper limit of 1.1 mJy to any radio emission at 15 GHz.
NGC 5055: NVSS detected a 265 mJy, the Green Bank survey a 124 mJy, and FIRST a 20.2 mJy source. 1.4 GHz, 54 resolution observations (Condon 1987) detect an uncertain 22 mJy source. Moderate to high-resolution observations at various frequencies either fail to detect or detect uncertain, weak emission from this object, denoting that it is mainly low surface brightness, arcsecond-scale emission (Condon & Broderick 1988; Condon et al. 1991a). The 0 .2 resolution observations of Nagar et al. (2000) give an upper limit of 1.1 mJy to any small-scale radio emission at 15 GHz.
NGC 5701: This source was not detected by the NVSS. 1.4 GHz, 54 resolution observations (Condon 1987) also did not detect this source. Hummel et al. (1987) establish an upper limit of 0.6 mJy to any emission at 1.4 GHz, 1 .3 resolution. The 0 .2 resolution observations of Nagar et al. (2000) give an upper limit of 1.1 mJy to any small-scale radio emission at 15 GHz.
NGC 5746: NVSS reports a 19 mJy and FIRST a 1.2 mJy source. 1.4 GHz, 54 resolution observations (Condon 1987) measure an uncertain 11 mJy (due to confusion from a strong, unrelated Northern source). The high-resolution observations at 1.4 GHz of Hummel et al. (1987) establish an upper limit of 0.8 mJy to the radio core emission.
NGC 5866: NVSS detected a 23 mJy source, while FIRST detected a 16.9 mJy source. 15 and 5 resolution observations at 1.4 GHz (Condon et al. 1990) detect 21 and 12 mJy sources, respectively. Multi-frequency observations of this source suggests it harbours a compact, flat-spectrum radio core (Hummel 1980; Fabbiano et al. 1987; Wrobel & Heeschen 1991). The Nagar et al. (2000) 15 GHz, 0 .2 resolution observations detect a 7.5 mJy compact source, while VLBA 5 GHz observations of Falcke et al. (2000) show a pointlike 8.4 mJy source.
4.3 Radio Source Parameters
We have used AIPS task IMFIT in order to fit single bi-dimensional Gaussians to the arcsec-scale brightness peaks in our sources. Results of this procedure are listed in Table 4. We have, in addition, tabulated the Gaussian fits to the two strongest, most Northeastern components (NGC 660C1 and NGC 660C2) associated with NGC 660. Given the good phase stability, we estimate that the radio peak positions are accurate to within 1 . The integrated flux densities of very extended sources – shown in parentheses – have been estimated from the low-resolution images (5 –7 resolution) in combination with the list of CLEAN components.
– TABLE 4: Radio parameters of detected sources –
5 Discussion and Statistical Results
Table 5 summarizes the intrinsic properties of all 65 composite LINER/H ii galaxies in the Palomar sample. We have added to Table 5 12 H ii galaxies of the same sample (see Paper I), for use as a control group for the statistical properties of the composite galaxies. The H and [O i] 6300 line luminosities have been measured in a 2 4 aperture (Ho et al. 1997a), comparable to the resolution of the present radio data (2.5–5 ). The H and [O i] entries have been corrected for Galactic and internal extinction (see Ho et al. 1997a) and only photometric values have been considered.
– TABLE 5: summary –
Since our aim is to study radio core emission in a homogeneous, systematic way, we have used only high-resolution radio observations ( 5 ). This is generally accomplished at 8.4 GHz (our observations) and 5 GHz (literature). We also attempt to determine radio spectral indices for the compact core components, using radio data at comparable resolution. When multiple observations are available, radio data are chosen by order of preference as follows: Paper I or this paper, Nagar et al. (2000), Wrobel & Heeschen (1991) and FIRST. Moreover, in many sources ‘extended’ emission is present which is most likely associated with the host galaxy and therefore may contaminate radio core flux densities and morphologies. In summary however, combination of the new observations and the literature data permits a census of the occurrence of the 100 parsec-scale radio cores and associated small-scale structure in the composite source class of the Palomar bright galaxy sample. We proceed by investigating interesting trends.
In the absence of adequate empirical constraints, we have assumed the simplest possible case, that is that most of the radio emission is optically thin synchrotron radiation and adopt a spectral index of 0.7 in order to extrapolate the radio power entries to 5 GHz (Table 5; column 5). Integrated flux densities for NGC 660, 1055, 3627, and 7331, appearing in parenthesis in Table 5 (column 5), have also been extrapolated to 5 GHz assuming a spectral index of 0.7. We note that an error of 0.2 in the adopted radio spectral index would lead to an error of 0.1 in the logarithm of the extrapolated 5 GHz radio power. Undetected sources in our observations have all been given a conservative upper limit of 0.5 mJy, corresponding roughly to 5.
We have adopted the radio morphological classification of Ulvestad & Wilson (1984), applying this classification to the arcsec resolution images: the classification refers to radio structure on the 100 parsec scale. A source is considered resolved if the deconvolved source size is larger than half the beamwidth in at least one component. and refer respectively to single unresolved and slightly resolved cores, is for diffuse radio emission, for linear or multicomponent structure, and pertains to ambiguous sources.
Of the 65 composite sources in the Palomar sample there are 37 (57%) arcsec resolution radio detections, implying mJy level structure on the 100 parsec scale. Of these 37, 29 are from our VLA observations while 8 are from published observations. Of the 37 detections, there are 10 unresolved cores, 14 slightly resolved cores, 3 cores with associated radio halos, 5 diffuse sources and 5 sources with ambiguous radio morphology. Nine of the twelve H ii nuclei were detected, seven of which show diffuse source morphology and two of which are ambiguous – hence no compact cores in this class.
As in Paper I we have divided the composite sources into two categories, based on their radio morphology and strength. The first category are non-AGN composite sources in which the weak and/or extended, low surface brightness radio emission is most likely stellar in nature. We have also included in this category slightly resolved core-like sources with peak flux densities 1 mJy (7). The second category of objects are AGN-like, in that they display clear compact radio cores with flux densities above 1 mJy. These AGN candidates include NGC 3627, 4552, 5354, 5838, 5846 (Paper I) and NGC 410, 524, 1055, 1161, 3245, 4216, 4419, 4527, 5866 (this paper). We have added to this category the sources NGC 660 and NGC 7331, for which much higher sensitivity and higher resolution observations are available. We stress that both sources would be excluded from this classification on the basis of arcsec-scale observations (see Fig. 2d and 3c). This illustrates the fact that the actual fraction of AGN may be higher than we derive using the arcsec resolution data – an issue we will come back to in Sect. 5.4.
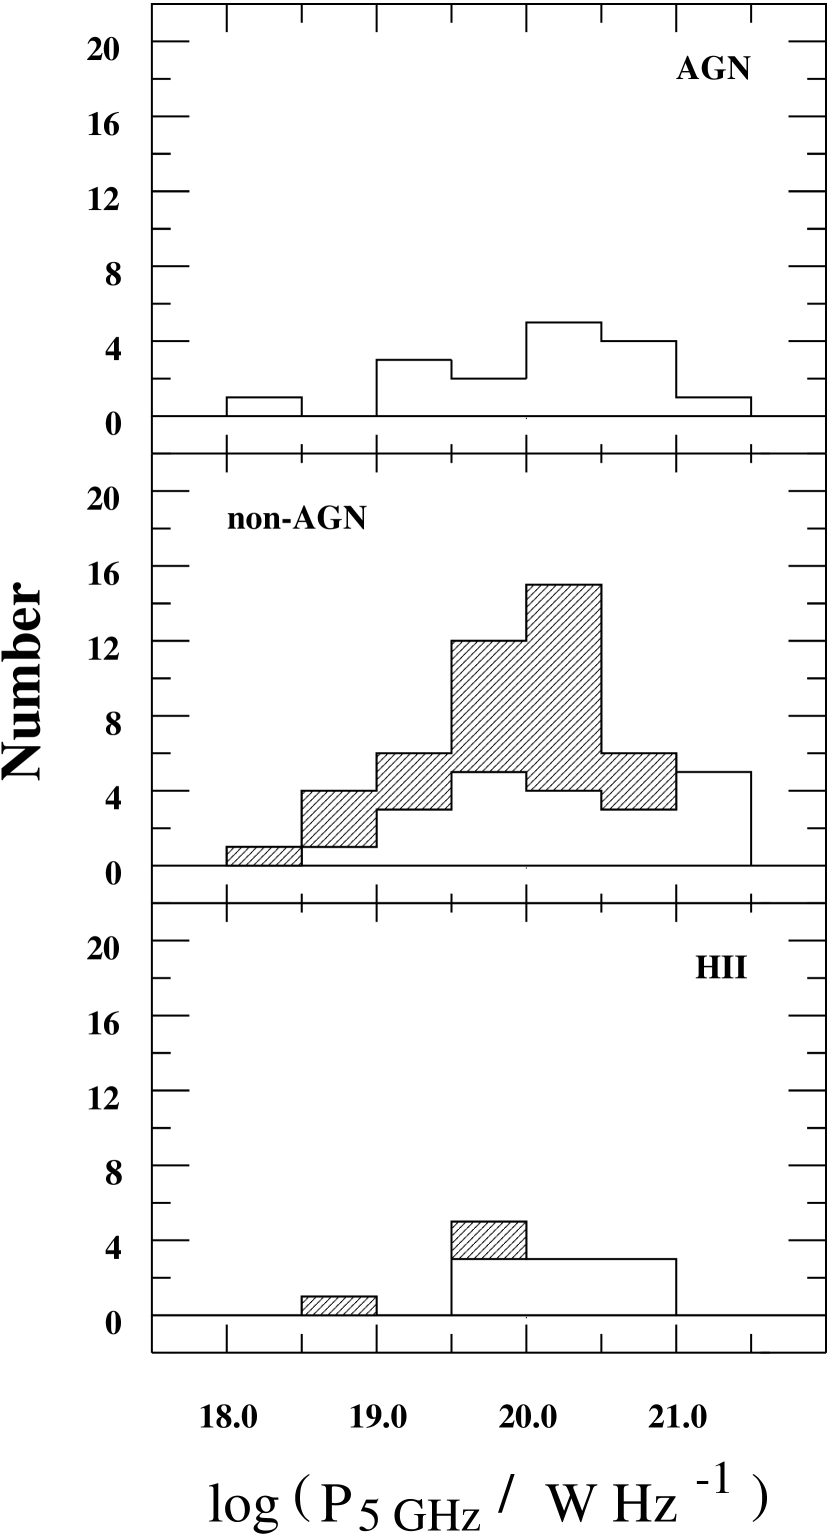
We have constructed binned distributions for the nuclear radio morphology, radio spectral index, 5 GHz radio power and extinction-corrected H luminosity for the complete composite source sample – AGN candidates and non-AGN sources – as well as the 12 H ii galaxies (Fig. 4).
– Histograms
5.1 Radio Morphology
The presence of a ‘prominent’ (1 mJy), compact radio core qualifies a composite source as an AGN candidate. Unresolved cores were detected in 63% of the AGN candidates. In 31% of the cases, the core is slightly resolved and in one source, NGC 4527, there is in addition a circumnuclear halo of diffuse radio emission. However, no jet-like emission is detected in any of the sources and most probably any extended emission is diffuse galactic emission.
Non-AGN composite sources show two types of morphology. About 43% of the non-AGN composite sources are quoted as single resolved cores. Some are classified as such based simply on visual inspection of 5 resolution FIRST images (NGC 3898; NGC 5746); however, they are all weak core-like sources (F1 mJy) which may be resolved out by high-resolution observations (e.g. Nagar et al. 2000; Falcke et al. 2000; Nagar et al. 2002; Filho et al. 2002) or may perhaps fall into the AGN candidate category if more sensitive observations were available (see discussion on NGC 660 and NGC 7331). The remaining non-AGN composite sources are similar in radio morphology to the H ii nuclei: both are dominated by the presence of large, diffuse and/or ambiguous radio emission.
5.2 Radio Spectral Index
Because spectral index values are significantly affected by such diverse effects as resolution mismatch, variability and underlying diffuse emission, we have not attempted to establish upper or lower limits. The spectral indices should be considered with caution, especially in the case of H ii nuclei, where the radio emission is extended.
The median spectral index for the AGN candidate, non-AGN composite source and H ii nuclei distribution is 0.45, 0.60, 0.40, respectively. Grouping all composite sources together, the median spectral index is 0.5.
With the exception of two sources, all of the AGN candidates show radio cores with relatively flat/inverted spectral indices (0.5). In the case of NGC 3627 and NGC 4527, extended disk radio emission has most probably contaminated the radio ‘core’ flux densities used in the spectral index values. For NGC 660, we argue that the similarity with the radio structure in NGC 1055 and NGC 7331 as well as the coincidence of the detected radio ‘core’ with the optical center of the galaxy and its radio power, make it very unlikely that the ‘core’ is stellar in origin.
Flat radio spectra can be produced by thermal gas – by free-free absorption of steep synchrotron emission and by optically thin free-free emission – or by a synchrotron self-absorbed radio core. Nuclear starbursts can have maximum brightness temperatures of T104-5 K (Condon et al. 1991b). Although the brightness temperature figures for arcsec-scale data (T102-3 K) do not permit us to disentangle the thermal versus nonthermal synchrotron emission, VLBA observations of 4 out of 6 AGN candidates (Falcke et al. 2000; Nagar et al. 2002; Filho et al. 2002) show that these sources do in fact harbour nonthermal, high brightness temperature (T106 K), compact radio cores, consistent with the presence of a synchrotron self-absorbed source.
Most non-AGN composite sources show a tendency for slightly steeper spectral indices (0.5), typical of nonthermal sources, like supernova remnants (e.g. Tarchi et al. 2000). Another subset shows relatively flat spectral indices (0.5) associated with either diffuse radio morphology or weak core-like sources. Most likely these are objects whose radio emission is dominated by thermal processes, similar to that occuring in H ii nuclei. All H ii nuclei have flattish (0.4) spectra as expected for thermal emission except for NGC 4800, whose steep spectral index is probably a result of resolution effects or contamination from nonthermal radio emission.
5.3 Radio Power
Some of the radio luminosities are censored; only upper limits are available. In order to treat such a censored data set, we have applied the Kaplan-Meier product-limit estimator (Feigelson & Nelson 1985). The results show that the mean radio power for the arcsec scale core emission in AGN candidates, non-AGN composite sources and H ii nuclei is respectively, (1.220.58), (1.190.43), and (5.281.37) in units of W Hz-1. Grouping all composite sources together, the mean is (1.200.35) W Hz-1.
We see no statistical difference between the three classes of sources: their radio power distributions are similar. In particular, the composite source nuclei populate the lower end of the integrated luminosity range of ‘normal’ nearby galaxies (1018-23 W Hz-1; see, e.g., Condon 1987, 1992) and the least luminous radio cores in Seyfert galaxies (1019-22 W Hz-1; see, e.g., Ho & Ulvestad 2001; Ulvestad & Ho 2001). Moreover, these composite sources are extremely faint when compared to traditionally studied AGN: a typical FR I radio galaxy core has a 5 GHz radio luminosity in the range 1021-25 W Hz-1 (Zirbel & Baum 1995).
5.4 Radio Continuum and Line Emission
Active galaxies display correlated radio and emission-line luminosities; these are well studied in Seyferts (Ho & Ulvestad 2001; Ulvestad & Ho 2001), radio galaxies (Zirbel & Baum 1995) and also in LINERs (Ho 1999; Nagar et al. 2000, 2002).
The median extinction-corrected H luminosity for the AGN candidates, non-AGN composite sources and H ii nuclei is, respectively, 1039.01, 1038.82, and 1039.59 in units of erg s-1. Taking all composite sources together, we obtain a median of 1038.87 erg s-1.
Although the peak in the H ii nuclei distribution hints at slightly larger H luminosities, on average, we conclude that there are no significant differences in the H luminosities of the three classes of sources.
In order to ascertain the nature of the radio emission and investigate any systematic trends between the different classes, we will start from the simplistic premise that all the H luminosity is due to stellar processes. Case B recombination theory allows us to calculate the number of ionizing photons needed to produce a given H luminosity, which in turn allows us to calculate how much free-free radio emission should be produced at a certain frequency. For a purely thermal source of T104 K and given H luminosity, Case B recombination predicts a certain radio power at 5 GHz, given approximately by (Ulvestad, Wilson, & Sramek 1981):
where L(H) is expressed in erg s-1.
We have plotted in Fig. 5 the nuclear radio power versus the extinction-corrected H luminosity for the AGN candidates, non-AGN composite sources and H ii nuclei. The solid line defines the predicted thermal radio power if all the H luminosity were due to star formation. Plotted also are the best-fitting linear correlations found for FR I (dashed) and FR II (dotted) radio galaxy cores (Zirbel & Baum 1995).
– Plot P vs. LHα
H ii galaxies seem to follow the thermal relation slope (to within 0.5 order of magnitude) with slightly higher radio luminosities than predicted. However, at any given H luminosity there is a range of almost two orders of magnitude in radio power in all composite sources (see also Nagar et al. 2002). If we compare our plot with similar diagrams constructed for Seyferts, LINERs and radio galaxies, we see that, despite substantial scatter, our composite sources seem to follow the more powerful AGN trends down to lower H luminosities and radio powers (Ho 1999; Ho & Peng 2001; Nagar et al. 2002).
We have investigated the possible correlation between P and LHα using the generalized Kendall test for censored data (Isobe, Feigelson, & Nelson 1986), where implies direct correlation, inverse correlation and no correlation. Censoring was considered in the dependent variable: radio power. Given the small number statistics for the AGN candidates, we have analysed AGN candidates and non-AGN composite sources together. The computed generalized Kendall’s correlation coefficient for composite sources and H ii is, respectively, 0.18 and 0.51, and the -value is 1.25 and 1.39. The probability that P and LHα are uncorrelated is 21% and 17%, respectively, for composite sources and H ii nuclei.
Most of the composite sources fall above the predicted 5 GHz threshold for thermal free-free emission, indicating that if thermal emission is present, it does not dominate the radio continuum. There must be an additional nonthermal component, not necessarily an AGN but possibly supernova remnants, contributing to the radio continuum. Interestingly, three of the AGN candidates (NGC 660, NGC 4527 and NGC 7331) having measured radio core resolutions about a factor two below the angular scale region used to measure the H luminosity, fall rather low with respect to the main body of data points.
Combining both samples in Paper I and the present paper, we obtain an overall detection rate of radio cores in 25% of the composite LINER/H ii galaxies, compared to the 17% detected in a distance limited sample of composite sources (Nagar et al. 2000, 2002). We find that radio cores occur not only in the ellipticals of our sample but also in the bulge-dominated spirals, confirming the trend reported in Paper I (see also Nagar et al. 2002). This detection rate is a factor two lower than in genuine LINERs (Nagar et al. 2000, 2002) and a factor three lower than the detection rate of radio cores in the low luminosity Seyfert galaxies of the Palomar sample (Ho & Ulvestad 2001), even though the sensitivity, resolution and radio luminosity range are similar. Now, lower radio core luminosities in composite sources are not unexpected since the core luminosity in LINERs and low luminosity Seyferts correlates with the [O i] 6300 line luminosity, and this neutral oxygen luminosity is significantly lower in composite sources (Nagar et al. 2000, 2002). Therefore, although many composite sources may harbour an AGN core, only the strongest radio cores will be detected.
We have plotted in Fig. 6 the nuclear radio power versus the extinction-corrected [O i] line luminosity (using the [O i] to H line ratio in column (4), Table 6).
– Plot P vs. L
As with the H luminosity, the correlation between radio power and [O i] line emission is absent, with radio power spanning almost two orders of magnitude at a given [O i] luminosity for all three different source types.
The significance of the correlation can be quantified by the generalized Kendall test, where again non-AGN composite sources and AGN candidates have been grouped together. We have considered upper limits in both the dependent (radio power) and independent variable ([O i] line luminosity). The computed correlation coefficient for composite sources and H ii is 0.07 and 0.18, and the -value 0.54 and 0.52, respectively. This implies that the probability of P and L being uncorrelated is 59% and 61% for composite sources and H ii nuclei, respectively.
In conclusion, compact, flat/inverted spectrum radio cores are detected in almost a quarter of all the composite objects, existing not only in ellipticals but also in bulge-dominated spirals (Sa-Sb; see also Nagar et al. 2002). Curiously, only one elliptical galaxy in our complete composite source sample – NGC 4125 – shows no radio evidence, on any scale, of an active nucleus (see Section 4.2). While a spheroid seems to be a necessary condition for AGN activity, it is certainly not a sufficient one.
On the other hand, composite objects, even the AGN candidates, do not seem to follow the radio versus [O i] and H line luminosity correlations seen in classical AGN and low luminosity AGN like LINERs (Ho & Ulvestad 2001; Nagar et al. 2002). The lack of correlation may be related to the resolution – at arcsec resolution, the radio emission may still be dominated by thermal processes related to circum-nuclear star formation (see NGC 660 and NGC 7331). However, except in their radio properties, we see no systematic trends that distinguish non-AGN composite sources from the AGN candidates. In fact, scaling arguments suggest that even composite sources without detected radio cores could be lower power versions of our radio core detections. This suggests that there is no obvious reason for all composite sources not to harbour an AGN core. We may only be detecting the high end of the composite source radio power, whereby weaker radio cores are drowned out by more dominating star forming regions (see discussion on NGC 660 and NGC 7331). The clue may be in resolution and sensitivity – detecting a very weak AGN core requires sensitive high dynamic range imaging. A complete AGN census requires a sensitive VLBI survey.
6 Conclusions
We have embarked on a radio imaging study of a complete sample of composite sources from the Palomar magnitude-limited sample of nearby emission-line nuclei. Our results show that a quarter of all composite sources host faint AGN, as revealed by the presence of compact, flat/inverted spectrum radio cores. Furthermore, these cores occur not only in elliptical galaxies, but also in bulge-dominated spirals. The rather low radio core luminosities suggest we are probing the very faint end of the AGN luminosity function. We cannot as yet exclude the possibility of a higher AGN fraction.
Acknowledgements.
M. E. F. is supported by grant PRAXIS XXI/BD/15830/98 from the Fundação para a Ciência e Tecnologia, Ministério da Ciência e Tecnologia, Portugal. L. C. H. is partly funded by NASA grant NAG 5-3556, and by NASA grants GO-06837.01-95A and AR-07527.02-96A from the Space Telescope Science Institute (operated by AURA, Inc., under NASA contract NAS5-26555). We have made extensive use of the NVSS and FIRST online database, as well as online VLA calibrator manuals. We want to thank Jim Ulvestad for providing us with calibrated VLA data and Leticia Martin-Hernandez for some useful assistance. We acknowledge the VLA, which is a facility of the National Radio Astronomy Observatory (NRAO) which is a facility of the National Science Foundation operated under cooperative agreement by Associated Universities, Inc. We have made extensive use of the APM (Automatic Plate Measuring) Facility, run by the Institute of Astronomy in Cambridge, the STScI DSS (Digitized Sky Survey), produced under US government grant NAGW – 2166, and NED (NASA/IPAC Extragalactic Database), which is operated by the Jet Propulsion Laboratory, California Institute of Technology, under contract with NASA.References
- (1)
- (2) Becker, R. H., White, R. L., & Edwards, A. L. 1991, ApJS, 75, 1
- (3)
- (4) Becker, R. H., White, R. L., & Helfand, D. J. 1995, ApJ, 450, 559
- (5)
- (6) Brosch, N., & Krumm, N. 1984, A&A, 132, 80
- (7)
- (8) Carral, P., Turner, J. L., & Ho, P. T. P. 1990, ApJ, 362, 434
- (9)
- (10) Clark, B. G. 1980, A&A, 89, 377
- (11)
- (12) Condon, J. J. 1980, ApJ, 242, 894
- (13)
- (14) Condon, J. J. 1987, ApJS, 65, 485
- (15)
- (16) Condon, J. J. 1992, ARA&A, 30, 575
- (17)
- (18) Condon, J. J., & Broderick, J. J. 1988, AJ, 96, 30
- (19)
- (20) Condon, J. J., Anderson, E., & Broderick, J. J. 1995, AJ, 109, 2318
- (21)
- (22) Condon, J. J., Condon, M. A., Gisler, G., & Puschell, J. J. 1982, ApJ, 252, 102
- (23)
- (24) Condon, J. J., Cotton, W. D., Greisen, E. W., Yin, Q. F., Perley, R. A., Taylor, G. B., & Broderick, J. J. 1998a, AJ, 115, 1693
- (25)
- (26) Condon, J. J., & Dressel, L. L. 1978, ApJ, 221, 456
- (27)
- (28) Condon, J. J., Frayer, D. T., & Broderick, J. J. 1991a, AJ, 101, 362
- (29)
- (30) Condon, J. J., Huang, Z. -P., Yin, Q. F., & Thuan, T. X. 1991b, ApJ, 378, 65
- (31)
- (32) Condon, J. J., Helou, G., Sanders, D. B., & Soifer, B. T. 1990, ApJS, 73, 359
- (33)
- (34) Condon, J. J., Yin, Q. F., & Burstein, D. 1987, ApJS, 65, 543
- (35)
- (36) Condon, J. J., Yin, Q. F., Thuan, T. X., & Boller, Th. 1998b, AJ, 116, 2682
- (37)
- (38) Cowan, J. J., Romanishin, W., & Branch, D. 1994, ApJ, 436, L139
- (39)
- (40) Douglas, J. N., Bash, F. N., Bozyan, F. A., Torrence, G. W., & Wolfe, C. 1996, AJ, 111, 1945
- (41)
- (42) Downes, A. J. B., Peacock, J. A., Savage, A., & Carrie, D. R. 1986, MNRAS, 218, 31
- (43)
- (44) Dressel, L. L., & Condon, J. J. 1978, ApJS, 36 53
- (45)
- (46) Dumke, M., Krause, M., Wielebinski, R., & Klein, U. 1995, A&A, 302, 691
- (47)
- (48) Fabbiano, G., Klein, U., Trinchieri, G., & Wielebinski, R. 1987, ApJ, 312, 111
- (49)
- (50) Falcke, H., Nagar, N. M., Wilson, A. S., & Ulvestad, J. 2000, ApJ, 542, 197
- (51)
- (52) Feretti, L., & Giovannini, G. 1980, A&A, 92, 296
- (53)
- (54) Feigelson, E. D., & Nelson, P. I. 1985, ApJ, 293, 192
- (55)
- (56) Filho, M. E., Barthel, P. D., & Ho, L. C. 2000, ApJS, 129, 93
- (57)
- (58) Filho, M. E. Nagar, N. M., Barthel, P. D. 2002, in prep.
- (59)
- (60) Garcia-Barreto, J. A., Carrillo, R., Klein, U., & Dahlem, M. 1993, RMxAA, 25, 31
- (61) Gioia, I. M., & Fabbiano, G. 1987, ApJS, 63, 771
- (62)
- (63) Gioia, I. M., & Gregorinni, L. 1980, A&AS, 41, 329
- (64)
- (65) Harnett, J. I. 1982, AuJPh, 35, 321
- (66)
- (67) Heckman, T. M. 1980, A&A, 87, 152
- (68)
- (69) Ho, L. C. 1996, in The Physics of LINERs in View of Recent Observations, ed. M. Eracleous et al. (San Francisco: ASP), 103
- (70)
- (71) Ho, L. C. 1999, ApJ, 510, 631
- (72)
- (73) Ho, L. C., Filippenko, A. V., & Sargent, W. L. W. 1993, ApJ, 417, 63
- (74)
- (75) Ho, L. C., Filippenko, A. V., & Sargent, W. L. W. 1995, ApJS, 98, 477
- (76)
- (77) Ho, L. C., Filippenko, A. V., & Sargent, W. L. W. 1997a, ApJS, 112, 315
- (78)
- (79) Ho, L. C., Filippenko, A. V., & Sargent, W. L. W. 1997b, ApJ, 487, 568
- (80)
- (81) Ho, L. C., & Peng, C. Y. 2001, ApJ, 555, 650
- (82)
- (83) Ho, L. C., & Ulvestad, J. S. 2001, ApJS, 133, 77
- (84)
- (85) Hummel, E. 1980, A&AS, 41, 151
- (86)
- (87) Hummel, E., & Bosma, A. 1982, AJ, 87, 242
- (88)
- (89) Hummel, E., & Kotanyi, C. G. 1982, A&A, 106, 183
- (90)
- (91) Hummel, E., Pedlar, A., van der Hulst, J. M., & Davies, R. D. 1985, A&AS, 60, 293
- (92)
- (93) Hummel, E., van der Hulst, J. M., & Dickey, J. M. 1984, A&A, 134, 207
- (94)
- (95) Hummel, E., van der Hulst, J. M., Keel, W. C., & Kennicutt Jr., R. C. 1987, A&AS, 70, 517
- (96)
- (97) Hummel, E., van Gorkom, J. H., & Kotanyi, C. G. 1983, ApJ, 267, L5
- (98)
- (99) Isobe, T., Feigelson, E. D., & Nelson, P. I. 1986, ApJ, 306, 490
- (100)
- (101) Israel, F. P., & Mahoney, M. J. 1990, ApJ, 352, 30
- (102)
- (103) Israel, F. P., & van der Hulst, J. M. 1983, AJ, 88, 1736
- (104)
- (105) Jones, D. L., Terzian, Y., & Sramek, R. A. 1981, ApJ, 246, 28
- (106)
- (107) Klein, U., & Emerson, D. T. 1981, A&A, 94, 29
- (108)
- (109) Klein, U., Wielebinski, R., & Beck, R. 1984, A&A, 133, 19
- (110)
- (111) Kotanyi, C. G., & Ekers, R. D. 1983, A&A, 122, 267
- (112)
- (113) Nagar, N. M, Falcke, H., Wilson, A. S., & Ho, L. C. 2000, ApJ, 542, 186
- (114)
- (115) Nagar, N. M, Falcke, H., Wilson, A. S., & Ulvestad, J. S. 2002, A&A, in press
- (116)
- (117) Neff, S. G., & Hutchings, J. B. 1992, AJ, 103, 1746
- (118)
- (119) Niklas, S., Klein, U., Braine, J., & Wielebinski, R. 1995, A&AS, 114, 21
- (120)
- (121) Perley, R. A., Schwab, F. R., & Bridle, A. H. 1989, in Synthesis Imaging in Radio Astronomy: A Collection of Lectures fromt he Third NRAO Synthesis Imaging Summer School (San Francisco: ASP), 6, p. 528
- (122)
- (123) Richstone, D., et al. 1998, Nature, 395, A14
- (124)
- (125) Sadler, E. M., Slee, O. B., Reynolds, J. E., & Roy, A. L. 1995, MNRAS, 276, 1373
- (126)
- (127) Saikia, D. J., Pedlar, A., Unger, S. W., & Axon, D. J. 1994, MNRAS, 270, 46
- (128)
- (129) Sramek, R. 1975, AJ, 80, 771
- (130)
- (131) Tarchi, A., Neininger, N., Greve, A., Klein, U., Garrington, S. T., Muxlow, T. W. B., Pedlar, A., & Glendenning, B. E., 2000, A&A, 358, 95
- (132)
- (133) Tully, R.B. 1988, Nearby Galaxies Catalogue
- (134)
- (135) Turner, K. C., Helou, G., & Terzian, Y. 1988, PASP, 100, 452
- (136)
- (137) Ulvestad, J. S., & Ho, L. C. 2001, ApJ, 558, 561
- (138)
- (139) Ulvestad, J. S., & Wilson, A. S. 1984, ApJ, 285, 439
- (140)
- (141) Ulvestad, J. S., Wilson, A. S., & Sramek, R. A. 1981, ApJ, 247, 419
- (142)
- (143) Urbanik, M., Klein, U., & Gräve, R. 1986, A&A, 166, 107
- (144)
- (145) van der Kruit, P. C. 1971, A&A, 15, 110
- (146)
- (147) van der Kruit, P. C. 1973a, A&A, 29, 231
- (148)
- (149) van der Kruit, P. C. 1973b, A&A, 29, 249
- (150)
- (151) Véron-Cetty, M. -P. & Véron, P. 1996, A&AS, 115, 97
- (152)
- (153) Vila, M. B., Pedlar, A., Davies, R. D., Hummel, E., & Axon, D. J. 1990, MNRAS, 242, 379
- (154)
- (155) Wrobel, J. M., & Heeschen, D. S. 1991, AJ, 101, 148
- (156)
- (157) Wunderlich, E., Wielebinski, R., & Klein, U. 1987, A&AS, 69, 487
- (158)
- (159) Zirbel, E. L., & Baum, S. A. 1995, ApJ, 448, 521
- (160)
| Other | R.A. | Decl. | ||||
|---|---|---|---|---|---|---|
| Galaxy | Name | (J2000) | (J2000) | (Mpc) | Hubble Type | Reference |
| (1) | (2) | (3) | (4) | (5) | (6) | (7) |
| IC 356aaGalaxies with new VLA observations. | 04 07 46.8 | 69 48 45 | 18.1 | SA(s)ab pec | 1,2 | |
| IC 1727aaGalaxies with new VLA observations. | 01 47 31.3 | 27 19 39 | 8.2 | SB(s)m | 2,3 | |
| NGC 410aaGalaxies with new VLA observations. | 01 10 58.9 | 33 09 08 | 70.6 | E+: | 3,4 | |
| NGC 488aaGalaxies with new VLA observations. | 01 21 46.8 | 05 15 25 | 29.3 | SA(r)b | 2,3,5,6,7 | |
| NGC 521aaGalaxies with new VLA observations. | 01 24 33.8 | 01 43 52 | 67.0 | SB(r)bc | 3,8 | |
| NGC 524aaGalaxies with new VLA observations. | 01 24 47.8 | 09 32 19 | 32.1 | SA(rs)0 + | 4,6,7,9,10,11 | |
| NGC 660 | 01 43 01.7 | 13 38 34 | 11.8 | SB(s)a pec | 1,2,3,4,5,12,13 | |
| 14,15,16,17,18 | ||||||
| 19,20,21,22,23,24 | ||||||
| NGC 1055aaGalaxies with new VLA observations. | 02 41 45.2 | 00 26 30 | 12.6 | SBb: spin | 1,2,3,4,5,6,7,12 | |
| 15,16,19,25,26,27 | ||||||
| NGC 1161aaGalaxies with new VLA observations. | 03 01 14.1 | 44 53 49 | 25.9 | SA0 | 4 | |
| NGC 2859 | 09 24 18.5 | 34 30 49 | 25.4 | (R)SB(r)0 + | 3,7,9,10,11,28 | |
| NGC 3245 | 10 27 18.4 | 28 30 27 | 22.2 | SA(r)0? | 4,7,9,11,25 | |
| NGC 3489 | 11 00 18.2 | 13 54 06 | 6.4 | SAB(rs)0 + | 3,6,7,9,10,11 | |
| NGC 3692 | 11 28 24.2 | 09 24 23 | 29.8 | SAb | 3,4,29 | |
| NGC 3705 | 11 30 06.7 | 09 16 36 | 17.0 | SAB(r)ab | 1,2,3,6,7,29 | |
| NGC 3898 | 11 49 15.1 | 56 05 01 | 21.9 | SA(s)ab | 2,4,7,25,28,30,31 | |
| 32,33 | ||||||
| NGC 3917 | 11 50 45.4 | 51 49 28 | 17.0 | SAcd: | 7,29,34 | |
| NGC 3953 | 11 53 49.0 | 52 19 37 | 17.0 | SB(r)bc | 1,2,7,8,15,26 | |
| 28,29,32,33,35 | ||||||
| NGC 3992 | M 109 | 11 57 36.1 | 53 22 29 | 17.0 | SB(rs)bc | 1,2,7,8,28,29,32 |
| NGC 4125 | 12 08 05.7 | 65 10 24 | 24.2 | E6 pec | 7,9,32,36,37 | |
| NGC 4145 | 12 10 01.6 | 39 52 59 | 20.7 | SAB(rs)d | 2,7,29 | |
| NGC 4150 | 12 10 33.3 | 30 24 12 | 9.7 | SA(r)0 ? | 3,7,9,11,36 | |
| NGC 4192 | M 98 | 12 13 48.3 | 14 54 01 | 16.8 | SAB(s)ab | 1,2,3,4,5,6,7,12 |
| 13,15,19,25,29,38 | ||||||
| NGC 4216 | 12 15 54.2 | 13 08 59 | 16.8 | SAB(s)b: | 1,2,3,4,5,6,7 | |
| 15,29 | ||||||
| NGC 4220 | 12 16 11.8 | 47 52 58 | 17.0 | SA(r)0 + | 4,9,11,26,29 | |
| NGC 4281 | 12 20 21.5 | 05 23 11 | 35.1 | SA0+: spin | 3,6,9,11 | |
| NGC 4324 | 12 23 06.1 | 05 15 00 | 35.1 | SA(r)0 + | 3,9 | |
| NGC 4350 | 12 23 57.5 | 16 41 35 | 16.8 | SAO spin | 3,7,9,11 | |
| NGC 4419 | 12 26 56.4 | 15 02 48 | 16.8 | SB(s)a spin | 3,4,5,12,13,15,24,29 | |
| NGC 4429 | 12 27 26.4 | 11 06 29 | 16.8 | SA(r)0 + | 3,6,7,9,11,29 | |
| NGC 4435 | 12 27 40.5 | 13 04 44 | 16.8 | SB(s)0 | 3,7,9,11,25,29,39,40 |
| Other | R.A. | Decl. | ||||
|---|---|---|---|---|---|---|
| Galaxy | Name | (J2000) | (J2000) | (Mpc) | Hubble Type | Reference |
| (1) | (2) | (3) | (4) | (5) | (6) | (7) |
| NGC 4459 | 12 28 59.9 | 13 58 45 | 16.8 | SA(r)0 + | 3,9,10,11,25 | |
| NGC 4527 | 12 34 08.5 | 02 39 11 | 13.5 | SAB(s)bc | 1,2,3,4,5,6,7,8,12,15 | |
| 16,25,29,41 | ||||||
| NGC 4569 | M 90 | 12 36 49.8 | 13 09 46 | 16.8 | SAB(rs)ab | 1,2,3,4,5,6,7,9,12,13 |
| 15,17,25,29,36,38,39 | ||||||
| 42,43 | ||||||
| NGC 5055 | M 63 | 13 15 49.2 | 42 01 49 | 7.2 | SA(rs)bc | 1,2,4,7,8,12,13,15,16 |
| 19,24,25,26,28,29,32 | ||||||
| 42,44,45,46 | ||||||
| NGC 5701 | 14 39 11.2 | 05 21 56 | 26.1 | (R)SB(rs)0/a | 2,3,5,6,29 | |
| NGC 5746 | 14 44 56.4 | 01 57 16 | 29.4 | SAB(rs)b? spin | 2,4,5,6,25,29 | |
| NGC 5866 | M 102 | 15 06 29.4 | 55 45 49 | 15.3 | SA0 + spin | 4,7,9,10,11,15,25 |
| 29,32,47,48,49 | ||||||
| NGC 7177aaGalaxies with new VLA observations. | 22 00 41.6 | 17 44 17 | 18.2 | SAB(r)b | 1,2,3,4,5 | |
| NGC 7331aaGalaxies with new VLA observations. | 22 37 04.1 | 34 24 56 | 14.3 | SA(s)b | 1,2,3,7,8,13,16,19,24 | |
| 26,28,44,48,50,51,52 | ||||||
| NGC 7742aaGalaxies with new VLA observations. | 23 44 15.9 | 10 46 04 | 22.2 | SA(r)b | 1,4,29 |
Note. — Units of right ascension are hours, minutes, and seconds, and units of declination are degress, arcminutes, and arcseconds.
References. — (1) Niklas et al. 1995; (2) Condon 1987; (3) Dressel & Condon 1978; (4) Condon et al. 1998a (NVSS); (5) Hummel et al. 1987; (6) Harnett 1982; (7) Hummel 1980; (8) Hummel et al. 1985; (9) Wrobel & Heeschen 1991; (10) Fabbiano et al. 1987; (11) Hummel & Kotanyi 1982; (12) Condon et al. 1995; (13) Condon et al. 1991a; (14) Carral et al. 1990; (15) Condon et al. 1990; (16) Condon & Broderick 1988; (17) Wunderlich et al. 1987; (18) Hummel et al. 1984; (19) Israel & van der Hulst 1983; (20) Condon et al. 1982; (21) Jones et al. 1981; (22) Condon 1980; (23) Condon & Dressel 1978; (24) Sramek 1975; (25) Becker et al. 1995 (FIRST); (26) Israel & Mahoney 1990; (27) Downes et al. 1986; (28) Gioia & Gregorinni 1980; (29) Nagar et al. 2000; (30) Gioia & Fabbiano 1987; (31) Brosch & Krumm 1984; (32) Heckman 1980; (33) van der Kruit 1971; (34) Condon et al. 1987; (35) Garcia-Barreto et al. 1993; (36) Condon et al. 1998b; (37) Hummel et al. 1983; (38) Turner et al. 1988; (39) Sadler et al. 1995; (40) Kotanyi & Ekers 1983; (41) Vila et al. 1990; (42) Neff & Hutchings 1992; (43) Urbanik et al. 1986; (44) Hummel & Bosma 1982; (45) Klein & Emerson 1981; (46) van der Kruit 1973a; (47) Feretti & Giovannini 1980; (48) van der Kruit 1973b; (49) Falcke et al. 2000; (50) Dumke et al. 1995; (51) Cowan et al. 1994; (52) Klein et al. 1984.
| Taper | Beam Size | P.A. | rms | ||
|---|---|---|---|---|---|
| Galaxy | (K) | (arcsec2) | (deg) | (mJy beam-1) | Figure Number |
| (1) | (2) | (3) | (4) | (5) | (6) |
| IC 356 | 0 | 3.50 1.98 | 60.00 | 0.081 | 1a |
| IC 1727 | 0 | 2.47 2.31 | 55.89 | 0.058 | |
| NGC 410 | 0 | 2.73 2.30 | 81.97 | 0.043 | 1b |
| NGC 488 | 0 | 2.93 2.52 | 39.51 | 0.049 | 1c |
| NGC 521 | 0 | 3.04 2.50 | 34.01 | 0.046 | 1d |
| NGC 524 | 0 | 2.66 2.47 | 35.18 | 0.043 | 2a |
| NGC 660 | 0 | 0.21 0.21 | 39.90 | 0.012 | 2c |
| 30 | 2.54 2.19 | 67.11 | 0.170 | 2d | |
| NGC 1055 | 0 | 3.45 2.57 | 41.65 | 0.047 | 2b |
| 30 | 8.25 6.82 | 21.34 | 0.065 | ||
| NGC 1161 | 0 | 2.66 2.10 | 44.97 | 0.070 | 3a |
| NGC 7177 | 0 | 2.40 2.26 | 16.91 | 0.042 | 3b |
| NGC 7331 | 0 | 2.37 2.15 | 32.26 | 0.039 | 3c |
| 30 | 7.64 6.24 | 37.86 | 0.051 | ||
| NGC 7742 | 0 | 2.52 2.38 | 18.76 | 0.039 | 3d |
| 30 | 5.68 5.13 | 30.86 | 0.063 |
| R.A. | Decl. | NVSS | aaThe integrated 8.4 GHz flux densities have been corrected for primary-beam attenuation. | ||
|---|---|---|---|---|---|
| Field Source | Name | (J2000) | (J2000) | (mJy) | (mJy) |
| (1) | (2) | (3) | (4) | (5) | (6) |
| IC 356NE | 04 08 21.39 | 69 50 04.6 | 6.0 | ||
| NGC 521SE | J012437+014112 | 01 24 37.97 | 01 41 12.0 | 17.6 | 3.5 |
| NGC 521NE | J012443+014535 | 01 24 43.95 | 01 45 36.6 | 5.7 | 1.5 |
| NGC 524SW | 01 24 41.71 | 09 31 20.9 | 0.8 | ||
| NGC 1161S | 03 01 13.53 | 44 51 59.4 | 1.2 | ||
| IC 1727SW | 01 47 21.55 | 27 18 53.3 | 0.6 | ||
| NGC 7331SW | 22 36 54.15 | 34 21 14.3 | 19.3 | ||
| NGC 7742SW | 23 44 10.08 | 10 45 25.4 | 0.8 |
Note. — Units of right ascension are hours, minutes, and seconds, and units of declination are degress, arcminutes, and arcseconds.
| Taper | R.A. | Decl. | aaTotal flux densities of very extended sources appear in parentheses. | Size | P.A. | ||
|---|---|---|---|---|---|---|---|
| Galaxy | (K) | (mJy beam-1) | (J2000) | (J2000) | (mJy) | (arcsec2) | (deg) |
| (1) | (2) | (3) | (4) | (5) | (6) | (7) | (8) |
| IC 356 | 0 | 0.82 | 04 07 46.67 | 69 48 45.0 | 1.16 | 2.89 0.36 | 34.16 |
| NGC 410 | 0 | 1.66 | 01 10 58.91 | 33 09 07.0 | 1.75 | 1.19 1.19 | |
| NGC 488 | 0 | 0.31 | 01 21 46.77 | 05 15 24.2 | 0.39 | 2.82 2.82 | |
| NGC 521 | 0 | 0.40 | 01 24 33.77 | 01 43 53.2 | 0.53 | 2.16 1.04 | 127.57 |
| NGC 524 | 0 | 1.95 | 01 24 47.75 | 09 32 20.1 | 2.10 | 1.02 0.17 | 115.37 |
| NGC 660 | 0 | 0.43 | 01 43 02.32 | 13 38 44.9 | 3.18 | 0.60 0.47 | 148.82 |
| 30 | (60) | ||||||
| NGC 660C1 | 0 | 0.99 | 01 43 02.40 | 13 38 46.2 | 5.53 | 0.62 0.31 | 59.00 |
| NGC 660C2 | 0 | 2.23 | 01 43 02.44 | 13 38 46.4 | 5.36 | 0.28 0.21 | 41.90 |
| NGC 1055 | 0 | 1.64 | 02 41 45.19 | 00 26 38.3 | 6.71 | 5.79 4.69 | 116.50 |
| 30 | (40) | ||||||
| NGC 1161 | 0 | 3.98 | 03 01 14.14 | 44 53 50.51 | 4.25 | 0.65 0.56 | 22.82 |
| NGC 7177 | 0 | 0.26 | 22 00 41.19 | 17 44 16.2 | 0.82 | 5.13 2.00 | 35.36 |
| NGC 7331 | 30 | (50) | |||||
| NGC 7742 | 30 | 0.49 | 23 44 15.84 | 10 46 01.1 | (21) | 37 32 | 118.99 |
Note. — Units of right ascension are hours, minutes, and seconds, and units of declination are degress, arcminutes, and arcseconds.
| Log L(H) | log PbbExtrapolation to 5 GHz was made using a spectral index of 0.7 for all sources and integrated flux densities of NGC 660, NGC 1055, NGC 3627, and NGC 7331. Integrated power is in parentheses. | ||||||
|---|---|---|---|---|---|---|---|
| Galaxy | Morph.aaU - single unresolved radio core; S - single slightly resolved radio core; D - diffuse radio emission; L - linear or multicomponent structure; A - ambiguous. | (erg s-1) | (W Hz-1) | Ref. | Ref. | ||
| (1) | (2) | (3) | (4) | (5) | (6) | (7) | (8) |
| IC 356 | S | 0.11 | 19.95 | 1 | |||
| IC 520 | 38.92 | 0.097 | 20.42 | 2 | |||
| IC 1727 | 38.17 | 0.016 | 18.90 | 1 | |||
| NGC 410 | S | 39.43 | 0.097 | 20.86 | 1 | ||
| NGC 488 | S | 39.20 | 0.13 | 19.90 | 1 | ||
| NGC 521 | S | 39.16 | 0.086 | 20.75 | 1 | ||
| NGC 524 | U | 38.58 | 0.14 | 20.26 | 1 | 0.8 | 1,3 |
| NGC 660 | S | 40.41 | 0.047 | 19.57 | 1 | ||
| S+L | (21.30) | 1 | |||||
| NGC 1055 | S | 37.92 | 0.064 | 19.95 | 1 | 0.0 | 1,4 |
| S+L | (21.18) | 1 | 1.1 | 1,10 | |||
| NGC 1161 | U | 39.01 | 0.14 | 20.38 | 1 | ||
| NGC 2541 | 37.26 | 0.082 | 19.12 | 2 | |||
| NGC 2859 | 38.59 | 0.092 | 19.59 | 3 | |||
| NGC 2985 | S | 38.36 | 0.12 | 20.51 | 2 | 0.2 | 2,11 |
| NGC 3245 | U | 40.03 | 0.086 | 20.94 | 4 | 0.5 | 3,4 |
| NGC 3489 | 38.20 | 0.11 | 18.39 | 3 | |||
| NGC 3627 | S | 39.16 | 0.13 | 19.15 | 2 | 1.2 | 2,12 |
| S+L | (20.45) | 2 | |||||
| NGC 3628 | S+D | 37.30 | 0.12 | 20.99 | 2 | 0.7 | 2,4 |
| NGC 3675 | A | 38.22 | 0.12 | 19.70 | 2 | 1.0 | 2,4 |
| NGC 3681 | 38.29 | 0.14 | 19.84 | 2 | |||
| NGC 3692 | 0.12 | 20.73 | 5 | ||||
| NGC 3705 | 39.15 | 0.079 | 20.24 | 5 | |||
| NGC 3898 | S | 38.91 | 0.091 | 19.42 | 4 | ||
| NGC 3917 | 37.29 | 0.13 | 20.24 | 5 | |||
| NGC 3953 | 38.79 | 0.12 | 20.28 | 5 | |||
| NGC 3992 | 0.13 | 20.28 | 5 | ||||
| NGC 4013 | S+D | 37.82 | 0.11 | 20.45 | 2 | 0.6 | 2,4 |
| NGC 4125 | 39.09 | 0.14 | 19.55 | 3 | |||
| NGC 4145 | 37.75 | 0.13 | 20.45 | 5 | |||
| NGC 4150 | 38.18 | 0.13 | 18.75 | 3 | |||
| NGC 4192 | 40.44 | 0.14 | 20.27 | 5 | |||
| NGC 4216 | U | 38.89 | 0.12 | 19.50 | 6 | ||
| NGC 4220 | 39.40 | 0.12 | 20.31 | 5 |
| Log L(H) | log PbbExtrapolation to 5 GHz was made using a spectral index of 0.7 for all sources and integrated flux densities of NGC 660, NGC 1055, NGC 3627, and NGC 7331. Integrated power is in parentheses. | ||||||
|---|---|---|---|---|---|---|---|
| Galaxy | Morph.aaU - single unresolved radio core; S - single slightly resolved radio core; D - diffuse radio emission; L - linear or multicomponent structure; A - ambiguous. | (erg s-1) | (W Hz-1) | Ref. | Ref. | ||
| (1) | (2) | (3) | (4) | (5) | (6) | (7) | (8) |
| NGC 4281 | 38.61 | 0.19 | 19.87 | 3 | |||
| NGC 4321 | D | 39.37 | 0.11 | 21.02 | 2 | 1.3 | 7 |
| NGC 4324 | 38.95 | 0.16 | 19.87 | 3 | |||
| NGC 4350 | 0.18 | 19.23 | 3 | ||||
| NGC 4414 | D | 38.47 | 0.14 | 21.29 | 2 | 0.4 | 2,4 |
| NGC 4419 | U | 40.72 | 0.075 | 20.07 | 6 | 0.7 | 4,6 |
| NGC 4429 | 39.18 | 0.097 | 20.19 | 5 | |||
| NGC 4435 | 39.67 | 0.13 | 20.19 | 5 | |||
| NGC 4459 | S | 38.79 | 0.13 | 19.08 | 4 | 0.7 | 3,4 |
| NGC 4527 | S+D | 40.12 | 0.075 | 19.47 | 7 | 0.9 | 7 |
| NGC 4552 | U | 38.55 | 0.13 | 20.78 | 2 | 0.2 | 2,4 |
| NGC 4569 | 40.28 | 0.062 | 20.19 | 5 | |||
| NGC 4643 | A | 38.44 | 0.078 | 19.83 | 2 | ||
| NGC 4713 | A | 0.087 | 20.27 | 2 | |||
| NGC 4826 | D | 38.87 | 0.073 | 21.20 | 2 | 0.3 | 2,4 |
| NGC 5012 | A | 39.02 | 0.081 | 18.60 | 2 | ||
| NGC 5055 | 38.62 | 0.17 | 19.46 | 5 | |||
| NGC 5354 | U | 38.71 | 0.14 | 21.02 | 2 | 0.2 | 2,4 |
| NGC 5656 | A | 38.70 | 0.14 | 20.48 | 2 | ||
| NGC 5678 | D | 39.74 | 0.079 | 21.41 | 2 | ||
| NGC 5701 | 38.22 | 0.14 | 20.58 | 5 | |||
| NGC 5746 | S | 39.25 | 0.10 | 19.38 | 4 | ||
| NGC 5866 | S | 38.82 | 0.13 | 20.37 | 8 | 0.6 | 3,4 |
| NGC 5838 | U | 0.053 | 20.18 | 2 | 0.0 | 1,4 | |
| NGC 5846 | U | 39.01 | 0.091 | 20.68 | 2 | 0.4 | 2,4 |
| NGC 5879 | 38.86 | 0.16 | 19.52 | 2 | |||
| NGC 5921 | S | 39.15 | 0.11 | 20.08 | 2 | 0.6 | 2,4 |
| NGC 6384 | 38.12 | 0.15 | 19.92 | 2 | |||
| NGC 6482 | 39.23 | 0.13 | 20.51 | 2 | |||
| NGC 6503 | 37.56 | 0.080 | 18.64 | 2 | |||
| NGC 7177 | S | 39.38 | 0.14 | 19.81 | 1 | ||
| NGC 7331 | U | 38.73 | 0.097 | 18.48 | 9 | 0.5 | 9 |
| D | (21.37) | 1 | |||||
| NGC 7742 | D | 39.07 | 0.13 | 21.39 | 1 |
| Log (H) | log PbbExtrapolation to 5 GHz was made using a spectral index of 0.7 for all sources and integrated flux densities of NGC 660, NGC 1055, NGC 3627, and NGC 7331. Integrated power is in parentheses. | ||||||
|---|---|---|---|---|---|---|---|
| Galaxy | Morph.aaU - single unresolved radio core; S - single slightly resolved radio core; D - diffuse radio emission; L - linear or multicomponent structure; A - ambiguous. | (erg s-1) | (W Hz-1) | Ref. | Ref. | ||
| (1) | (2) | (3) | (4) | (5) | (6) | (7) | (8) |
| NGC 3593 | D | 38.90 | 0.042 | 19.93 | 2 | 0.3 | 2,4 |
| NGC 3684 | 38.95 | 0.030 | 19.59 | 2 | |||
| NGC 4100 | D | 39.95 | 0.012 | 20.47 | 2 | 0.5 | 2,4 |
| NGC 4217 | D | 38.62 | 0.049 | 20.95 | 2 | 0.0 | 2,4 |
| NGC 4245 | 37.75 | 0.038 | 18.82 | 2 | |||
| NGC 4369 | D | 39.76 | 0.014 | 20.40 | 2 | 0.1 | 2,4 |
| NGC 4405 | 39.64 | 0.026 | 19.85 | 2 | |||
| NGC 4424 | D | 39.56 | 0.014 | 20.00 | 2 | 0.2 | 2,4 |
| NGC 4470 | A | 0.023 | 20.56 | 2 | |||
| NGC 4710 | D | 39.02 | 0.045 | 20.38 | 2 | 0.5 | 2,4 |
| NGC 4800 | A | 39.93 | 0.041 | 19.59 | 2 | 1.3 | 2,4 |
| NGC 4845 | D | 39.90 | 0.034 | 20.63 | 2 | 0.5 | 2,4 |
References. — (1) - This paper, 8.4 GHz 2 .5; (2) Filho et al. 2000, 8.4 GHz, 2 .5; (3) Wrobel & Heeschen 1991, 5 GHz, 5 ; (4) Becker et al. 1995 (FIRST), 1.4 GHz, 5 ; (5) Nagar et al. 2000, 15 GHz, 0 .2; (6) Nagar et al. 2000, 15 GHz, 4 ; (7) Vila et al. 1990; 1.4 GHz, 1 .4 and 5 GHz, 1 .2; (8) Falcke et al. 2000, 5 GHz, 0 .0025; (9) Cowan et al. 1994, 1.4 GHz, 1 .4 and 5 GHz, 1 .2; (10) Downes et al. 1986, 5 GHz, 7 ; (11) Condon et al. 1998b, 1.4 GHz, 5 ; (12) Saikia et al. 1994, 5 GHz, 1 .2.


![[Uncaptioned image]](/html/astro-ph/0205196/assets/x13.png)
![[Uncaptioned image]](/html/astro-ph/0205196/assets/x14.png)