Studies of galaxies in voids
We present here results of studies of the properties of galaxies located in very low density environments. We observed 26 blue compact galaxies (BCGs) from the Second Byurakan (SBS) and Case surveys located in voids with the radial velocities 11000 km s-1, two BCGs in the void behind the Virgo cluster and 11 BCGs in denser environments. H i fluxes and profile widths, as well as estimates of total H i masses, are presented for the 27 detected galaxies (of which 6 are in three galaxy pairs and are not resolved by the radiotelescope beam). Preliminary comparisons of void BCGs with similar objects from intermediate density regions - in the general field and the Local Supercluster (sub-samples of BCGs in the SBS zone) and in the dense environment of the Virgo Cluster (a BCD sample) - are performed using the hydrogen-to-blue-luminosity ratio /. We find that for the same blue luminosity, for 180, BCGs in lower density environment have on average more H i. The slope of the / for BCGs shows a trend of steepening with decreasing bright galaxy density, being very close to zero for the densest environment considered here and reaching = –0.4 for voids.
Key Words.:
large-scale structure of universe – galaxies: dwarfs – galaxies: interactions – radio lines: galaxies1 Introduction
Simple models for structure formation in CDM cosmologies predict a detectable biasing in the relative space distributions of bright (luminous, massive) vs. faint (subluminous, dwarf) galaxies, as a consequence of gaussian peak correlations in the random field (Bardeen et al. Bardeen86 (1986), Dekel & Silk Dekel86 (1986)). Thus, large regions devoid of massive galaxies (voids) emerge as a natural consequence of this approach. Low-mass and underdeveloped galaxies were expected to populate voids. Simple CDM models were shown to be too simplistic to explain the entire range of relevant observational data (e.g., Ostriker Ostriker96 (1996)). More complicated versions of DM cosmology were suggested, such as Cold+Hot DM (e.g., Klypin et al. Klypin93 (1993)) or unstable DM (e.g., Doroshkevich et al. Doroshkevich89 (1989), Cen Cen01 (2001)).
The observational evidence for the presence of galaxies in voids has been somewhat controversial. No large population of faint galaxies, with a much more homogeneous distribution than that of bright ones, was detected. However, the conclusions on how closely do dwarf galaxies follow the large scale structure (LSS) delineated by bright galaxies were quite different. Thuan et al. (Thuan91 (1991), and references therein) claimed that low surface brightness (LSB) dwarfs are distributed just like bright galaxies in volumes with limiting radial velocities up to 3000 km s-1. On the other hand, Salzer (Salzer89 (1989)), Pustilnik et al. (Pustilnik95 (1995)), and Lee et al. (Lee00 (2000)), who studied Hii-galaxies (BCGs) with radial velocities up to 10000 km s-1, found statistically significant differences in the spatial distributions of these low luminosity (low mass) and bright (massive) galaxies. Similar results are obtained by Popescu et al. (1997a ) in their Heidelberg void survey. While the majority of BCGs follow the filaments delineated by bright galaxies, being significantly more scattered around these structures, some 10–15 per cent of BCG/Hii galaxies were found to populate the voids seen in the distribution of bright galaxies ( –19.5, = 75 km s-1 Mpc-1 throughout the paper). Furthermore, the consideration of the nearest-neighbour statistics applied to the low-surface brightness dwarf sample from Thuan et al. (Thuan91 (1991)) leads to the conclusion that their spatial distribution is similar to that of BCGs (Pustilnik et al. Pustilnik95 (1995)). Later analysis of this LSB galaxy sample by Dominguez-Tenreiro et al. (Dominguez96 (1996)) yielded similar results.
Most H ii galaxies are subluminous, low-mass galaxies, which would be very difficult to detect in large voids far outside the Local Supercluster if they were not in a phase of active star formation (SF). Thus, with some reservations, we can consider BCG/H ii galaxies as representative low-mass gas-rich galaxies and study their spatial distribution at much larger distances. Another important aspect of BCGs in voids is that they can indicate where inside voids one should search for galaxies with lower levels of SF activity.
Finally, due to the existence of super-large scale structure, the voids themselves can have quite different properties such as the underdensity value (Pustilnik et al. Pustilnik94 (1994)). Therefore the study of galaxies in voids yields important information for the voids that host them.
Peebles (Peebles01 (2001)) argued recently that the void phenomenon remains the crucial one to reconcile the predictions of CDM models of structure formation (including the most up-dated CDM-versions) with observations of the galaxy distribution. While most predictions of CDM models seem consistent with observations, the void galaxies do pose some problems. The current simulations predict too many galaxies in voids. Either reasonable mechanisms for the suppression of galaxy formation in voids should be involved (Cen & Ostriker Cen00 (2000)), or the inclusion of warm dark matter might help (Bode et al. Bode01 (2001)).
An important question about galaxies populating voids is how similar are they to the more common galaxy population. The observed properties of galaxies as they appear today are determined partly by their formation parameters, as outlined, e.g., by Dalcanton et al. (Dalcanton97 (1997)), and partly by the influence of other galaxies through various interactions (e.g., in ”Physics of Nearby Galaxies” ed. by Thuan et al. Thuan92 (1992)). Galaxies in voids, by their apparently extreme isolation (at least from luminous galaxies), could be thought of as being frozen in their nascent state and could, in principle, reflect the distribution of global parameters of the first-formed galaxies. This can be very important, since in the framework of the hierarchical galaxy formation (e.g., White & Frenk White91 (1991)), most galaxies in more common environments have probably experienced some transformations, no longer representing the original parameters of a primordial galaxy population.
One of the approaches to the large-scale structure advocates a mass hierarchy in the LSS (e.g., Lindner et al. Lindner95 (1995, 1996)). This assumes that larger mass objects determine larger linear scale structures, both for overdense and for underdense regions. In this interpretation, void BCGs, as representatives of low-mass population, should belong to some overdensity structures defined by filaments of fainter galaxies (with lower masses and luminosities) that are mostly missed by modern redshift surveys dealing with magnitude-limited samples.
In this paper we study the properties of a large group of low-mass, actively star-forming galaxies residing in voids.
Previous studies of void galaxy properties include those in the Bootes void (e.g., Szomoru et al. 1996a ; 1996b ; Weistrop Weistrop94 (1994); Sage et al. Sage97 (1997); Cruzen et al. Cruzen97 (1997)). These galaxies represent a relatively high-luminosity group (with –21.0) and probably form an overdense region inside the Bootes void. Most of them are emission-line galaxies (ELGs) of various types of activity – from Starburst Nuclei (SBN) to Seyfert 2 galaxies.
One of the detailed, but somewhat limited (on galaxy number) studies of void low-mass galaxies is the Heidelberg void survey (Hopp et al. Hopp95 (1995), Popescu et al. Popescu96 (1996); 1997a ; 1997b ; Popescu98 (1998), Hopp Hopp98 (1998)). In the Hopp et al. sample in the direction of voids only nine dwarf galaxies are located fully within voids (three objects), or in some intermediate regions near the void boundaries (six galaxies). These galaxies were observed in the H i 21 cm line by Huchtmeier et al. (Huchtmeier97 (1997)) (hereafter HHK) and their morphology and colors were studied by Vennik et al. (Vennik96 (1996)). In the sample of Popescu et al. there were also 17 void BCGs (eight fully located in voids), but these were not observed in H i. The conclusion of Huchtmeier et al. (Huchtmeier97 (1997)) study was that the ratio / for the nine most isolated dwarfs is a factor of three larger than for a sample of Virgo cluster dwarfs.
The above-mentioned results offer a first insight into the properties of low-mass galaxies in voids, but with very poor statistics. Other factors can presumably affect the comparison of different samples. In particular, the ratio / is the same, within the uncertainties, for the two HHK groups with nine dwarf galaxies each, populating low and high galaxy density regions.
An additional study of galaxy properties in regions of lower galaxy density was presented recently by Grogin & Geller (2000a ; 2000b ). It is based on a large sample, mainly within the magnitude limits of the Zwicky catalog, implying rather luminous galaxies for the range of radial velocities studied (5000 to 10000 km s-1). However, a significant number of fainter galaxies was added as well. Only a small fraction of galaxies of their LV sample reside in the type of environment discussed below for void BCGs.
In this paper we present the results of H i observations of void BCG/H ii galaxies and test for possible differences in their neutral gas content through a comparison with galaxies in the denser environments. The paper is organized as follows: in Sect. 2 we describe the void sample. Sect. 3 presents the observations and data reduction. Results of the H i observations are shown in Sect. 4. In Sect. 5 we analyze the H i data by combining them with blue magnitudes, comparing them with similar data on galaxies from other samples, and discussing the results. In Sect. 6 we present some preliminary conclusions.
| # | IAU Name | VHela | Ref. | Ref. | Other name and note | |||||
| km s-1 | vel. | mag | mag | mag | Mpc | |||||
| 1 | 2 | 3 | 4 | 5 | 6 | 7 | 8 | 9 | 10 | |
| 1 | 0750+603A | 07h 50m 52.4 | +60∘ 18′ 54′′ | 11049 | 1 | 17.57 | 10 | –18.27 | 10.1 | Pair of BCGs |
| 2 | 0750+603B | 07 50 55.0 | +60 19 28 | 10841 | 1 | 17.40 | 10 | –18.44 | 10.1 | Pair of BCGs |
| 3 | 0834+362 | 08 34 01.6 | +36 14 36 | 9921 | 2 | 17.81 | 11 | –17.82 | 12.7 | CG 212 |
| 4 | 0847+612 | 08 47 25.3 | +61 12 29 | 4139 | 3 | 16.15 | 11 | –17.69 | 6.6 | MK 99 |
| 5 | 0912+599 | 09 12 53.5 | +59 58 53 | 4150 | 3 | 15.56 | 10 | –18.30 | 5.6 | MK 19 |
| 6 | 0919+364 | 09 19 29.6 | +36 26 24 | 9409 | 2 | 16.64 | 12 | –18.88 | 8.3 | CG 257 |
| 7 | 0926+606A | 09 26 20.1 | +60 40 02 | 4100 | 4 | 16.77 | 10 | –17.02 | 6.1 | Pair of BCGs |
| 8 | 0926+606B | 09 26 22.6 | +60 41 15 | 4190 | 4 | 17.31 | 10 | –16.52 | 6.1 | Pair of BCGs |
| 9 | 0938+611 | 09 38 54.1 | +61 06 17 | 7978 | 1 | 16.42 | 12 | –18.78 | 5.3 | MK 1421 |
| 10 | 1032+496 | 10 32 06.4 | +49 37 14 | 8604 | 3 | 17.38 | 12 | –17.96 | 5.4 | |
| 11 | 1044+306 | 10 44 37.3 | +30 37 48 | 8611 | 6 | 16.19 | 12 | –19.20 | 7.8 | CG 68 |
| 12 | 1044+307 | 10 44 52.6 | +30 42 04 | 8466 | 6 | 18.20 | 12 | –17.14 | 7.8 | CG 69 |
| 13 | 1048+334 | 10 48 52.8 | +33 26 24 | 9274 | 2 | 17.31 | 12 | –18.14 | 7.1 | CG 791 |
| 14 | 1120+586A | 11 20 49.0 | +58 39 09 | 11131 | 1 | 18.66 | 11 | –17.25 | 12.5 | Pair of BCGs |
| 15 | 1120+586B | 11 20 56.2 | +58 38 43 | 11109 | 7 | 18.36 | 11 | –17.55 | 12.5 | Pair of BCGs |
| 16 | 1122+610 | 11 22 22.6 | +61 03 28 | 9735 | 3 | 17.99 | 12 | –17.63 | 5.8 | |
| 17 | 1124+610 | 11 24 30.6 | +61 01 25 | 9710 | 3 | 17.16 | 11 | –18.45 | 5.6 | |
| 18 | 1219+150 | 12 19 52.0 | +15 01 27 | 4137 | 8 | 16.98 | 13 | –16.84 | 5.8 | VPC 208 |
| 19 | 1221+602 | 12 21 00.4 | +60 13 07 | 6987 | 3 | 16.87 | 11 | –18.09 | 11.9 | |
| 20 | 1225+571 | 12 25 38.6 | +57 10 32 | 8180 | 1 | 17.21 | 11 | –18.04 | 6.0 | |
| 21 | 1229+578 | 12 29 24.8 | +57 48 41 | 7361 | 3 | 16.72 | 11 | –18.32 | 8.7 | |
| 22 | 1236+122 | 12 36 51.0 | +12 28 12 | 3604 | 8 | 18.18 | 14 | –15.38 | 6.2 | 8 Zw 202 |
| 23 | 1332+599 | 13 32 56.8 | +59 59 53 | 9043 | 3 | 16.96 | 12 | –18.51 | 5.5 | |
| 24 | 1353+597 | 13 53 56.4 | +59 45 21 | 6571 | 3 | 17.16 | 12 | –17.68 | 5.7 | not BCG |
| 25 | 1354+580 | 13 54 42.4 | +58 00 25 | 8321 | 3 | 15.88 | 12 | –19.42 | 8.1 | |
| 26 | 1408+558 | 14 08 05.7 | +55 50 06 | 7973 | 3 | 16.20 | 12 | –18.96 | 6.0 | |
| 27 | 1420+544 | 14 20 59.1 | +54 27 45 | 6220 | 3 | 18.47 | 11 | –16.23 | 10.1 | |
| 28 | 1427+337 | 14 27 25.9 | +33 43 54 | 8017 | 1 | 18.11 | 11 | –17.09 | 6.7 | CG 447 |
| 29 | 1541+515 | 15 41 38.9 | +51 35 14 | 10577 | 1 | 17.71 | 12 | –18.07 | 9.2 | |
| 30 | 0745+601A | 07 45 44.1 | +60 08 31 | 9966 | 1 | 18.21 | 10 | –17.44 | 3.6 | |
| 31 | 0813+521 | 08 13 52.7 | +52 11 56 | 7225 | 4 | 17.16 | 10 | –17.77 | 4.8 | |
| 32 | 0943+561A | 09 43 17.8 | +56 10 58 | 8850 | 5 | 19.0 | 5 | –16.42 | 5.1 | |
| 33 | 1040+560 | 10 40 45.0 | +56 01 26 | 7740 | 3 | 15.49 | 12 | –19.64 | 0.1 | |
| 34 | 1050+372A | 10 50 13.9 | +37 14 17 | 7669 | 9 | 18.29 | 12 | –16.83 | 1.3 | CG 793 Pair of BCGs |
| 35 | 1050+372B | 10 50 14.7 | +37 14 24 | 7711 | 2 | 18.20 | 12 | –16.93 | 1.3 | CG 794 Pair of BCGs |
| 36 | 1249+493 | 12 49 35.7 | +49 19 45 | 7330 | 3 | 18.11 | 11 | –16.93 | 4.0 | |
| 37 | 1305+547 | 13 05 21.6 | +54 42 51 | 9714 | 3 | 15.85 | 12 | –19.78 | 1.7 | |
| 38 | 1312+550 | 13 12 32.8 | +55 03 45 | 9623 | 3 | 16.6: | 12 | –19.02 | 2.2 | Mkn 247 |
| 39 | 1457+540 | 14 57 11.8 | +54 03 24 | 7970 | 3 | 17.12 | 10 | –18.07 | 2.8 | |
| 40 | 1519+496 | 15 19 16.8 | +49 41 34 | 4548 | 3 | 16.19 | 12 | –17.79 | 4.6 | |
| ∗ Two BCGs from the void behind Virgo cluster | ||||||||||
| a Heliocentric velocities | ||||||||||
| 1. Unpublished data from 6m telescope, and Pustilnik et al. Pustilnik02 (2002), in preparation | ||||||||||
| 2. Ugryumov et al. (Ugryumov98 (1998)); 3. Pustilnik et al. (Pustilnik95 (1995)); 4. Izotov et al. (1993a ) | ||||||||||
| 5. Izotov et al. (Izotov97 (1997)); 6. Salzer et al. (Salzer95 (1995)); 7. Pustilnik et al. (PKLU01 (2001)) | ||||||||||
| 8. Drinkwater et al. (Drinkwater96 (1996)); 9. Kniazev et al. (Kniazev00 (2000)) | ||||||||||
| 10. Loiano 1.56m telescope data (Kniazev et al. Kniazev02 (2002), in preparation) | ||||||||||
| 11. KPNO 0.9m telescope data (Lipovetsky et al. Lipovetsky02 (2002), in preparation) | ||||||||||
| 12. FLWO 1.2m telescope data (Lipovetsky et al. Lipovetsky02 (2002), in preparation) | ||||||||||
| 13. Young & Currie (Young98 (1998)); 14. Zwicky et al. (Zwicky75 (1975)) | ||||||||||
2 The sample
2.1 Sample description
The BCGs (H ii galaxies) selected for this study were chosen from samples in the zones of SBS (Second Byurakan Survey): R.A. = 7h40m to 17h20m, Dec. = +49∘ to +61∘ (Izotov et al. 1993a ; 1993b ; Pustilnik et al. Pustilnik95 (1995)) and Case survey: R.A. = 8h00m to 16h10m, Dec. = +29∘ to +38∘. The latter sample incorporates data from Augarde et al. (Augarde87 (1987)), Weistrop & Downes (Weistrop88 (1988, 1991)), Salzer et al. (Salzer95 (1995)), Ugryumov (Ugryumov97 (1997)), and Ugryumov et al. (Ugryumov98 (1998)).
To separate the most isolated BCGs from bright galaxies we used the most complete compilation of radial velocities of galaxies from the Zwicky catalog – UZC by Falco et al. (Falco99 (1999), and references therein). To quantify our selection criterion we separated all BCGs from the indicated samples which have no bright (that is , corresponding to = –195) neighbouring galaxy closer than 5.3 Mpc. This distance corresponds to 80% of the radius of the smallest voids identified by Kauffmann & Fairall (Kauffmann91 (1991)). Note, that almost all BCGs are low-mass galaxies and are substantially fainter than . Therefore, galaxies of comparable and lower size found in the vicinity of many void BCGs (see Notes to Table 1 on individual objects) do not contradict the above definition of void BCGs. They rather indicate the existence of a mass hierarchy in the LSS.
Eleven additional galaxies were observed with more relaxed criteria, since they were primarily selected on an earlier version of the bright galaxy redshift catalog, and were later discovered to have a neighbour closer than this limit.
Galaxies from both the SBS and Case samples are selected from the objective-prism surveys. The objects which were selected have thus (a) strong emission lines, (b) high surface brightness. This is relevant in the context of a comparison with published samples, one of which is selected according to different criteria.
In the upper part of Table 1 we list 28 such galaxies (plus one non-BCG) with their coordinates (Cols. 2 and 3), optical heliocentric velocities (Col. 4), with respective reference (Col. 5), total blue magnitudes (Col. 6), followed by the reference to its source (Col. 7, see below). The errors in radial velocity range from 20 to 100 km s-1 while the blue magnitudes have errors smaller than 01. In Col. 8 we give the absolute blue magnitude, derived from and the distance in Col. 9. To derive the distances, the radial velocities were corrected for the solar motion relative to Local Group (LG) centroid, according to NED (Karachentsev & Makarov Kara96 (1996)) and the motion of LG to Virgo cluster with a peculiar velocity of 250 km s-1(Huchra Huchra88 (1988); Klypin et al. Klypin01 (2001)). For galaxies detected in H i, the heliocentric velocity was adopted from in Table 2, while for undetected BCGs, the optical velocity was adopted. No correction was done for Galaxy extinction, since this is small at the high galactic latitudes of our sample BCGs. In Col. 9 we give the estimate of the distance to the nearest neighbouring bright galaxy, mainly based on the UZC catalog of Falco et al. (Falco99 (1999)). In Col. 10 we give alternative names for each galaxy and some short notes. More detailed notes are given in the text. No alternative names means that the galaxy has the prefix ‘SBS’. The galaxies below the dividing line are from the complementary sample, selected with a more relaxed criterion on , as explained above. The same relates to Table 2. These galaxies were not used in the statistical analysis below.
Notes to Table 1 on individual objects:
0750+603AB – a pair of BCGs with projected distance of 26 kpc.
Parameters connected with H i are determined assuming that the two
galaxies have equal / values.
0847+612 – elongated central part with highly disturbed external
morphology: bent tail at SW edge, or possibly a distinct component in an
advanced stage of merger.
0919+364 – elongated galaxy with disturbed external part at NE, and
in contact (15″ to E) with 3 mag fainter and highly irregular
galaxy. Possibly a very advanced merger on the blue DSS-2 image.
0926+606AB – a pair of galaxies at a projected distance of 22 kpc.
Although both objects fall within the same NRT (Nançay Radio Telescope,
see section 3) beam, the H i profile
indicates the presence of two separate components. Decomposition of the
H i profile was performed.
0938+611 – on the blue DSS-2 shows an irregular periphery with weak
extension to SW (22″) – faint companion, 5 mag. fainter.
0943+561A – merger morphology on DSS-2 red image.
1032+496 – galaxy with disturbed external morphology.
1044+306 – highly disturbed periphery, with a probable faint companion
32″ to the North.
1044+307 – the galaxy CG 69 had a position error of
1.9′ in Pesch & Sanduleak (Pesch83 (1983)) (cf. J.Salzer,
private communication). The position of this galaxy in Table 1 was
measured on the Digitized Sky Survey-II (DSS) with an r.m.s. uncertainty of
1″. Although the NRT observations of this BCG were conducted
with wrong coordinates (R.A. offset of 29″, and declination offset
of 1.9′), the overall correction for the flux measurement is
only 7% because of the large NRT vertical beam (FWHM=22′).
This BCG is
situated in the same void as CG 68 (1044+306), however their projected
separation (580 kpc) is too large to consider them a physical pair.
The BCG is very compact (6 kpc), with irregular external morphology,
and with a probable irregular neighbour 10 fainter at 53″ (30 kpc in projection) to the North.
1048+334 – disturbed external morphology. Very close faint galaxy
(12″ to SE), almost in contact with the BCG.
1050+372AB – a pair of BCGs in contact (projected distance of
12″ or 6 kpc).
1120+586AB – a pair of BCGs with projected separation of 48 kpc and
=15 km s-1.
The galaxy SBS 1120+586B, with a previously unknown redshift,
is very close on the sky to BCG SBS 1120+586A. It has been shown recently
(Pustilnik et al. PKLU01 (2001)) to be a new BCG – physical companion of the
latter BCG. Although the pointing of 100m Effelsberg radio telescope was on
the
position of SBS 1120+586A, both galaxies were well within the radiotelescope
beam, and both are considered “detected”.
The B-component has a weaker emission-line spectrum, with
([O iii]5007) 25Å. and
/ are determined for each component assuming equal
/ ratios.
1219+150 – both central and external parts appear irregular, probably
a merger.
1221+602 – external parts are highly irregular, disturbed. Probable
faint companion galaxy 21″ to the West.
1225+571 – approximately regular, with somewhat disturbed external
parts.
1229+578 – disturbed external parts, possible faint satellite
20″ to the West.
1236+122 – galaxy with tail to the South. Disturbed morphology.
1332+599 – disturbed external morphology. Fainter galaxy in contact
15″ to South. Probable merger.
1353+597 – almost edge-on disk with warped ends and small companion
galaxy, 3 mag. fainter, 33″ to NW.
1354+580 – classical advanced merger.
1408+558 – large disk with highly disturbed periphery. Several faint
irregular galaxies 25″–40″ to NE and N: probable companions.
The nearest one is almost in contact.
1420+544 – compact with disturbed periphery and tail to the North.
1427+337 – on blue DSS-2: faint curved tail on the South, and probable
faint companion 12″ to South.
1541+515 – on blue DSS-2: disturbed periphery and faint companion in
contact near the western edge.
Inspection of the listed parameters shows that about half the objects are brighter than the limit (–180) usually separating dwarf from normal galaxies, but only two objects are brighter than =–190. Accounting for the known brightening of BCGs during a SF burst, relative to the luminosity in the non-active state up to 15 (on average, 075, Papaderos et al. Papa96 (1996)), this implies that we deal entirely with a population of low-mass galaxies that is, with gas-rich galaxies whose masses are significantly lower than those of galaxies. Table 1 includes also three pairs of BCGs which are located in voids; although each member of a pair is not isolated, the pairs themselves are, and their study fits well with our intention to investigate galaxies in very low density environments. Moreover, the notes section shows that many objects seem to have very faint companions.
2.2 Blue magnitudes
Total blue magnitudes are mainly obtained through CCD photometry with three telescopes: 1.68m Loiano telescope (Bologna University, Italy), 0.9m KPNO telescope (USA) and 1.2m Whipple Observatory (FLWO, Arizona, USA) during 1990-1996. These observations were conducted as part of a study of the properties of a large BCG sample extracted from the zones of the Second Byurakan (SBS) and Case surveys. These results will be published elsewhere (Kniazev et al. Kniazev02 (2002), Lipovetsky et al. Lipovetsky02 (2002)). Here we only use one integrated parameter for each BCG of interest, the integrated blue magnitude .
2.3 Galaxy density and the distance to the nearest bright neighbour
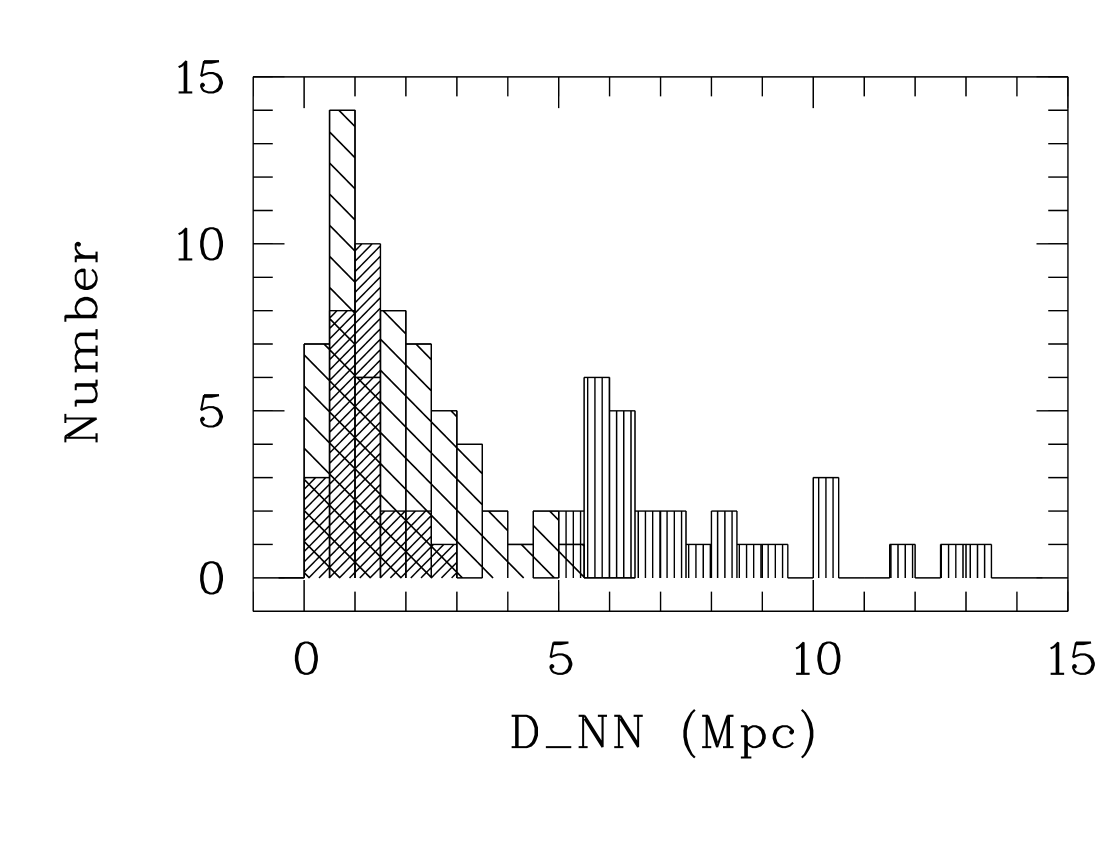
In order to compare the properties of void BCGs with those of BCGs residing in a more common environment, we need to estimate the background galaxy density, and to check how some of the properties vary with changes in the galaxy density. One of such parameters is – the distance to the nearest (–195) galaxy. The denser the environment, the smaller is the . In section 5 we illustrate the difference in galaxy density with histograms for each of the samples used in the comparison (Fig. 3).
3 Observations and reduction
Observations of 38 selected SBS and Case BCGs were conducted during the period April 1993 to November 1996 with the Nançay111The Nançay Radioastronomy Station is part of Paris Observatory and is operated by the Ministère de l’Education Nationale and Institute des Sciences de l’Univers of the Centre National de la Recherche Scientifique. 30035m radiotelescope (hereafter NRT) and with the Effelsberg222 The Effelsberg 100m radio telescope is part of the Max-Planck-Institut für Radioastronomie in Bonn 100m radiotelescope (hereafter the 100m telescope). 31 BCGs were observed with the NRT and 16 BCGs were observed with the 100m radiotelescope, with seven BCGs observed by both telescopes. Two more BCGs, in a void behind the Virgo cluster, were observed with the 100m radiotelescope.
3.1 Nançay radio telescope data
H i-observations with the NRT are characterized by a half-power beam width (HPBW) of 3.7′ (East-West) 22′ (North-South) at declination =0∘. We used a dual-polarization receiver with a system temperature of 40 K in the horizontal linear polarization and 60 K in the vertical linear polarization. Since all observed BCGs had known optical redshifts, we split the 1024-channel autocorrelator into two halves, each with a bandwidth of 6.4 MHz and centered at the frequency corresponding to the optical redshift. In this configuration, each segment covered a velocity range of 1350 km s-1. The channel spacing was 2.6 km s-1 before smoothing and the effective resolution, after averaging pairs of adjacent channels and Hanning smoothing, was 21 km s-1. The gain of the telescope was 1.1 K/Jy at declination =0∘. The observations were made in total power (position switching) mode with 2-minute on-source and 2 minute off-source integrations. Typically, we aimed to achieve an r.m.s. noise of 2.5 mJy per channel after smoothing. This led to a typical integration time of 1 hour on the galaxy and one hour on the comparison field. For galaxies with the lowest H i flux densities, the on-integration time could go up to 3–4 hours. A noise diode, whose power was regularly monitored through observations of known continuum and line sources, was used for the flux calibration. Comparisons of our measured fluxes with independent measurements of the same objects with other telescopes indicates a consistency of the flux scale within 10%. The Nançay data was reduced using the software developed by the NRT staff. The two polarizations, independently detected, were averaged for each integration to improve the sensitivity. The baselines were generally well-fitted by a third order or lower polynomial and were subtracted out.
3.2 Effelsberg 100m radiotelescope data
The half-power beam width of the 100-m radiotelescope at Effelsberg is 9.3′ at a wavelength of 21-cm. We used a cooled two-channel (dual polarisation) HEMT receiver with a system temperature of 30 K followed by a 1024 channel autocorrelator which was split into four banks of 256 channels each. A total bandwidth of 6.25 MHz provided sufficient baseline range and velocity coverage, as the radial velocities of all BCGs were known. The resulting channel separation was 24.4 kHz corresponding to a velocity resolution of 6.25 km s-1 or 10.2 km s-1 after Hanning smoothing. The telescope gain was 1.5 K/Jy for the elevation range 20 to 80 degrees. Observations were performed in total-power mode (position switching), integrating for five minutes on an empty (comparison) field ahead of source followed by five minutes on the source. Subtracting the off-position from the on-position reduces instrumental effects (such as baseline problems) to approximately 10% of their original values. Position checks and calibration measurements were done regularly by observing well-known continuum and line sources. The two polarizations detected independently were averaged for each integration to improve sensitivity. The Toolbox software of the MPIfR was used for the data reduction. Only modest corrections, using polynomials of first to third order, were applied in the baseline correction procedure.


| IAU name | Other | Dist. | Obs.Flux | Log | Telescope | ||||
| name or | km s-1 | Mpc | km s-1 | km s-1 | Jy km s-1 | & | |||
| prefix | Year | ||||||||
| 1 | 2 | 3 | 4 | 5 | 6 | 7 | 8 | 9 | 10 |
| 0750+603AB† | SBS | 1084417 | 146.9 | 18334 | 238 54 | 1.410.27 | 9.86 | N93 | |
| 0750+603A | SBS | 1084417 | 146.9 | 0.650.19 | 9.52 | 1.05 | |||
| 0750+603B | SBS | 1084417 | 146.9 | 0.760.19 | 9.59 | 1.05 | |||
| 0847+612† | MK 99 | 412012 | 58.8 | 12623 | 179 37 | 2.180.29 | 9.24 | 0.95 | N95 |
| 0912+599† | MK 19 | 415013 | 59.2 | 14426 | 206 40 | 2.330.37 | 9.27 | 0.59 | N93 |
| 0926+606A† | SBS | 400224 | 59.1 | 7823 | 120 37 | 1.300.49 | 9.00 | 1.01 | N95 |
| 0926+606B† | SBS | 409024 | 59.1 | 6723 | 120 37 | 1.100.49 | 8.93 | 1.40 | N95 |
| 0938+611 | SBS | 798011 | 109.5 | 3222 | 53 35 | 0.250.15 | 8.94 | 0.17 | N94 |
| -”- | 798330 | 109.5 | 6752 | 110 81 | 0.380.16 | 8.89 | E96 | ||
| 1032+496 | SBS | 855016 | 116.7 | 7432 | 126 51 | 0.330.09 | 9.03 | 0.45 | N94,N95 |
| 1044+306 | CG 68 | 883021 | 119.5 | 12742 | 168 66 | 0.470.16 | 9.19 | 0.21 | N95 |
| 1120+586AB | SBS | 1119821 | 152.1 | 20311 | 219 17 | 1.080.24 | 9.77 | E96 | |
| 1120+586A | SBS | 1119821 | 152.1 | 0.470.17 | 9.41 | 2.06 | |||
| 1120+586B | SBS | 1119821 | 152.1 | 0.610.17 | 9.53 | 2.06 | |||
| 1219+150 | VPC 208 | 414329 | 58.0 | 9313 | 112 20 | 0.470.10 | 8.56 | 0.44 | E96 |
| 1221+602 | SBS | 708322 | 98.1 | 19114 | 202 22 | 0.620.22 | 9.15 | 0.53 | E96 |
| 1236+122 | 8 Zw 202 | 361717 | 51.5 | 10032 | 126 50 | 0.270.12 | 8.21 | 0.59 | E96 |
| 1332+599 | SBS | 906327 | 124.3 | 10654 | 148 84 | 0.680.30 | 9.22 | 0.42 | N94 |
| 1353+597 | SBS | 668042 | 93.0 | 9584 | 201131 | 1.020.27 | 9.26 | 0.99 | N94 |
| -”- | 669423 | 93.0 | 7570 | 197109 | 0.850.16 | 9.26 | E96 | ||
| 1408+558 | SBS | 781225 | 107.8 | 8719 | 261187 | 1.510.27 | 9.36 | 0.38 | E96 |
| -”- | 777930 | 107.8 | 8460 | 137 95 | 0.360.22 | 9.36 | N94 | ||
| 0745+601 | SBS | 981725 | 134.7 | 6042 | 107 66 | 0.480.14 | 9.31 | 1.40 | E96 |
| 0813+521† | SBS | 706516 | 96.8 | 7932 | 119 50 | 0.830.26 | 9.26 | 0.92 | N93 |
| 1040+560 | SBS | 773821 | 106.3 | 21142 | 253 66 | 1.820.40 | 9.69 | 0.43 | N94 |
| 1050+372AB | CG 793/4 | 777210 | 105.9 | 95 5 | 95 5 | 0.770.25 | 9.32 | N95 | |
| 1050+372A | CG 793 | 777210 | 105.9 | 0.370.25 | 9.03 | 1.20 | N95 | ||
| 1050+372B | CG 794 | 777210 | 105.9 | 0.410.25 | 9.03 | 1.20 | N95 | ||
| 1249+493 | SBS | 739010 | 101.9 | 5320 | 74 31 | 0.270.13 | 8.99 | 1.06 | N94,N95 |
| 1305+547 | SBS | 9782 7 | 133.6 | 17913 | 190 21 | 2.040.50 | 9.94 | 0.68 | N94 |
| 1312+550 | SBS | 971811 | 132.9 | 8422 | 116 35 | 0.850.17 | 9.72 | 0.83 | N94 |
| -”- | 973024 | 132.9 | 10927 | 170 42 | 1.920.22 | 9.72 | E96 | ||
| 1457+540 | SBS | 790822 | 109.0 | 111 8 | 123 13 | 0.600.11 | 9.23 | 0.64 | E96 |
| 1519+496† | SBS | 4543 4 | 64.9 | 194 8 | 206 13 | 0.960.23 | 8.94 | 0.44 | N94 |
| † Data are from Thuan et al. (Thuan99 (1999)). | |||||||||
| ∗ Despite the confident detection the H i-velocity differs from the optical one by 200 km s-1 | |||||||||
| For BCGs detected at both telescopes the mean weighted flux is accepted and the respective given | |||||||||
| For pairs 0750+603AB, 1120+586AB and 1052+372AB with both BCGs in the beam, the first line presents the observed | |||||||||
| parameters. are calculated assuming the equal ratio for each member of the pair | |||||||||
| In the system 0926+606AB the average velocity is taken for and | |||||||||
4 Results
The H i-profiles of the detected galaxies are shown in Fig. 1 and 2. The profiles of seven BCGs, observed with the NRT are not displayed in Fig. 1, as they were already shown in an earlier paper by Thuan et al. (Thuan99 (1999)). However, their data are in Tables 1 and 2 and included in the analysis. A significant part of the profiles are quite wide, but they are not simple gaussians, or two-horned profile, as often observed for large spirals or for “regular” disks. Rather, the void BCGs show complex or asymmetric structures, indicating the presence of different dynamical entities. Less than one-third of the profiles are narrow and single-peaked, as typical of dwarf galaxies. Since the signal-to-noise (S/N) ratio is quite poor for the majority of the presented galaxies, it is difficult to discuss the profile shapes in further detail.
4.1 HI-parameters for detected galaxies
In Table 2 we present those void galaxies for which we estimate a S/N ratio of 2.5 or larger in the H i detection. The Table includes the following Cols.: (1) the IAU name for the galaxy, (2) name prefix or alternative name, (3) the H i-velocity with its r.m.s. error (km s-1), (4) the corresponding distance in Mpc, derived from the radial velocity the same way as in Table 1, (5) and (6) – the widths of the H i profile at 50% and 20% level of the peak value, (7) the integrated flux (in Jy km s-1), (8) the logarithm of the total H i-mass (in solar-mass units). For galaxies with independent data from the two telescopes we calculated weighted mean integrated flux, thus the H i-mass entry is the mean from both measurements. Col. (9) lists the value of / (in solar units.) In Col. (10) we give the telescope used (N: Nançay, E: Effelsberg) and the year of observation. The errors of the H i-velocity, the , and the integrated flux were calculated following Schneider et al. (Schneider86 (1986)).
The NRT H i signal for SBS 1332+599, 0938+611 and 1408+558 is quite low. For the latter two objects, the 100 m telescope detections are quite confident, and the data from both telescopes are consistent. The additional peak at 8500 km s-1 in the spectrum of SBS 1408+558 is presumably an artifact, since it is absent in the spectrum obtained with the 100 m telescope.
For BCGs pairs with close positions and velocities our detections yield their integrated H i emission. Only for SBS 0926+606A,B was it possible to decompose the H i profile, and derive the necessary parameters separately for every component. In order to calculate their distances we accepted their mean radial velocity, assuming their relative velocities are either random, or in a bound system. For the remaining three pairs we assumed that the ratio / is equal for both components, since the components are of similar type and brightness. At this point, we calculated for every component of BCG pair from the total and luminosity ratio.
4.2 Upper limits for the non-detected galaxies
In Table 3 we present upper limits to the H i-flux for the non-detected void galaxies. The Cols. (1) to (4) are the same as in Table 2, but the heliocentric velocity is derived from optical spectra, with a typical uncertainly of 100 km s-1. In Col. (5) we include the r.m.s. noise (1 in mJy) for one resolution element in the velocity interval near the optical velocity of a target galaxy. An upper limit for the integrated H i flux (in Jy km s-1) in Col. (6) is calculated by multiplying twice the r.m.s. value by an assumed velocity width of 100 km s-1. The respective upper limit on the logarithm of the H i-mass, calculated in the same manner as for the galaxies in Table 2, is given in Col. (7). In Col. (8) we also present the upper limits on the ratio /. Telescope and year of the observing run is given in Col. (9).
| IAU name | Other | Dist. | r.m.s. | Up.limit | Up.limit | Up.limit | Telescope | |
|---|---|---|---|---|---|---|---|---|
| name or | km | Mpc | mJy | Obs.Fluxc | Log | & | ||
| prefix | Jy km | Year | ||||||
| 1 | 2 | 3 | 4 | 5 | 6 | 7 | 8 | 9 |
| 0834+362 | CG 212 | 9921 | 134.1 | 3.9a | 0.54 | 9.53 | 1.61 | E96 |
| 0919+364 | CG 257 | 9409 | 127.0 | 1.2b | 0.24 | 8.96 | 0.16 | N95 |
| 0943+561A | SBS | 8850 | 122.5 | 2.3b | 0.46 | 9.21 | 2.20 | N94 |
| 1044+307 | CG 69 | 8466 | 117.2 | 3.0b | 0.60 | 9.29 | 1.73 | N94 |
| 1048+334 | CG 791 | 9274 | 129.8 | 3.8b | 0.76 | 9.50 | 1.02 | N95 |
| 1122+610 | SBS | 9735 | 133.4 | 1.8a | 0.25 | 9.07 | 0.59 | E96 |
| -”- | 9735 | 133.4 | 3.4b | 0.68 | N94 | |||
| 1124+610 | SBS | 9710 | 133.1 | 2.9b | 0.58 | 9.40 | 0.67 | N94 |
| 1225+571 | SBS | 8180 | 112.9 | 2.1b | 0.42 | 9.10 | 0.49 | N95 |
| 1229+578 | SBS | 7460 | 102.0 | 2.6b | 0.52 | 9.11 | 0.39 | N94 |
| 1354+580 | 8328 | 115.2 | 2.9a | 0.40 | 9.10 | 0.14 | E96 | |
| -”- | 8328 | 115.2 | 2.0b | 0.40 | N94 | |||
| 1420+544 | SBS | 6235 | 87.4 | 1.6a | 0.22 | 8.60 | 0.81 | E96 |
| -”- | 6235 | 87.4 | 3.6b | 0.72 | N94 | |||
| 1427+337 | CG 447 | 8017 | 110.6 | 2.5b | 0.50 | 8.94 | 0.80 | N96 |
| 1541+515 | SBS | 10577 | 145.4 | 2.8a | 0.39 | 9.29 | 0.72 | E96 |
| a r.m.s. from effective resolution of 10.2 km s-1 of 100m telescope. | ||||||||
| b r.m.s. from effective resolution of 21 km s-1 for NRT. | ||||||||
| c Upper limits for integrated flux are for effective resolution of 21 km s-1. | ||||||||
4.3 Inter-comparison of Nançay and Effelsberg observations
Tables 2 and 3 reveal a number of objects measured with both radio telescopes. It is possible to use these data as an independent check of the measurement technique. In Table 2 we list four objects detected by both instruments, while in Table 3 there are three objects with upper limits, observed both at Nançay and at Effelsberg. These seven objects form the basis of a comparison, which shows that the measurement methods and obtained results are compatible. In particular, we derive additional confidence from the facts that (a) the upper limits for the undetected objects in both observatories are similar, and (b) the derived parameters for the detected objects are consistent within the observational errors.
5 Analysis and discussion
5.1 General remarks
As already mentioned in the Introduction, our main purpose is to study the properties of underluminous galaxies in very low density environments. They are assumed to have had little interaction with other galaxies since their formation, in comparison with similar objects in more typical environments. We conducted observations in the 21-cm line of 28 BCGs in regions of very low galaxy density (as traced by magnitude-limited redshift surveys) achieving a detection rate of about 60%. 11 BCGs in denser environments were observed as well (lower part of Table 1). Our intention is to investigate whether these rare ‘void’ BCGs (which probably comprise no more than 10–15% of the total BCG population) show systematical differences in comparison to the more common BCG population.
In particular, if the main mechanism to trigger SF bursts in BCGs (and thus, to determine their cosmological evolution) is gravitational interaction with other galaxies, both massive and dwarfs (Pustilnik et al. PKLU01 (2001)), then BCGs in voids should have had much less chance to interact, and therefore should be, on average, less evolved. Several parameters, related to evolutionary status, can, in principle, be investigated for these BCGs. They include metallicity of H ii-regions, colors of the underlying stellar population and (suggesting that, as a first approximation, evolution proceeds without significant gas exchange with the environment) the mass fraction of H i gas relative to the total baryon mass. In order to correctly evaluate the stellar mass, and especially that of the older population, one requires the colors of the underlying nebulosity outside the compact region of the current SF burst. We therefore postpone this analysis to following papers.
We address now the evolutionary status of ‘void’ BCGs considering only the
ratio /. This can serve, as a “zero-order
approximation”, as a
mean evolutionary descriptor for different BCG samples, if we accept the
following hypotheses:
1. The first hypothesis is that, since the BCGs in
voids and those from comparison samples were selected from objective prism
spectra independently of position or redshift within the considered ranges,
their brightening due to recent SF is similar.
2. Since the B-band luminosity of the underlying nebulosity measures mainly
the stellar mass formed during the last 1 Gyr, one may suggest that the SF
duty cycle in BCGs, on a timescale of 1 Gyr, depends weakly on the
type of environment.
We compare below the samples in different types of environments and demonstrate their differences through the distribution of their values – the distance to their nearest bright galaxy. Note that in calculating here we adopted an important change in comparison to the method used by Pustilnik et al. (Pustilnik95 (1995)) to analyze the large-scale distribution of BCGs. was calculated there as a 3D distance, suggesting that all galaxy velocities originate from the Hubble flow after correcting for Virgocentric infall. Here we assume that sample galaxies seen close in projection ( 0.5 Mpc) to massive galaxies, and which are within V 500 km s-1 are probably physically associated. For such pairs is accepted as a first approximation to be 1.5 times the projected distance (to account for the most probable value of deprojection correction).
5.2 Samples of galaxies for comparison
To have the brightening due to SF burst approximately similar in our ‘void’ BCGs and in the galaxies from the comparison samples, we need to use objects with reasonably strong emission lines. One such suitable sample of galaxies, with a large number of members and with both and H i-fluxes available, is that studied by Thuan et al. (Thuan99 (1999)) and by Pustilnik et al. (PKLU01 (2001)). This is a subsample of 86 SBS BCGs with 6000 km s-1 with ([O iii]5007)45 Å. In the latter work, this sample was divided into two groups: 26 BCGs within the borders of the Local Supercluster (LS) and 60 remaining BCGs outside of it, that is, in the general field (GF) (for details see Pustilnik et al. PKLU01 (2001)). In further comparisons we will call them respectively ‘LS’ BCG and ‘GF’ BCG samples. To have magnitudes of comparison SBS BCGs in Fig. 4 on the same scale we recalculated their distances using the same method as for the void BCGs. The overall changes were small – of the order of 01 – 03.
5.2.1 General field SBS BCG sample
The closest to the ‘void’ BCG sample, in the aspect of the environment galaxy density, should be that representative of the “general field” (GF). The ‘GF’ SBS subsample has both and data and is, therefore, suitable for comparison purposes. We characterize the ‘void’ sample by the distribution of (relative to bright galaxies). To have an idea about the difference of the density of the ‘GF’ sample, we show its distribution in Fig. 3 as well as that for the ‘void’ sample. The mean value of for the ‘GF’ BCG sample is 1.8 Mpc, while it is 7.4 Mpc for the ‘void’ BCG sample. This implies an enhancement of a factor of 70 in the mean galaxy density for the GF subsample.
5.2.2 Local Supercluster SBS BCG sample
A somewhat denser environment should be expected for the SBS region within the borders of the Local Supercluster, since this includes the outskirts of the Virgo Cluster and the poor UMa cluster. This is already reflected in the fractions of BCGs with ‘massive’ companions within 0.5 Mpc in both ‘GF’ and ‘LS’ subsamples: 31 and 54%, as found by Pustilnik et al. (PKLU01 (2001)). Thus, we can use the SBS ‘LS’ BCG sample as well as the ‘GF’ BCG sample to test for differences among galaxies in regions of intermediate galaxy density. To quantify the galaxy density of the ‘LS’ sample of BCGs, we show in Fig. 3 its distribution of superposed on the distributions for the ‘void’ and ‘GF’ BCG sample. Its mean, as one would expect, is shifted to the lower value of 1.1 Mpc, and implies an 4-fold increase of the mean galaxy density, relative of the ‘GF’ sample, or an enhancement by almost two and a half orders of magnitude relative to the void sample.
| VCC | Flux | |||||
|---|---|---|---|---|---|---|
| Nu. | km s-1 | mag | Jy km s-1 | |||
| 1 | 2 | 3 | 4 | 5 | 6 | 7 |
| 10 | 1965 | 16.20 | 2.423 | -14.97 | 8.39 | 1.09 |
| 24 | 1280 | 16.12 | 3.538 | -15.05 | 8.55 | 1.48 |
| 144 | 2011 | 15.29 | 2.305 | -15.88 | 8.37 | 0.45 |
| 172 | 2194 | 15.38 | 4.784 | -15.79 | 8.68 | 1.01 |
| 324 | 1508 | 14.58 | 2.275 | -16.59 | 8.36 | 0.23 |
| 459 | 2103 | 15.29 | 2.465 | -15.88 | 8.40 | 0.48 |
| 1374 | 2560 | 15.00 | 1.506 | -16.17 | 8.18 | 0.22 |
| 1725 | 1051 | 15.18 | 1.893 | -15.99 | 8.28 | 0.33 |
| 1791 | 2057 | 14.85 | 6.307 | -16.32 | 8.80 | 0.82 |
| 22 | 1691 | 16.83 | 0.462 | -14.34 | 7.67 | 0.37 |
| 410 | 274 | 17.76 | 0.349 | -13.41 | 7.54 | 0.66 |
| 513 | 1828 | 15.84 | 0.270 | -15.33 | 7.43 | 0.09 |
| 562 | 45 | 16.59 | 0.348 | -14.58 | 7.54 | 0.22 |
| 985 | 1645 | 16.62 | 0.300 | -14.45 | 7.48 | 0.20 |
| 1179 | 777 | 15.98 | 0.433 | -15.19 | 7.64 | 0.16 |
| 2033 | 1508 | 15.61 | 0.410 | -15.56 | 7.61 | 0.11 |
5.2.3 BCDs in the Virgo cluster
Finally, it is important to compare ‘void’ BCGs with their analogs in the densest environment, like that of the Virgo Cluster (VC). Unfortunately there is no good sample of Virgo dwarfs selected by their strong emission lines. In the general catalog of Virgo cluster galaxies of Binggeli et al. (Binggeli85 (1985), hereafter BST), there exist galaxies classified as BCDs (blue compact dwarfs).
Based on the results of follow-up spectroscopy of some 30 VC BCDs from the BST list, Izotov & Guseva (Izotov89 (1989)) found that nine have strong [O iii] emission lines, and are thus similar to the SBS BCGs in voids considered here. The remaining 21 VC BCDs they studied did not show such emission lines. However, their global parameters [, , and size] were similar to those of the emission-line group of VC BCDs. This implies that most VC BCDs represent a homogeneous group of galaxies in various stages of recent star formation activity. The latter conclusion justifies (with the necessary reservations) the use of a more general VC BCD sample for comparison with BCGs, selected as ELGs with H ii-region type spectra.
The late-type dwarf galaxies in the BST sample have been observed in the 21 cm line from Arecibo by Hoffman et al. (Hoffman87 (1987)). The complete sample of 217 objects considered by Hoffman et al. consists of all the dwarf galaxies with 17.0 (with a few additions at the low surface-brightness end). From these we selected the objects corresponding to the morphological class of “blue compact”, including also those of questionable classification (BCD? in the typing of BST). This resulted in a total of 74 objects with total blue magnitudes from the VCC and extensive H i information (total flux, line width, etc.). Objects with an H i heliocentric velocity larger than 3000 km s-1 were deleted so as to avoid contamination by background objects. For all remaining objects it was assumed that they are at a fixed Virgo cluster distance of 17 Mpc. The latter is consistent with our accepted distance estimates for all considered BCGs, if we adopt (Virgo Cluster) = 1079 km s-1 (NED), and with the recent estimate of the distance to Virgo cluster from photometrical distances to its several galaxies (Tikhonov et al. Tikhonov00 (2000)). This does some injustice to the considerable depth of the VC, but allows one to calculate total hydrogen contents and luminosities in a consistent manner.
The Virgo cluster sample was selected from the Hoffman et al. list with the following constraints: (1) the galaxies should have the morphological mention ’BCD’, or BCD and another qualifier in the VCC, (2) they should have positive (i.e., non-zero) single-beam HI measurements, (3) the HI velocity should be lower than 3000 km s-1 for them to be considered cluster members, and (4) the total HI flux should be greater than 1.5 Jy km s-1 (for the sub-sample of high hydrogen content), or smaller than 0.5 Jy km s-1 but still positive (for the low hydrogen content sub-sample).
A sub-sample of 40% of these galaxies has been studied in detail with multi-band imaging by Almoznino & Brosch (1998a ; 1998b ). This study revealed that only 75% of the BCDs have H emission, and some show this as extended emission, which may not be detectable in observations similar to those from which the “voids” sample was selected. Table 4 shows the relevant information for the VC BCGs (VCC number, , integrated -band magnitude , H i-flux of the galaxy in Jy km s-1). The absolute magnitude , and the ratio /, both in solar units, are given as well.
5.3 Distributions of / for various BCG samples
Since the / ratio for the combined sample of nearby galaxies increases with decreasing (Haynes & Giovanelli Haynes84 (1984); Huchtmeier & Richter Huchtmeier88 (1988); Staveley-Smith et al. Staveley92 (1992)), we need to compare this ratio for each luminosity bin separately, that is, we need to plot / versus for each sample and check, for example, how the distributions differ.
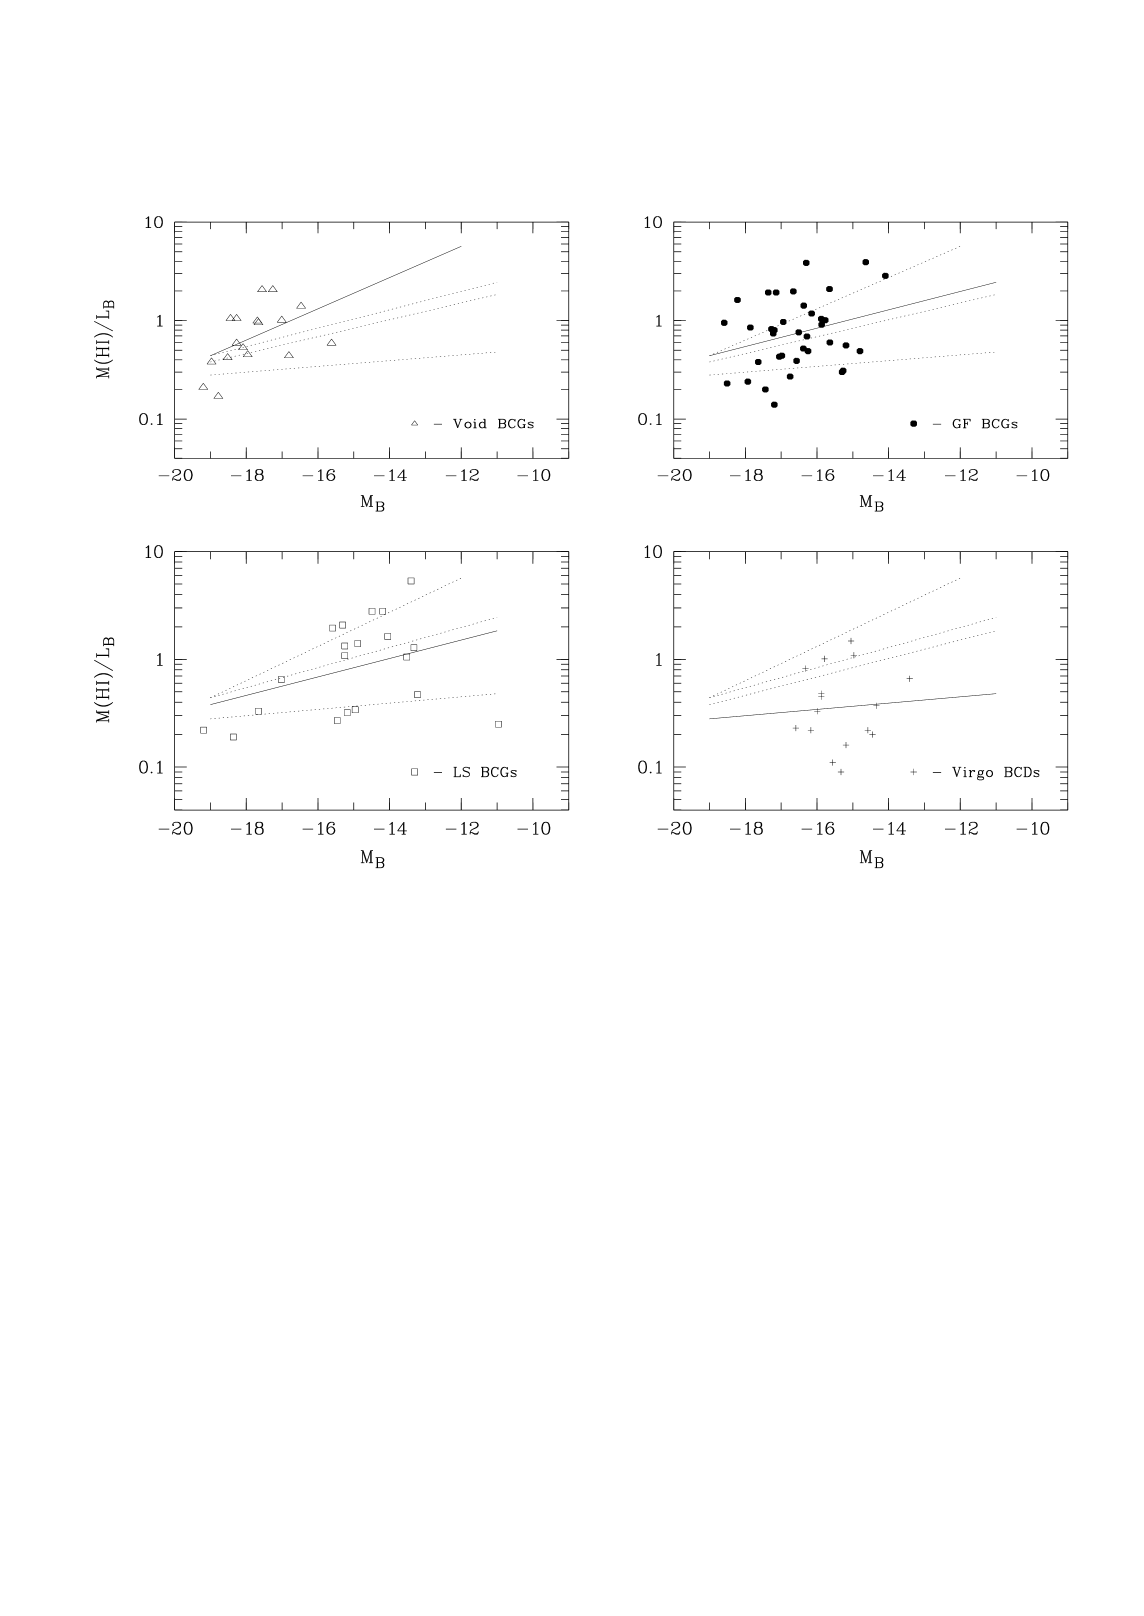
In the four panels of Fig. 4 we show / versus with detected H i flux for all samples under consideration. They include 17 ‘Void’ BCGs (triangles), 37 ‘GF’ BCGs (filled octahedrons), 20 ‘LS’ BCGs (squares) and 16 Virgo Cluster BCDs (crosses).
The diagrams show, as expected (excluding, perhaps, the Virgo cluster sample), that the ratio / systematically increases as the blue luminosity decreases. However, this increase is quite different for each of the samples. The simplest way to check this is to compare the slopes of the linear regression of (/) vs. . Seemingly, there is a smooth transition of the slope value from the densest environment tested here, the VC sample, to the least dense environment represented by the void galaxies. The slope values we measure are 0.029, 0.085, 0.093, and 0.159 for the samples in Virgo cluster, Local Supercluster volume, General Field, and Voids, respectively. The scatter for the Virgo BCDs is so large that one can barely suggest a relation between the variables.
By multiplying these slopes by –2.5, we can express them as the more common parameter in the relation /, discussed, e.g., by Staveley-Smith et al. (Staveley92 (1992)) for LSB dIs and BCGs, and recently by Smoker et al. (Smoker00 (2000)) for emission-line galaxies from the University of Michigan survey. The former authors derived =–0.30.1, while the latter give for their H i-detected University of Michigan survey ELGs =–0.20.1. The values of for our samples of Virgo BCD and BCGs from the Local Supercluster volume, the General Field, and from Void regions are respectively: –0.070.28, –0.210.12, –0.230.14 and –0.400.18. One can notice that the value for the ‘GF’ and ‘LS’ BCG samples are very close, and the regression lines approach each other.
Since the scatter of / in each sample is large, and the samples are relatively small, the resulting uncertainties in are also large. Therefore, despite the trend of the slope steepening with the decrease of the bright galaxy density in BCG environment, its formal confidence level is not high. It is important to note that, while the H i integrated flux measurement errors (up to 50%) can result in some additional scattering around the regression lines, the main component of this scattering is due to other factors: the variable factor of the -band brightening due to the current SF episode can amount to a factor of 4–6 (15–20), and can increase the scatter in the / ratio.
Comparing our results with earlier data, we conclude that the value of =–(0.2-0.3), derived from observations of nearby samples, corresponds to galaxies populating the more or less typical environment – general field, and partly, the Local Supercluster. Void galaxies seemingly follow a steeper slope, while for BCGs in clusters, which are on average more gas-poor, probably some additional processes take place that dilute the luminosity dependence of /.
The linear fits to the three BCG samples in the and plots are very close to each other at the brightest magnitudes of the studied range, =–190, and all three are quite close to the fit for Virgo BCDs. However, for the fainter luminosities the differences in average values of among the various samples become significant. Thus, for 170 the mean values of for ‘Void’ BCGs and VC BCDs differ by a factor of 3.0, as was already noticed by HHK. The difference between ‘Void’ and ‘GF’ BCG for this luminosity is only 1.4, but is expected to increase for fainter BCGs. Due to the large scattering in the data points, the differences found between BCGs in voids and in more common environments should be considered tentative. Larger samples, and higher S/N data, are necessary to further confirm and study this phenomenon.
A possible explanation could be connected with the difference in the ability of a galaxy to retain its hydrogen; in a void environment this may be easier than in a denser neighbourhood, such as in a cluster. The increase of the / difference in the four galaxy samples considered here, along with the decrease of galaxy luminosity, is consistent with the hypothesis that low-mass galaxies lose their gas mainly due to interactions with other galaxies. The smaller a galaxy the more severe is the effect of interaction with a colliding partner.
We note that the values of / cited for ‘void’ and other BCGs are not the largest among gas-rich galaxies; some of the LSB dwarfs studied by van Zee et al. (vanZee95 (1995)) have a ratio several times higher. However, accounting for the significant brightening of void BCG progenitors during SF bursts, their preburst value of / could be comparable to that of the most gas-rich Low Surface Brightness Dwarfs.
5.4 Interactions as SF triggers in void BCGs
Based on the notes in Table 1, we would like to comment briefly on the probable tidal action of the nearby neighbours with luminosities comparable to or lower than those of studied BCGs. Of 28 BCGs in upper part of Table 1 (SBS 1353+597 is non-ELG) six galaxies belong to ”pairs” with V150 km s-1, and projected distances in the range of 20–30 kpc. Six more galaxies – 0847+612, 0912+599, 0919+364, 1219+150, 1332+599 and 1354+580 show signs of merger morphologies. A dozen more BCGs show disturbed external morphologies, that could be taken as an indication of recent interactions. Most have significantly fainter galaxies (B=2–4 mag.) either in contact, or at the angular distances of 15″–30″, corresponding to projected linear distances of (7–20) kpc. While their radial velocities are unknown, a significant fraction of these faint ”companions” appear to be physical companions of the void BCGs under consideration. A more detailed analysis of the possible tidal trigger of SF bursts in such pairs was presented by Pustilnik et al. (PKLU01 (2001)). Taking the numbers above, we can expect that up to 80% of void BCGs have their SF triggered by interactions with galaxies in their local environment. This is consistent with the results obtained by Pustilnik et al. (PKLU01 (2001)) for the general field. In voids, all these nearby galaxies, by the definition of voids, should be of relatively low luminosity/mass.
It is worthwhile to note that the difference in the / ratio between BCGs in voids and in the general field discussed previously is quite small, despite the difference in the environment density of bright galaxies of factor of 70 (see section 5.2.1). If galaxy interactions are the main factor of H i gas astration and removal, this finding indicates that the densities of lower-mass galaxies in voids and in the general field differ much less than that of galaxies.
6 Conclusions
1. In this paper we presented observational data on the integrated H i
emission of 28 BCGs residing in regions of very low galactic density
(voids).
About 60% of them were detected, and their H i-masses were
determined and used in further analysis.
2. The parameter / was derived and its dependence on
was analyzed for void BCGs and for some comparison BCG samples.
Our analysis indicates a trend in the variation of the index
of the power-law fit of /
with decreasing bright galaxy density, from cluster
to the void environment, with a full range of from –0.1 to –0.4.
3. Consistently, the mean / value for a given
increases with the decrease of bright galaxy density. The ‘void’ BCGs have
the highest / mean values, which hints to their
younger evolution status or lower gas loss due to interactions.
4. We note that a significant fraction of BCGs in voids (probably up to
60%) form either interacting pairs with low-mass galaxies of
similar luminosity,
or show morphological signs of interaction and/or close faint
neighbours; in addition 20% demonstrate merging in various stages.
This implies, in accordance with the results of Grogin
& Geller (2000b ), that even in voids, interactions with
the local environment of low-mass galaxies may be one of the
main channels to trigger SF bursts in BCG progenitors.
Acknowledgements.
We are grateful to the NRT Comittee de Programmes and to the Program Committee of the Effelsberg Radiotelescope for observational time, and to T.X.Thuan for help during the initial phase of this project. J.Salzer kindly provided the information on the wrong position of CG 69. The notes and suggestions of the anonymous referee were very helpful in improving the text and the result presentation. SAP is grateful for the hospitality of the staff of Observatoire de Paris-Meudon, ARPEGES, and of the Wise Observatory of Tel Aviv University, where parts of this work were performed. The authors are grateful to A.Kniazev for providing his unpublished photometry data and to A.Ugryumov for providing his code for calculating . Part of this project was performed within the INTAS Research Grant 96-0500; SAP, JMM, and NB are grateful to the INTAS foundation for this grant. NB is grateful for the continued support of the Austrian Friends of Tel Aviv University and acknowledges support from a Center of Excellence award from the Israel Science Foundation. The use of the Digitized Sky Survey (DSS-II) was very helpful for checking the morphology and local environment of the studied galaxies.References
- (1) Almoznino, E., & Brosch, N. 1998a, MNRAS, 298, 920
- (2) Almoznino, E., & Brosch, N. 1998b, MNRAS, 298, 931
- (3) Augarde, R., Figon, P., Kunth, D., & Sevre P. 1987, A&A, 185, 4
- (4) Bardeen, J.M., Bond, J.R., Kaiser, N., & Szalay, A.S. 1986, ApJ, 304, 15
- (5) Binggeli, B., Sandage, A., & Tammann G.A. 1985, AJ, 90, 1681.
- (6) Bode, P., Ostriker, J., & Turok N. 2001, ApJ, 556, 93
- (7) Brosch, N., Almoznino, E., & Hoffman, G.L. 1998, A&A, 331, 873.
- (8) Cen, R. 2001, ApJ, 546, L81
- (9) Cen, R., & Ostriker J. 2000, ApJ, 538, 83
- (10) Cruzen, S.Y., Weistrop, D., & Hoops S.G. 1997, AJ, 113, 1983
- (11) Dekel, A., & Silk, J. 1986, ApJ, 303, 39
- (12) Doroshkevich, A.G., Klypin, A.A., & Khlopov, M.Y. 1989, MNRAS, 239, 923
- (13) Dalcanton, J.J., Spergel, D.N., & Summers F.J. 1997, ApJ, 482, 659
- (14) Dominguez-Tenreiro, R., Alimi, J.-M., Serna, A., & Thuan T.X. 1996, ApJ, 469, 53
- (15) Drinkwater, M.J., Currie, M.J., Young, C.K., Hardy, E., & Yearsley J.M. 1996, MNRAS, 279, 595
- (16) Falco, E.E., Kurtz, M.J., Geller, M.J., et al. 1999, PASP, 111, 438
- (17) Grogin, N., & Geller, M. 2000a, AJ, 118, 2561
- (18) Grogin, N., & Geller, M. 2000b, AJ, 119, 32
- (19) Haynes, M.P., & Giovanelli, R. 1984, AJ, 89, 758
- (20) Hoffman, G.L., Helou, G., Salpeter, E.E., Glosson, J., & Sandage, A. 1987, ApJS, 63, 247.
- (21) Hopp, U. 1998, in: The Evolving Universe. Selected Topics on Large-Scale Structure and on the Properties of Galaxies. eds. D.Hamilton et al., Dordrecht, Kluwer. Series: Astrophysics and Space Science Library, Vol. 231, p.59
- (22) Hopp, U., Kuhn, B., Thiele, U., et al. 1995, A&AS, 109, 537
- (23) Huchra, J.P. 1988, in ASP Conf. Ser. 4: The Extragalactic Distance Scale. p.257
- (24) Huchtmeier, W.K., & Richter, O.-G. 1988, A&A, 203, 237 (HHK)
- (25) Huchtmeier, W.K., Hopp, U., & Kuhn, B. 1997, A&A, 319, 67
- (26) Izotov, Y.I., & Guseva, N.G., 1989, Astrofizika, 30, 564
- (27) Izotov, Y.I., Guseva, N.G., Lipovetsky, V.A., et al. 1993a, Astr. & Astrophys. Transact., 3, 179
- (28) Izotov, Y.I., Lipovetsky, V.A., Guseva, N.G., Kniazev, A.Y., & Stepanian, J.A. 1993b, in: The Feedback of Chemical Evolution on the Stellar Content of Galaxies. eds. D.Alloin & G.Stasinska, 127
- (29) Izotov, Y.I., Thuan, T.X., & Lipovetsky, V.A. 1997, ApJS, 108, 1
- (30) Karachentsev, I.D., & Makarov, D.I. 1996, AJ, 111, 794
- (31) Kauffmann, G., & Fairall, A. 1991, MNRAS, 248, 313
- (32) Klypin, A., Holtzman, J., Primack, J., & Regos, A. 1993, ApJ, 416, 1
- (33) Klypin, A., Hoffman, Y., Kravtsov,A., & Gottlöber, S. 2001, ApJ, submitted = astro-ph/0107104
- (34) Kniazev, A.Y., Pustilnik, S.A., Ugryumov, A.V., & Kniazeva, T.F. 2000, Astronomy Letters, 26, 163
- (35) Kniazev, A.Y. et al. 2002, in preparation
- (36) Lee, J.C., Salzer, J.J., Rosenberg, J.L., & Law, D.A. 2000, ApJ, 536, 584
- (37) Lindner, U., Einasto, J., Einasto, M., et al. 1995, A&A, 301, 329
- (38) Lindner, U., Einasto, M., Einasto, J., et al. 1996, A&A, 314, 1
- (39) Lipovetsky, V.A., Thuan, T.X., Richter, G. et al. 2002, in preparation
- (40) Ostriker, J. 1996, ARA&A, 31, 689
- (41) Papaderos, P., Loose, H.-H., Fricke, K.J., & Thuan, T.X. 1996, A&A, 314, 59
- (42) Peebles, P.J.E. 2001, ApJ, 557, 495
- (43) Pesch, P., & Sanduleak, N. 1983, ApJS, 51, 171
- (44) Popescu, C.C., Hopp, U., Hagen, H.-J., & Elsässer, H. 1996, A&AS, 116, 43
- (45) Popescu, C.C., Hopp, U., & Elsässer, H. 1997a, A&A, 325, 881
- (46) Popescu, C.C., Hopp, U., & Elsässer, H. 1997b, A&A, 328, 756
- (47) Popescu, C.C., Hopp, U., Hagen, H.J., & Elsässer, H. 1998, A&AS, 133, 13
- (48) Pustilnik, S.A., Ugryumov, A.V., & Lipovetsky, V.A. 1994, Astr.Astroph.Transact., 5, 75
- (49) Pustilnik, S.A., Ugryumov, A.V., Lipovetsky, V.A., Thuan, T.X., & Guseva N.G. 1995, ApJ, 443, 499
- (50) Pustilnik, S.A., Kniazev, A.Y., Lipovetsky, V.A., & Ugryumov, A.V. 2001, A&A, 373, 24
- (51) Pustilnik, S.A., Kniazev, A.Y., Ugryumov, A.V., et al. 2002, in preparation
- (52) Sage, L.J., Weistrop, D., Cruzen, S., & Kompe, C. 1997, AJ, 114, 1753
- (53) Salzer, J.J. 1989, ApJ, 347, 152
- (54) Salzer, J.J., Moody, J.W., Rosenberg, J.L., Gregory, S.A., & Newberry M.V. 1995, AJ, 109, 2376
- (55) Schneider, S.E., Helou, G., Salpeter, E.E., & Terzian, Y. 1986, AJ, 92, 742
- (56) Smoker, J.V., Davies, R.D., Axon, D.J., & Hummel, E. 2000, A&A, 361, 19
- (57) Staveley-Smith, L., Davies, R.D., & Kinman, T.D. 1992, MNRAS, 258, 334
- (58) Szomoru, A., van Gorkom, J.H., & Gregg, M.D. 1996a, AJ, 111, 2141
- (59) Szomoru, A., van Gorkom, J.H., Gregg, M.D. & Strauss, M.A. 1996b, AJ, 111, 2150
- (60) Thuan, T.X., Alimi, J.-M., Gott, J.R., & Schneider, S.E. 1991, ApJ, 370, 25
- (61) Thuan, T.X., Balkowski, C., & Van, J.T.T., editors, Physics of Nearby Galaxies. Nature or Nurture ? Editions Frontiéres, Gif-sur-Yvette, 1992, 540 pp.
- (62) Thuan, T.X., Lipovetsky, V.A., Martin, J.-M., & Pustilnik, S.A. 1999, A&AS, 139, 1
- (63) Tikhonov, N.A., Galazutdinova, O.A., & Drozdovsky, I.O. 2000, Astrofizika, 43, 503
- (64) Ugryumov, A.V., 1997, Ph.D.Thesis, Special Astrophysical Observatory RAS, Nizhnij Arkhyz
- (65) Ugryumov, A.V., Pustilnik, S.A., Lipovetsky, V.A., Izotov, Y.I., & Richter, G.M. 1998, A&AS, 131, 285
- (66) van Zee, L., Haynes, M.P., & Giovanelli, R. 1995, AJ, 103, 990
- (67) Vennik, J., Hopp, U., Kovachev, B., Kuhn, B., & Elsässer, H. 1996, A&AS, 117, 261
- (68) Weistrop, D., & Downes, R.A. 1988, ApJ, 331, 172
- (69) Weistrop, D., & Downes, R.A. 1991, AJ, 102, 1680
- (70) Weistrop, D. 1994, in: Violent Star Formation: from 30 Doradus to Quasars. Proc. of Workshop in Spain, ed. G.Tenorio-Tagle, et al., Cambridge, Cambridge Univ. Press, p. 100
- (71) White, S., & Frenk, C. 1991, ApJ, 379, 52
- (72) Young, C.K., & Currie, M.J. 1998, A&AS, 127, 367
- (73) Zwicky, F., Sargent, W. L. W., & Kowal, C. T. 1975, AJ, 80, 545