THE POPULATION OF FAINT OPTICALLY-SELECTED AGN AT 11affiliation: Based, in part, on data obtained at the W.M. Keck Observatory, which is operated as a scientific partnership among the California Institute of Technology, the University of California, and NASA, and was made possible by the generous financial support of the W.M. Keck Foundation.
Abstract
We discuss a sample of 29 AGN (16 narrow-lined and 13 broad-lined) discovered in a spectroscopic survey of star-forming Lyman-break galaxies (LBGs) at . Reaching apparent magnitudes of , the sample includes broad-lined AGN approximately 100 times less UV luminous than most surveys to date covering similar redshifts, and the first statistical sample of UV/optically selected narrow-lined AGN at high redshift. The fraction of objects in our survey with clear evidence for AGN activity is %. A substantial fraction, perhaps even most, of these objects would not have been detected in even the deepest existing X-ray surveys. We argue that these AGN are plausibly hosted by the equivalent of LBGs. The UV luminosities of the broad-lined AGN in the sample are compatible with Eddington-limited accretion onto black holes that satisfy the locally determined versus relation given estimates of the stellar masses of LBGs. The clustering properties of the AGN are compatible with their being hosted by objects similar to LBGs. The implied lifetime of the active AGN phase in LBGs, if it occurs some time during the active star-formation phase, is years.
1 INTRODUCTION
Until very recently, virtually all surveys for QSOs and AGN at high redshift have been geared toward the detection of relatively “extreme” and rare objects, ranging from UV excess or color selection of QSOs (e.g., Fan et al. 2001 ; Boyle et al. 2000; Warren, Hewett, & Osmer 1994) to the selection of objects by their extreme radio power (e.g., White et al. 2000; Dunlop & Peacock 1990, McCarthy 1993). These surveys have been quite successful because they make use of selection techniques that can be applied over large swaths of sky, and for which spectroscopic follow-up has proved straightforward and highly efficient due to the optical brightness of the sample. There are few constraints on broad-lined AGN drawn from the faint end of the UV/optical luminosity distribution (the faintest published survey is still that of Koo & Kron 1988, reaching the equivalent of at ); these fainter objects are expected to dominate the production of photons that, together with emission from young galaxies, maintain the ionization of the intergalactic medium at intermediate redshifts (). Thanks to results from the Chandra X-Ray Observatory (Mushotzky et al. 2000; Barger et al. 2001; Alexander et al. 2001), we are just beginning to learn about the high redshift () population of narrow-lined, obscured AGN of “type II”. These objects can be quite unobtrusive at the optical (rest-UV) or radio wavelengths used by most AGN surveys in the past. Despite their possible importance to the overall AGN demographics, only a handful has been identified to date (e.g., Stern et al. 2002a, Norman et al. 2002).
At the same time, a very strong case has been developed in the local universe for a tight correlation between the properties of the stellar populations in bulges and spheroids and the mass of central black holes (e.g., Kormendy & Richstone 1995, Magorrian et al. 1998, Merritt & Ferrarese 2001). The presence of this correlation over a very wide range of mass scale strongly suggests that the formation of the spheroid stellar populations and the central black hole are causally linked. One might then reasonably expect that the era during which the spheroid stars were formed might also be that during which the black holes were most likely to be accreting material from gas-rich environs. The “quasar era” is now known to be rather strongly peaked near , declining rapidly at both higher and lower redshifts (e.g., Boyle et al. 2000; Warren, Hewett, & Osmer 1994; Schmidt, Schneider, & Gunn 1995; Kennefick, Djorgovski, & de Carvalho 1995; Fan et al. 2001; Shaver et al. 1999). Since it is now possible to routinely observe star-forming galaxies near the peak of the “quasar era”, there is the opportunity to assess the level of AGN activity that is ongoing as the galaxies are undergoing rapid star formation.
In this paper, we present some initial results on the AGN component of a moderately large spectroscopic survey for galaxies selected by their large unobscured star formation rates at redshifts . The survey should contain all but the most heavily obscured star forming galaxies at such redshifts (Adelberger & Steidel 2000), and as we detail below, is well-suited for detecting active accretion power in the same star forming objects because of the selection criteria used and the large number of spectra obtained. For the first time at high redshift, it may be possible to assess the fraction of rapidly star forming galaxies that are simultaneously playing host to significant accretion power. In any case, the survey has uncovered a relatively large number of UV-selected, relatively faint, broad-lined and narrow-lined AGN, whose properties we summarize.
We assume a cosmology with , , and throughout.
2 THE AGN SAMPLE
2.1 General Properties and Sample Definitions
The full LBG survey consists of 16 independent fields covering a total of 0.38 square degrees. The effective volume covered by a color-selected survey depends in a relatively complex way on the color, magnitude, and redshift of objects in the targeted sample (Steidel et al. 1999; Adelberger 2002). We have presented some of the details of the LBG selection function in Steidel et al. 1999; the AGN described in this paper satisfied precisely the same photometric criteria as the star forming galaxies in the sample. The complete details of the LBG photometric and spectroscopic survey will be presented in Steidel et al. 2002 (in preparation); here we concentrate on the small sub-sample for which there is spectroscopic evidence for the presence of AGN.
At redshifts , the distinctive colors of Lyman break objects depend largely on properties of the intervening intergalactic medium (IGM) where the mean free path of photons shortward of 912 Å in the rest frame is short, resulting in a pronounced drop in flux in the observed band even for objects whose spectra do not have intrinsic breaks at the Lyman limit (e.g., Madau 1995, Steidel & Hamilton 1993). Because objects in the spectroscopic sample were selected without regard to morphology (i.e., no attempt was made to remove point sources from the catalog), we expect that our spectroscopic sample should be at least as complete for objects dominated by non-stellar emission as compared to normal star forming galaxies.
The complete catalog of LBG candidates in the survey fields consists of 2440 objects in the apparent magnitude range . Simulations suggest that only % of objects with LBG-like intrinsic colors at will be included in our color-selected photometric catalogs due to various sources of incompleteness (Steidel et al. 1999). While we attempted to obtain uniform data in each field, variations in Galactic extinction, seeing, sky brightness, and integration time would require each field to be treated independently in a proper evaluation of completeness. Over the full survey, we spectroscopically observed a total of 1344 objects (55% of the photometric sample), of which 51 are identified as Galactic stars, 988 are high redshift objects with , and 306 remain unidentified. We classified an object as a broad-lined AGN if its spectrum contained any emission line with FWHM km s-1. Such objects always contained several broad emission lines, usually at least Lyman NV, Si IV , C IV , and C III] . Of the 13 broad-lined AGN identified, two show evidence for “associated” broad absorption lines of high ionization species such as O VI, N V, Si IV, and C IV. Objects were classified as narrow-lined AGN if their strong Lyman emission was accompanied by significant emission in C IV and if no emission line had FWHM km s-1. These objects usually had He II and C III] , and often detectable N V and O VI . Given the quality of the typical LBG survey spectrum, the narrow C IV emission line would have to exceed equivalent widths of a few Å in the rest frame, or line fluxes of ergs s-1 cm-2, to have been recognized.
The coarse properties of the two AGN samples are summarized in Table 1.
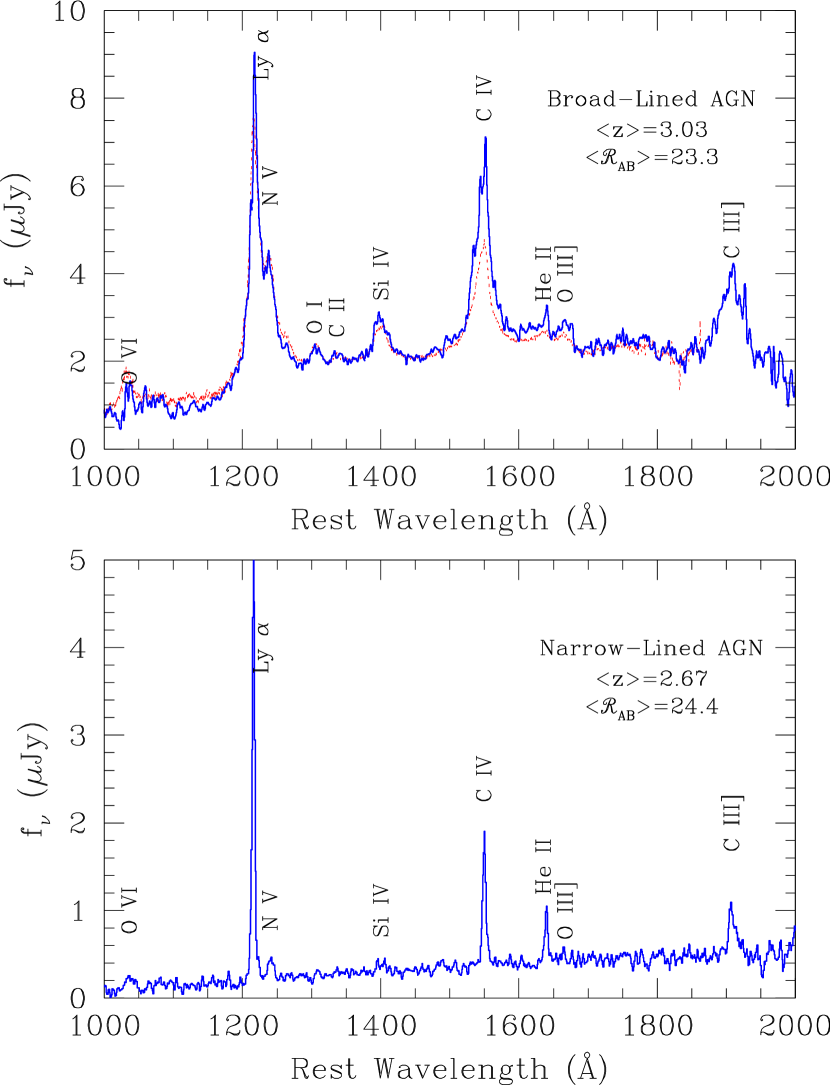
The composite spectra of both classes of AGN, formed by shifting each spectrum into the rest frame based on the emission line redshift, normalizing by the median continuum level in the rest-frame 1600-1800 Å range, and averaging, are shown in figure 1. The top panel of figure 1 also shows for comparison the composite spectrum of much brighter QSOs (typically , from Sargent, Steidel, & Boksenberg 1989 and Stengler-Larrea et al. 1995) that would satisfy the same LBG color selection criteria. We note the striking similarity of the two QSO samples, which are separated by a factor of in UV luminosity. There is clear evidence for the Baldwin (1977) effect in the increasing strength of the C IV emission line with decreasing continuum luminosity, and the faint QSO composite has a much more prominent narrow He II emission line.
Our definition of a narrow-lined AGN, based on the detected presence of high ionization emission lines, is admittedly somewhat arbitrary; however, it relies on the fact that the vast majority of LBGs show no detectable emission in C IV and He II even when Lyman emission is strong, and that it is difficult to produce significant nebular lines of these high ionization species without the hard ionizing spectrum of an AGN component. The line ratios observed among the objects identified as narrow-lined AGN are quite similar to those of local Seyfert 2 galaxies–in fact, for the composite spectrum shown in the bottom panel of figure 1, the Lyman /C IV and Lyman /C III] ratio are essentially identical to a composite Seyfert 2 spectrum presented by Ferland & Osterbrock (1986). The composite narrow-lined AGN spectrum is also strikingly similar, in both continuum and emission line properties, to the composite spectrum of high redshift radio galaxies (from Stern et al. 1999)
A separate, but related, issue is how the narrow-lined, UV–selected AGN fit in with the so-called “type II” QSOs discovered recently in deep Chandra images. The optical spectra of faint X-ray sources detected with Chandra are quite diverse, ranging from broad-lined AGN to objects without clear UV/optical indicators of the presence of AGN (e.g., Barger et al. 2001, Hornschemeier et al. 2001, Mushotzky 2002 and references therein). However, for the relatively small number of published spectra of identified Chandra sources at , every one would have satisfied either our “broad-lined” or “narrow-lined” AGN criteria. In particular, the spectra of the 2 published “type II” QSOs at high redshift (Stern et al. 2002a, Norman et al. 2002) both resemble our faint optically selected narrow-lined AGN spectra in their UV emission line properties. As discussed below, at present there is only limited information on the X-ray emission from objects in the optically selected samples. Clearly, optical/UV selection of AGN will impose different selection criteria than X-ray selection, and there may well be strong X-ray emitting AGN at that would either not be detected at all in the rest-UV, or not be recognizable as AGN from their UV spectra, because of heavy obscuration. Similarly, because of greater absolute sensitivity in the UV and widely varying UV/X-ray flux ratios (for whatever reason), it may be that faint AGN selection in the UV can identify objects whose X-ray fluxes are still beyond the deepest Chandra integrations. We discuss this issue further in §3.
2.2 Estimates of Internal Completeness of the AGN Sub-Sample
While a more detailed analysis of the AGN selection function and a derivation of the UV luminosity function of faint AGN are deferred to another paper (Hunt et al. 2002, in preparation), here we make some approximate statements on the completeness of our spectroscopic AGN sample. When we could not determine a redshift from a spectrum we had obtained, it was usually due to an absence of emission lines and inadequate continuum signal to measure the relatively weak absorption lines which help establish redshifts for a large fraction of our galaxy sample. Since every AGN in our sample has several strong emission lines (including strong Lyman emission), it is unlikely that an AGN with UV-detectable features in the target redshift range would not have been recognized even in spectra of much lower than average quality. We can estimate an upper limit on the number of unrecognized narrow-lined AGN (for reasons of inadequate S/N in the spectra) among those objects identified as normal star-forming galaxies by examining high S/N composite spectra of the LBGs (with identified AGN excluded). The average intensity of C IV emission in the narrow-lined AGN sample is that of Lyman (see figure 1). If we assume that this ratio is characteristic of narrow-lined AGN that we failed to flag as such, and we use the fact that the intensity ratio of Lyman to C IV emission in the spectral composite of non-AGN LBGs is for the quartile of the LBG sample having the strongest Lyman emission strength111This is the only sub-sample of the LBGs that has a mean Lyman equivalent width close to that of the AGN, then an upper limit on the fraction of AGN-like spectra to have contributed to that sub-sample is %. The corresponding limit on the fractional contribution of unrecognized AGN to the full LBG sample would then be %. The true fraction with unrecognized AGN-like spectra is likely to be smaller than this limit, since in most individual spectra we could have recognized C IV emission at the level seen in the composite AGN spectrum, and because low-level C IV emission (part of which is due to the stellar P-cygni feature) is expected in the rapidly star forming galaxies even without AGN excitation.
Thus, we expect that, with respect to the photometric LBG sample, the spectroscopic AGN sample is close to % complete, i.e., that any AGN in the LBG photometric sample that was attempted spectroscopically would have yielded a redshift. We estimate that our present spectroscopic AGN sample contains only % of the AGN in our fields with and satisfying our photometric criteria , , and (i.e., the spectroscopic completeness of 0.55 times the estimated photometric completeness of %). The mean redshift of the narrow-lined AGN in our sample is somewhat different from that of the galaxies, probably due to a combination of the subtleties of how the emission lines have affected the broad–band photometry and the redder continuum color (see below). The broad-lined AGN completeness within the photometric sample is expected to be smaller than that of galaxies at a given redshift and apparent magnitude because, at , only about 60% of (bright) QSO spectra have intervening optically thick Lyman limit systems at high enough redshift to produce the distinctive UV color that we depend on to identify them (see Sargent et al. 1989). Galaxies do not suffer this form of incompleteness because they are expected to have significant intrinsic Lyman limits from a combination of stellar spectral energy distributions and opacity to their own Lyman continuum radiation from the interstellar medium222We cannot rule out the possibility that faint broad-lined AGN are subject to increased internal Lyman continuum opacity compared to the bright QSOs that have been studied to date; however, the absence of detectable interstellar absorption lines in the composite broad-lined QSO spectrum does suggest that the typical H I column density within the host galaxies along our line of sight is significantly smaller than that for typical LBGs.. Again, a careful treatment of these effects is deferred to Hunt et al. 2002, but this additional source of incompleteness for broad-lined AGN is likely to be of roughly the same order as the spectroscopic advantage which AGN enjoy when they are observed.
With these caveats in mind, a reasonable estimate of the fraction of AGN among objects in our LBG sample is approximately the same as the fraction of AGN within the spectroscopically confirmed sample: , or %. This number would increase to % allowing for the maximal incompleteness of the narrow-lined sample discussed above. The observed ratio of narrow-lined to broad-lined AGN, , is consistent with the ratio of broad-lined and narrow-lined radio-loud AGN found by Willott et al. 2000, although we emphasize that our numbers are not yet corrected for relative incompleteness.
3 X-Ray Properties of Optically Faint AGN at
At present, there is only a small amount of information on the X-ray properties of the optically faint AGN in our sample. A cross-correlation of our LBG survey with the 1 Msec exposure of the Chandra Deep Field North (the HDF North region) yields X-ray detections for 4 of the 148 candidates333None of these objects is detected in the radio continuum with the VLA (Nandra et al. 2002) () in an arc minutes field centered on the deep HST pointing (Nandra et al. 2002). Of these, two have not yet been observed spectroscopically. The other two are a faint broad-lined AGN with and (HDF-oC34J123633.4621418), and a narrow-lined AGN with and (HDF-MMD12J123719.9620955). Both of these AGN have rest-frame 2–10 keV luminosities (uncorrected for intrinsic absorption) of ergs s-1. Our spectroscopic Lyman break galaxy sample also contains a clear narrow-lined AGN spectrum, shown in figure 2, that is undetected in the deep Chandra image and thus has an unobscured X-ray luminosity of ergs s-1 in the 2-10 keV band. Thus, while we expect that a large fraction of the optically faint AGN in our sample would be detected in the deepest Chandra exposures, there is likely also to be a sub-sample that is relatively X-ray faint that would not be detected in even the deepest X-ray pointings to date. Given the overall completeness estimate of % discussed above, we expect optically faint () AGN (of which would be broad-lined objects) over a redshift interval of near per 17 by 17 Chandra ACIS field 444The number 20 is just AGN per square degree. We note, however, that the region in which 4 LBGs were directly detected with Chandra was only % of the full Chandra field of view.. Ostensibly this number is significantly larger than the number of AGN (in a similar redshift range) identified with Chandra sources in the deep fields (e.g., Barger et al. 2001, Hornschemeier et al 2001, Stern et al 2002b, Crawford et al. 2002), although the numbers are small and the follow-up of optically faint Chandra sources is still underway. More complete surveys of both Chandra sources and faint optically–selected AGN in the same fields will significantly improve our understanding of the overall AGN demographics at high redshift.
4 Are LBGs the hosts of the optically faint AGN?
It would be interesting in the context of understanding the history and efficiency of accretion-powered luminosity in galaxies if one could verify that the AGN in the sample are hosted by the equivalent of LBGs.555Analysis of HST images of the host galaxies of a small sample of radio quiet QSOs by Ridgway et al. (2001) indicates that the hosts are consistent with the luminosities and morphologies of LBGs. The range of continuum apparent magnitudes (i.e., the lack of objects brighter than ) of the narrow-lined AGN in the spectroscopic sample is similar to that of the non-AGN LBGs in the sample (table 1). The strength of the few interstellar absorption lines that are not strongly masked by emission lines in the composite narrow-lined AGN spectrum are quite similar to those of a composite spectrum of non-AGN LBGs with Lyman seen in emission (see figure 3). Unfortunately, the strongest stellar feature in the spectra of LBGs is the C IV P-Cygni profile, which is badly affected by C IV emission in the composite narrow-lined AGN spectrum. We cannot say with certainty whether the continuum light of the narrow-lined AGN is produced by stellar or non-stellar emission– making this distinction is notoriously difficult even for nearby Seyfert galaxies (e.g., Gonzalez-Delgado et al. 1998). However, the far-UV continuum slope (, where ) of the composite narrow-lined AGN is redder than all but % of the LBG sample, and is much redder than the subsample of LBGs with similarly strong Lyman emission, as illustrated in figure 3. If the continuum were attributed to starlight in the same manner as other LBGs then the implied extinction would be a factor of (Adelberger & Steidel 2000). At this time, only one of the narrow-lined AGN has been observed in the K band, HDF-oMD49 (see figure 2). This object has , making it the third-reddest LBG in the observed sample of 118 (Shapley et al. 2001).
The brightest broad-lined object in the sample is more than 2 magnitudes brighter than the brightest narrow-lined object, and there are 5 broad-lined AGN brighter than the brightest narrow-lined AGN. There is some evidence for a flatter magnitude distribution for the broad-lined AGN than for the narrow-lined AGN, but small number statistics and numerous possible selection effects prevent us from making too much of this trend at this time. The relative absence of very UV-bright narrow-lined AGN is at least qualitatively consistent with the possibility that much of the AGN-produced UV continuum is obscured. There is considerable overlap between our survey fields and planned deep surveys with the Space Infrared Telescope Facility (SIRTF), so that it should soon be possible to measure many of these optically selected AGN at mid-IR wavelengths, where any bolometrically luminous obscured AGN are expected to be quite prominent.
Assuming that the broad-lined AGN are the less-obscured versions of similar AGN activity, let us suppose for the sake of argument that the mass of putative LBG black holes scales with stellar bulge mass according to the relation established locally, (e.g., Ho 1999). Adopting the range of inferred stellar masses of LBGs in our survey from Shapley et al. 2001, we expect typical black hole masses of M☉ and a range from to perhaps M☉. If these black holes were radiating at the Eddington limit, they would be expected to have observed666 Here we assume a radiative efficiency of for the accretion and that is a reasonable approximation to the bolometric luminosity. , close to the observed range (for the broad-lined AGN) of . Apparently, LBGs would be capable of hosting broad-lined AGN with the range of observed UV luminosities.
A more quantitative test of whether the AGN and the LBGs share the same host dark matter halos comes from an evaluation of the clustering statistics of the AGN with respect to LBGs. We have performed tests, using methods similar to those outlined in Adelberger et al. 2002, of the density of LBGs around AGN as compared to that of other (non-AGN) LBGs. Evaluated on scales and arc minutes, we find that the density of LBGs in the vicinity of narrow-lined AGN is times the density of LBGs around other LBGs. The density of LBGs around broad-lined AGN is times higher than the density of LBGs around other LBGs. These crude tests suggest that the narrow-lined AGN cluster very similarly to non-AGN LBGs, and that broad-lined AGN may be more strongly clustered than typical LBGs. A more in-depth treatment of these issues will be presented in Hunt et al. 2002.
In any case, it seems plausible that the observed AGN may be hosted by the equivalent of LBGs. If this is indeed the case, the fraction of LBGs in which obvious AGN activity is present may provide a rough timescale for near-Eddington accretion rates onto central black holes, as follows. The characteristic timescale for star formation episodes in LBGs is estimated to be Myr, inferred from the modeling of the far-UV to optical (rest-frame) colors (Shapley et al. 2001; Papovich, Dickinson, & Ferguson 2001). If the 3% AGN activity reflects the duty cycle of significant black hole accretion in LBGs, it would imply an active accretion timescale of years, broadly consistent with the expected black hole masses given the implied Eddington mass accretion rate of M☉ yr-1. AGN lifetimes of this order have been inferred from theoretical studies of black hole growth based on mergers in hierarchical models of structure formation (e.g. Kauffmann & Haehnelt 2000) and from consideration of the QSO luminosity functions and the distribution of black hole masses in the local universe (e.g., Haehnelt et al. 1998, Yu & Tremaine 2002). Significantly longer accretion timescales of Myr have been suggested by Barger et al. (2001) based on the observation that of “ galaxies at all redshifts” are X-ray sources, but such timescales may refer to a very different, more protracted process of sub-Eddington accretion onto black holes in well-formed galaxies primarily at .
5 Discussion
While we defer more quantitative statements to a future paper, there are several statements we can make that are unlikely to change after more careful modeling of incompleteness. First, narrow-lined AGN that are identifiable optically using LBG color selection criteria are quite common, with a space density (at ) times larger than that of the spectroscopically–similar high redshift radio galaxies (cf. Willott et al. 2001). The implied surface density of AGN per square degree per unit redshift at reaches . It is still uncertain, due to small number statistics and incomplete surveys, what fraction of this number would also be Chandra sources that may contribute significantly to the X-ray background777About half of the narrow-lined AGN in our sample would be classified as “optically faint”, defined by Alexander et al. 2001 to be objects with , or .. Nevertheless, we can say with some confidence that narrow-lined AGN make a negligible contribution to the UV background: the total Å luminosity of narrow-lined AGN in our sample is only % that contributed by the broad-lined AGN, and % of that contributed by non-AGN LBGs. We do not know the narrow-lined AGN contribution to the ionizing UV background, but it is likely to be far smaller than 20% of the broad-lined AGN background judging by the red continuum colors and the expectation that the objects are fairly heavily obscured.
Using currently accepted parameterizations of the QSO luminosity function (Pei 1995), % of the AGN-produced ionizing radiation field would come from QSOs that have apparent magnitudes in the range , and only % comes from brighter QSOs. Thus, while our sample of broad-lined AGN is fairly small, it extends far deeper than existing QSO surveys888 The faintest broad-lined AGN in our sample are considerably fainter than the traditional dividing line between QSOs and Seyfert 1 nuclei of . This absolute magnitude, for the adopted cosmology, corresponds to ., allowing for the first time a direct measurement of the AGN contribution to the ionizing radiation field at high redshift. While it is possible that star formation in LBGs may dominate the production of Lyman continuum photons at (Steidel, Pettini, & Adelberger 2001), broad-lined AGN such as those in our faint sample almost certainly provide a substantial fraction of the higher energy photons which apparently reionized He II near . An accurate measurement of the AGN ionizing photon production requires careful attention to issues of photometric and spectroscopic completeness, which will be presented in Hunt et al. 2002 (in preparation).
CCS, MPH, and AES have been supported by grant AST-0070773 from the U.S. National Science Foundation and by the David and Lucile Packard Foundation. KLA acknowledges support from the Harvard Society of Fellows. We thank Daniel Stern for providing the composite radio galaxy spectrum, and for useful comments on an early draft. Useful conversations with Paul Nandra and Aaron Barth are also acknowledged.
References
- (1) Adelberger, K.L, Steidel, C.C., Shapley, A.E., & Pettini, M. 2002, ApJ, submitted
- (2) Adelberger, K.L. 2002, Ph.D. thesis, California Institute of Technology
- (3) Adelberger, K.L, & Steidel, C.C. 2000, ApJ, 544, 218
- (4) Alexander, D.M., Brandt, W.N., Hornschemeier, A.E., Garmire, G.P., Bauer, F.E., Griffiths, R.E. 2001, AJ, 122, 2156
- (5) Baldwin, J.A. 1977, ApJ, 214, 679
- (6) Barger, A.J., Cowie, L.L., Mushotzky, R.F., & Richards, E.A. 2001, AJ, 121, 662
- (7) Barger, A.J., Cowie, L.L., Bautz, M.W., Brandt, W.N., Garmire, G.P., Hornschemeier, A.E., Ivison, R.J., & Owen, F.N. 2001, AJ, 122, 2177
- (8) Boyle, B.J., Shanks, T., Croom, S.M., Smith, R.J., Miller, L., Loaring, N., & Heymans, C. 2000, MNRAS, 317,1014
- (9) Crawford, C.S., Gandhi, P., Fabian, A.C., Wilman, R.J., Johnstone, R.M., Barger, A.J., & Cowie, L.L. 2002, MNRAS, in press (astro-ph/0106067).
- (10) Dunlop, J.S., & Peacock, J.A. 1990, MNRAS, 247, 1990
- (11) Ferland, G.J., & Osterbrok, D.E. 1986, ApJ, 300, 658
- (12) Fan, X., et al. 2001, AJ, 121, 54
- (13) Gonzalez-Delgado, R., Heckman, T.M., Leitherer, K., Meurer, G., Krolik, J., Wilson, A., Kinney, A., & Koratkar, A. 1998, ApJ, 505, 174
- (14) Haehnelt, Natarajan, & Rees 1998, MNRAS, 300, 817
- (15) Ho, L.C., in ‘Observational Evidence for Black Holes in the Universe’, ed. S.K. Chakrabarti (Dordrecht: Kluwer), 153
- (16) Hornschemeier, A.E. et al 2001, ApJ, 742,777
- (17) Kauffmann, G., & Haehnelt, M. 2000, MNRAS, 311, 588
- (18) Kennefick, Djorgovski, & de Carvalho 1995, AJ, 110, 2553
- (19) Koo, D.C., & Kron, R.G., ApJ, 325, 92
- (20) Kormendy, J., & Richstone, D. 1995, ARAA, 33, 581
- (21) Madau, P. 1995, ApJ, 441, 18
- (22) Magorrian, J., et al. 1998, AJ, 115, 2285
- (23) McCarthy, P.J. 1993, ARAA, 31, 639
- (24) Merritt, D., & Ferrarese, L. 2001, MNRAS, 320, L30
- (25) Mushotzky, R.F. 2002, in New Views of the X-ray Universe in the XMM-Newton and Chandra Era, in press (astro-ph/0203310)
- (26) Mushotzky, R.F., Cowie, L.L., Barger, A.J., Arnaud, K.A. 2000, Nature, 101, 159
- (27) Nandra, K., Mushotzky, R.F., Arnaud, K., Steidel, C.C., Adelberger, K.L., Gardner, J.P., Teplitz, H.I., & Windhorst, R.A. 2002, ApJ, submitted
- (28) Norman, C.A., et al. 2002, ApJ, in press (astro-ph/0103198)
- (29) Papovich, C., Dickinson, M., & Ferguson, H.C. 2001, ApJ, 559, 620
- (30) Pei, Y.C. 1995, ApJ, 438, 623
- (31) Ridgway, S.E., Heckman, T.M., Calzetti, D., & Lehnert, M. 2001, ApJ, 550, 122
- (32) Sargent, W.L.W., Steidel, C.C., & Boksenberg, A. 1989, ApJS, 69, 703
- (33) Schmidt, M., Schneider, D.P., & Gunn, J.E. 1995, AJ, 110, 68
- (34) Shapley, A.E., Steidel, C.C., Adelberger, K.L., Dickinson, M., Giavalisco, M., & Pettini, M. 2001, ApJ, 562, 95
- (35) Shapley, A.E., Steidel, C.C., Adelberger, K.L., & Pettini, M. 2002, in ’A New Era in Cosmology’, in press (astro-ph/0112262)
- (36) Shapley, A.E., Steidel, C.C., Adelberger, K.L., Dickinson, M., Giavalisco, M., & Pettini, M. 2001, ApJ, 562, 95
- (37) Shaver, P.A., Hook, I.M., Jackson, C.A., Wall, J.V., & Kellermann, K.I. 1999, in Highly Redshifted Radio Lines, ASP Conf Series Vol 156, eds. C.L. Carilli, S.J.E. Radford, K.M. Menten, & G.I. Langston, 163
- (38) Steidel, C.C., Pettini, M., & Adelberger, K.L. 2001, ApJ, 546, 665
- (39) Steidel, C.C., Adelberger, K.L., Giavalisco, M., Dickinson, M., & Pettini, M. 1999, ApJ, 519, 1
- (40) Steidel, C.C., & Hamilton, D. 1993, AJ, 105, 2017
- (41) Stengler-Larrea, E.A., et al. 1995, ApJ, 444, 64
- (42) Stern, D., et al. 2002a, ApJ, in press (astro-ph/0111513)
- (43) Stern, D., et al 2002b, AJ, in press (astro-ph/0203392)
- (44) Stern, D., Dey, A., Spinrad, H., Maxfield, L., Dickinson, M., Schlegel, D., & Gonzalez, R.A. 1999, AJ, 117, 1122
- (45) Warren, S.J., Hewett, P., & Osmer, P.S. 1994, ApJ, 421, 412
- (46) White, R.L., et al 2000, ApJS, 126, 133
- (47) Willott, C.J., Rawlings, S., Blundell, K.M., Lacy, M., & Eales, S.A. 2001, MNRAS, 322, 536
- (48) Willott, C.J., Rawlings, S., Blundell, K.M., & Lacy, M. 2000, MNRAS, 316, 449
- (49) Yu, Q., & Tremaine, S. 2002, MNRAS, submitted (astro-ph/0203082).
| Broad-Lined | Narrow-Lined | LBGsaaExcluding objects identified as AGN. | |
|---|---|---|---|
| Number | 13 | 16 | 959 |
| bbMean AB magnitude at an effective wavelength of 6830 Å or Å in the rest frame at . | |||
| Range |