What Causes P-mode Asymmetry Reversal?
Abstract
The solar acoustic p-mode line profiles are asymmetric. Velocity spectra have more power on the low-frequency sides, whereas intensity profiles show the opposite sense of asymmetry. Numerical simulations of the upper convection zone have resonant p-modes with the same asymmetries and asymmetry reversal as the observed modes. The temperature and velocity power spectra at optical depth have the opposite asymmetry as is observed for the intensity and velocity spectra. At a fixed geometrical depth, corresponding to , however, the temperature and velocity spectra have the same asymmetry. This indicates that the asymmetry reversal is produced by radiative transfer effects and not by correlated noise.
1 Introduction
For almost a decade, it has been known that the power spectra of solar acoustic modes are asymmetric, velocity has more power on the low frequency side and intensity has more power on the high frequency side of the power maxima (e.g. Duvall et al., 1993). The asymmetry reversal between velocity and intensity is thought to be due to the correlated background noise contribution to the intensity power spectra (Nigam et al. 1998). It is debated whether the asymmetry reversal occurs in velocity (Roxburgh & Vorontsov, 1997) or intensity (Nigam et al., 1998) or both (Kumar & Basu, 1999). Theoretical models predict asymmetries that depend on the source depth and type (Kumar & Basu, 1999; Georgobiani et al., 2000b). Roxburgh & Vorontsov (1997) considered the superposition of dipole and quadrupole sources; Nigam et al. (1998) used a combination of monopole and dipole terms; Kumar & Basu (1999) show that the asymmetry reversal could be triggered even by dipole or quadrupole sources alone.
Simulations of the shallow upper layer of the solar convective zone have resonant acoustic modes like the Sun. The emergent intensity and the velocity in the photosphere have asymmetric spectra with the opposite asymmetry (Georgobiani et al., 2000a). In this letter we calculate the temperature and velocity power spectra at the continuum optical depth and at the geometrical depth corresponding to . At unit continuum optical depth the velocity and temperature have opposite asymmetry, with the velocity having more low-frequency power and the intensity more high frequency power. At fixed geometrical depth, however, the velocity and temperature have the same asymmetry, more low frequency power, for the fundamental mode. These results indicate that the asymmetry reversal is caused by radiative transfer effects, and not by correlated noise.
2 Model of the Solar Convection
We use a three - dimensional hydrodynamic code of Stein & Nordlund (1998, and references therein) to simulate the upper layers of the solar convection zone. The computational domain covers 6 Mm by 6 Mm horizontally and 3 Mm in vertical direction, from 0.5 Mm above the surface to 2.5 Mm beneath it. The model includes non-gray, LTE radiative transfer. Horizontal boundaries are periodic, while vertical ones are transmitting. The spatial resolution is 100 km horizontally and 50 km vertically, with a finer grid interpolated for solving the radiative transfer equation. The radiation field is calculated by solving the Feautrier equation along a vertical and 4 straight inclined rays, after averaging the Planck function into four bins by wavelength sorted according to opacity (cf Nordlund, 1982; Nordlund & Stein, 1990, 1991). Snapshots are saved at 30 s intervals. We have simulated 43 hours of solar time.
3 Calculation of Power Spectra and Phase Relations
We compare power spectra of intensity, temperature and velocity in order to shed light on a cause of the p-mode line profile asymmetry and its reversal between velocity and intensity. From our simulations, we have coordinate- and time-dependent quantities: vertical velocity , temperature , emergent intensity , etc. To obtain a power spectrum at a particular geometrical depth , we use and at . To obtain and at a particular optical depth, say, , we calculate and interpolate V and T to the height at which for each position and time . We choose to be the depth for which . Clearly, or at a geometrical depth will not be the same as or at : we see deeper in the cooler intergranular lanes compared to the hotter granules. We investigate if this makes a difference in the power spectra and somehow affects line asymmetries.
We separate the oscillation modes into radial modes, for which we average our data horizontally, and nonradial modes, for which we multiply the data by the corresponding spatial sines or cosines and then average horizontally (for more details, see Georgobiani et al., 2000a). We then Fourier - transform these time strings to get power spectra and phase relations. In our simulations, the first nonradial mode (horizontal wavelength = 6 Mm) corresponds to a harmonic degree , because the simulation box represents a small fraction of the solar surface. We investigate the behavior of the emergent intensity, plasma temperature and plasma velocity for this first non-radial mode of the simulation (see also Georgobiani et al., 2000a).
4 Results
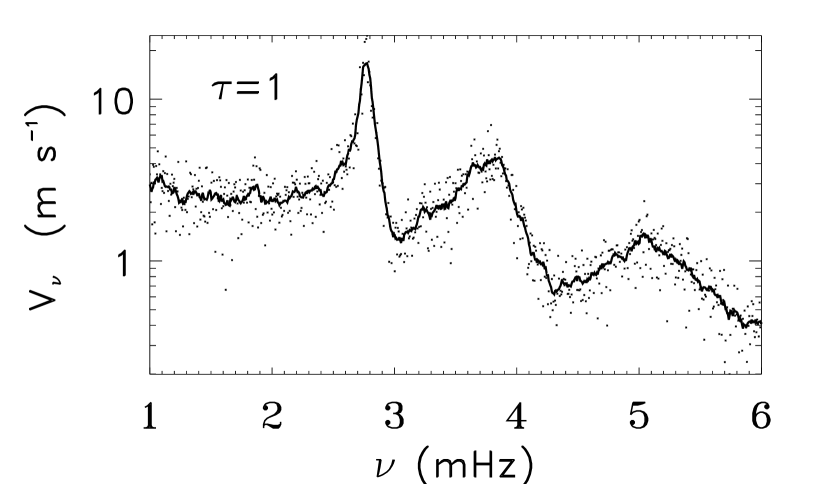
The emergent continuum intensity (Fig. 1) is a good measure of the plasma temperature at local instantaneous continuum optical depth unity, , as expected from the Eddington-Barbier relations. The temperature at has the same spectrum (Fig. 2) and phase (Fig. 3) as the emergent intensity. These phase differences are essentially zero for all frequencies. The spectra of the emergent intensity and plasma temperature at have opposite asymmetry to the plasma velocity (Fig. 4) as is observed (e.g. Duvall et al., 1993) and as was discussed by Georgobiani et al. (2000a). The spectrum of the temperature at fixed geometrical depth , corresponding to the average continuum optical depth unity, , (Fig. 5) is, however, rather different from its spectrum at local instantaneous unit optical depth (Fig. 2), with different asymmetries especially noticeable for the fundamental mode. The temperature at has the same asymmetry as the velocity.
5 Discussion
What changes the asymmetry of the temperature spectrum between measuring it at local and average ? We analyze the first non-radial fundamental mode that has the most prominent asymmetry and agrees closely with the corresponding solar mode. Figure 6 shows the velocity and temperature profile of this mode at average continuum optical depth one. It is clear that the velocity and temperature have the same profiles. Figure 7 shows the velocity and temperature profiles measured at local optical depth one, which is where one would see them. The velocity spectrum is hardly changed, but the amplitude of the temperature fluctuations is reduced by more than an order of magnitude. The high temperature sensitivity of the opacity obscures high temperature gas and alters the height at which the gas is observed. This reduces the magnitude of the observed temperature fluctuations, but this reduction is not as great on the high frequency side as on the low frequency side. Hence, the mode asymmetry is changed.
Why is the reduction of the temperature fluctuations different at high and low frequencies? At the fixed geometrical height , the temperature fluctuations were larger on the low frequency side of the mode. This produces a larger opacity variation on the low frequency side of the mode (Fig. 8), which in turn leads to a larger variation in the height where local (Fig. 9). The radiation temperature we see is equal to the gas temperature at optical depth unity, according to the Eddington-Barbier relations. The phases of temperature and height of unit optical depth are such that where the temperature at fixed geometrical depth is largest we observe the temperature at greatest height (smallest z) (Fig 10). Since the gas temperature is decreasing outward, the larger variation in the location where the radiation originates on the low frequency side of the mode leads to a smaller temperature variation there, while the smaller variation in the location where radiation originates on the high frequency side of the mode leads to a larger temperature variation there. We therefore observe a larger intensity variation on the high frequency side of the mode than on the low frequency side of the mode and thus the asymmetry is reversed from that observed in the velocity (and temperature when measured at a fixed geometrical depth).
6 Conclusion
We have found that the emergent intensity and the temperature spectra at local instantaneous optical depth unity have the opposite asymmetry to the velocity as is observed, while the temperature at fixed geometrical depth corresponding to average optical depth unity has the same asymmetry as the velocity. This indicates that radiation transfer plays a crucial role in the asymmetry reversal observed between the intensity and Doppler velocity, and that this reversal is not due solely to effects of correlated noise. The mode asymmetry has been shown to depend on the separation of observation location and source location for the case of a simple localized -function source (Kumar & Basu, 1999; Georgobiani et al., 2000b). T() and T() are observed at different heights. Oscillation induced opacity changes vary the location of radiation emission ( in a way that reduces the magnitude of the temperature fluctuations and reverses their asymmetry.
References
- Duvall et al. (1993) Duvall, T.L., Jr., Jefferies, S.M., Harvey, J.W., Osaki, Y., and Pomerantz, M. A. 1993, ApJ, 410, 829
- Georgobiani et al. (2000a) Georgobiani, D., Kosovichev, A.G., Nigam, R., Nordlund, Å., and Stein, R.F. 2000a, ApJ, 530, L139
- Georgobiani et al. (2000b) Georgobiani, D., Stein, R.F., Nordlund, Å. 2000b, in Proceedings of the SOHO 10/GONG 2000 Workshop, Helio- and Asteroseismology at the Dawn of the Millennium, ed. A. Wilson (Tenerife: Esa SP-464), 583
- Kumar & Basu (1999) Kumar, P., and Basu, S. 1999, ApJ, 519, 389
- Nigam et al. (1998) Nigam, R., Kosovichev, A.G., Scherrer, P.H., and Schou, J. 1998, ApJ, 495, L115
- Nordlund (1982) Nordlund, Å. 1982, A&A, 107, 1
- Nordlund & Stein (1990) Nordlund, Å., & Stein, R. F. 1990, Comp. Phys. Comm. 59, 119
- Nordlund & Stein (1991) Nordlund, Å., & Stein, R. F. 1991, NATO ASIC Proc. 341: Stellar Atmospheres - Beyond Classical Models, 263
- Roxburgh & Vorontsov (1997) Roxburgh, I.W., & Vorontsov, S.V. 1997, MNRAS, 292, L33
- Stein & Nordlund (1998) Stein, R. F., & Nordlund, Å. 1998, ApJ, 499, 914