The spectral index of the ionizing continuum of quasars
Abstract
The ionizing spectral energy distribution of quasars exhibits a steepening of the distribution short-ward of Å. The change of the power-law index from approximately to so far has been interpreted as being intrinsic to quasars. We study an alternative interpretation, in which a tenuous absorption screen is responsible for the change of index. We find that the most successful function of Hi with requires that the ionization fraction be independent of the metagalactic background radiation, that is frozen in. This implies that the putative component should be of sufficiently low density that it could not recombine (while the background is subsiding) and/or cool from a high temperature state.
keywords:
atomic processes — galaxies: intergalactic medium — galaxies: active — radiative transfer — ultraviolet: general0.1 Introduction
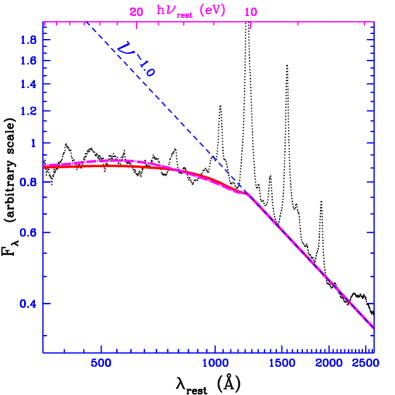
The ionizing spectral energy distribution (hereafter ISED) of nearby active galactic nuclei cannot be observed directly, due to the galactic absorption beyond the Lyman limit. Owing to the redshift effect, however, we can get a glimpse of the ISED from the spectra of very distant quasars. The pioneering work of Zheng et al. (1997, ZK97), using HST archived data, showed that the power-law index () steepens from for Å to at shorter wavelengths (combining radio-loud and radio-quiet quasars). Qualitatively similar results were found by Telfer et al. 2002 (hereafter TZ02), using a larger sample.
Korista, Ferland & Baldwin (1997) pointed out that such a steep slope for the ionizing continuum would imply an insufficient number of photons beyond eV to account for the observed luminosities of the high excitation emission lines.
We report preliminary results of a study aimed at finding an alternative explanation for the break, one that is extrinsic to the quasar spectral energy distribution. We postulate the existence of a very tenuous absorption gas component that pervades the universe, and proceed to study the characteristics it must possess to reproduce the observed break.
0.2 Procedure
The composite spectrum of ZK97 was constructed by merging 284 spectra of 101 quasars, taken with FOS of the Hubble telescope. The distribution in quasar redshifts allowed ZK97 to span the wavelength range of 310–3000 Å in the quasar rest-frame. Before merging their spectra, each spectrum was corrected for the Lyman valley and Ly forest absorption by calculating the appropriate transmission curve, using the scheme developed by Møller & Jakobsen (1990).
Our aim is to reproduce the steepening of the index by introducing a previously unknown intergalactic absorption component. We hereby investigate how such a component can reproduce the mean composite spectrum of ZK97. Given the exploratory nature of the exercise, we can either postulate the existence of a very tenuous but continuous gas component, or a large collection of very thin discrete clouds. At any rate, these two formalisms would provide an incomplete picture if the gas distribution resembled that of the Ly forest absorption gas (e.g. Davé et al. 1997). If the postulated component consisted of clumps, they must be sufficiently optically thin (and numerous) so that they do not show up as individually detectable Ly absorption lines in the archived FOS spectra, hence .
For definiteness, we adopt a uniform gas distribution. The spectra are divided in energy bins, and for each quasar rest-frame wavelength bin , we calculated the transmitted intensity by integrating the opacity along the line-of-sight to a quasar of redshift
| (1) |
where is the quasar rest-frame wavelength for bin and the intergalactic neutral hydrogen density. The summation was carried out over the different opacity sources: photoionization () and line absorption from the Lyman series of hydrogen (). Although our code could include up to 40 levels, we found that considering only the 10 lowest proved to be adequate. We adopted a fiducial velocity dispersion of 30 km/s and assumed a Gaussian profile for the of the lines.
0.3 Calculations
After various trial and error calculations, experimenting with many different functional forms for , we found that the following two distributions of Hi with redshift could reproduce the composite spectrum of ZK97 quite well :
where is the absorbing gas redshift, the quasar redshift, the quasar redshift as seen from the absorbing gas at [that is ] and is the parameterized photoionization rate coefficient (Haardt & Madau 1996) due to the metagalactic ionizing radiation but renormalized in such a way that :
The values of at zero redshift are and for (A) and (B), respectively. While the gas is photoionized by the metagalactic radiation in the case of (B), in (A) the neutral fraction is ‘frozen in’ since is absent. Other factors such as the dependence on in distribution (B), or the exponent of the factor (associated to its evolution during expansion of the Universe), are not superfluous but essential to the fit (and to the aim of reproducing the spectral index of beyond 900Å). Either distribution is quite successful in reproducing the break as shown in Fig. 1. We have assumed that the intrinsic quasar distribution exhibits no break and can be described by a single power-law at all the wavelengths of interest111A soft ISED with would appear as an horizontal line segment in a Log vs. Log plot such as Fig. 1.. Possible interpretations of either distribution are not straightforward, due to the presence of factors varying as . It could imply that the gas is anticorrelated with large baryonic mass accumulation (as represented by the quasars environment) and is presumably associated with the largest voids.
The way in which we simulate the theoretical calculation of a composite spectrum is by averaging many redshifted spectral distributions as explained in more detail in Binette et al. (2002). The spectrograph wavelength window was assumed to be 3000 Å to 1300 Å which we considered typical of the wavelength coverage of individual quasars by FOS. We redshifted this window in locked steps to cover the redshift span . Before averaging, each simulated quasar SED was multiplied by the redshift integrated transmission curve (c.f. Eqn. 1), taking into account the intervening gas described by the distribution (A) or (B). We assumed the concordance CDM cosmology with , and km/s/Mpc.
0.4 Results
The distribution (B), which takes the metagalactic background radiation into account, requires the insertion of the extra factor in order to fit the observed ISED. Otherwise, the simulated spectrum curves down much too steeply at the short wavelength end. Naively, one would prefer distribution (A) with frozen in ionization, since it is a simpler expression. A more convincing argument in favor of (A), however, is the behavior of the power-law index of the transmitted ISED in the wavelength range Å. This is shown in Fig. 2 as a function of the quasar redshift used in the transmission function. The distribution (B) shows a significant slope for while for (A) the variation is relatively small, confined to the interval .
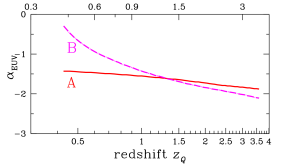
One of the interesting result of TZ02 (c.f. their Fig. 12) is that there is no global trend of as a function of redshift. The slope they found in their linear regression of vs. Log was and for the populations of radio-quiet and radio-loud quasars, respectively. Considering the large dispersion in the values measured, our slope of obtained by linear fit of the solid line in Fig. 2 cannot be ruled out (we considered radio-loud and radio-quiet quasars together), while that of distribution (B) is undoubtedly inconsistent (giving a linear fit slope of ) with the TZ02 results.
If we substitute by in distributions (A) or (B), the flattening observed in the composite spectrum can be reproduced although it gives rise to a significant dip at 1216 Å, which is not observed. Furthermore, the behavior of vs. becomes incompatible with the results of TZ02.
0.5 Discussion
The simpler distribution (A) is in better agreement with the available data and is marginally consistent with the study of by TZ02. Furthermore, it is not plagued by the two problems encountered by Binette et al. (2002), who explored different distributions of which relied on a long range proximity effect. Interestingly, a frozen in ionization for the proposed tenuous absorption component makes sense since it would be similar to that believed to occur in the Ly forest at high redshift.
The fact that the frozen in solution is favored is consistent with the tenuous absorption component being of sufficiently low density that it did not have time to recombine (as the background subsided) and/or cool from a high temperature state. If the proposed tenuous absorption component turned out to be valid, the problem of a too soft ISED as discussed by Korista, Ferland & Baldwin (1997) would go away since the favored intrinsic index of used here imply a hard ionizing spectrum in quasars.
Acknowledgements.
This work was supported by the Mexican science funding agency CONACyT under grant 32139-E. We are indebted to W. Zheng for sharing the original data presented in ZK97.References
- [Binette et al. ¡2002¿] Binette, L., Rodríguez-Martínez, M. & Ballinas, I. 2002, In: Rosado, M., Binette, L. & Arias, L. (eds.): Galaxies: the third dimension, ASP Conf. Series, in press (astro-ph/0205119)
- [Davé, Hernquist, Weinberg, & Katz ¡1997¿] Davé, R. Hernquist, L., Weinberg, D. H., & Katz, N. 1997, ApJ, 477, 21
- [Haardt & Madau ¡1996¿] Haardt, F. & Madau, P. 1996, ApJ, 461, 20
- [Korista et al. ¡1997¿] Korista, K., Ferland, G., & Baldwin, J. 1997, ApJ, 487, 555
- [Zheng et al. ¡1997¿] Zheng, W., Kriss, G. A., Telfer, R. C., Grimes, J. P. & Davidsen, A. F. 1997, ApJ, 475, 469 (ZK97)
- [Telfer et al. ¡2002¿] Telfer, R. C., Zheng, W., Kriss, G. A., & Davidsen, A. F. 2002, ApJ, 565, 773 (TZ02)