email: thomas.berghoefer@desy.de 22institutetext: Max-Planck-Institut für Extraterrestrische Physik, Giessenbachstr. 1, D-85740 Garching, Germany
email: breitsch@mpe.mpg.de
The origin of the young stellar population in the solar neighborhood — a link to the formation of the Local Bubble?
We have analyzed the trajectories of moving stellar groups in the solar neighborhood in an attempt to estimate the number of supernova explosions in our local environment during the past 20 million years. Using Hipparcos stellar distances and the results of kinematical analyses by Asiain et al. (1999a) on the Pleiades moving groups, we are able to show that subgroup B1, consisting of early type B stars up to , but lacking more massive objects, has passed through the local interstellar medium within less than 100 pc. Comparing the stellar content of B1 with the initial mass function derived from the analysis of galactic OB associations, we estimate the number of supernova explosions and find that about 20 supernovae must have occurred during the past million years, which is suggested to be the age of the Local Bubble; the age of the star cluster is about million years. For the first time, this provides strong evidence that the Local Bubble must have been created and shaped by multi-supernova explosions and presumably been reheated more than 1 million years ago, consistent with recent findings of an excess of in a deep ocean ferromanganese crust. Calculating similarity solutions of an expanding superbubble for time-dependent energy input, we show that the number of explosions is sufficient to explain the size of the Local Bubble. The present energy input rate is about erg/s, in good agreement with the estimated local soft X-ray photon output rate. It seems plausible that the origin of the Local Bubble is also linked to the formation of the Gould Belt, which originated about 30-60 Myrs ago.
Key Words.:
stars: early-type – ISM: bubbles – ISM: general – ISM: kinematics and dynamics– ISM: structure – (Galaxy:) solar neighborhood1 Introduction
Our solar system is embedded in a medium of low Hi column density (e.g. Frisch & York 1983) largely filled with hot plasma radiating in the soft X-rays (McCammon et al. 1983). The obvious anticorrelation between neutral gas and X-ray emitting plasma on large angular scales has been interpreted in terms of an elongated local hot cavity (Tanaka & Bleeker 1977, Sanders et al., 1977; Snowden et al., 1990) with an extension between 80 and 200 pc, now commonly known as the Local Bubble (LB). Recently, based on the spatial distribution of stellar EUV sources detected with EUVE and subsequent Nai absorption line studies (Sfeir et al. 1999), Welsh et al. (1999) suggested that the LB shows a “chimney like” structure with no definite border towards high Galactic latitude in the northern direction rather than a full bubble. Despite the detailed mappings of the LB and our knowledge about its morphology, its origin is still a mystery.
Although it has often been suggested that the LB is the result of one or more supernova (SN) explosions (Cox & Anderson 1982, Innes & Hartquist 1984), there is no direct evidence for this hypothesis. Unlike in the neighboring Loop I superbubble, with still ongoing star formation and about 40 SN explosions to occur in the future (Egger 1998), no obvious active cluster of early type stars resides inside the LB. Moreover, the analysis of the line of sight in the direction of the star CMa, which extends over 200 pc, seems to indicate that the cavity is not homogeneously filled with X-ray emitting plasma (Gry et al. 1985, Welsh et al. 1998) and a non-negligible part of the LB material must exist in a warm phase with a temperature of several 104 K. This rules out a LB formation by one single SN explosion since an expanding pressure driven remnant would always fill the cavity inside a swept-up shell.
On the other hand, there is also support for an isotropic nature of the LB emission, coming from EUVE observations of cloud shadows in the local ISM. Based on these observations, Berghöfer et al. (1998) found evidence that the pressure of the hot interstellar medium is the same in three different directions near the Galactic plane. Therefore, it seems appropriate to distinguish between the local cavity as the region largely devoid of Hi gas and the present day LB as the X-ray emitting region. These ambiguous observational results have consequently led to a variety of different ideas concerning the origin of the LB.
Some time ago the mysterious -ray source Geminga seemed to be the most promising candidate for a recent nearby SN explosion, after having been identified with an X-ray millisecond pulsar (Gehrels & Chen, 1993). However, HST observations have provided a parallactic distance of pc (Caraveo et al., 1996). Therefore, due to its high proper motion, Geminga most probably originated yr ago in the Orion region and is thus not related to the present day EUV and soft X-ray emission of the LB.
In another scenario, the superbubble picture of the LB is disputed, and the LB is conceived as being related to a local interarm region between the Sagittarius and the Perseus spiral arms of the Galaxy (Bochkarev 1987; Frisch 1995, 1996). It is assumed that during different epochs of star formation in the Sco-Cen association hot gas was generated and subsequently swept into the surrounding inhomogeneous medium. While some morphological features of the local ISM can be explained by such a model, it cannot account for the distinct X-ray shadow observed towards the Loop I bubble in the ROSAT PSPC (Position Sensitive Proportional Counter) data (Egger & Aschenbach 1995), which is most naturally explained by an interaction ring between Loop I and the LB. The existence of a “wall” between these two bubbles has also been demonstrated by stellar absorption line measurements of stars with known Hipparcos distances. The formation of such a wall is rather difficult to explain once hot plasma is flowing out from Loop I directly into the LB. For a detailed discussion we refer the reader to Breitschwerdt et al. (2000).
Recently, Smith & Cox (2001) have performed 1-D hydrodynamic simulations to explore whether a low energy input rate in combination with a high ambient pressure can result in the formation of a bubble like the LB. They find that SN explosions within a warm ionized medium are sufficient to explain most observed characteristics of the LB. It is argued that due to the absence of a parent star cluster, these should be due to random explosions, e.g. due to runaway OB stars, in the Galactic disk. As a result of the low energy input rate and high ambient pressure all models predict a collapse of interstellar bubbles once the evolution time scale is larger than about 6 Myr. Although an interesting idea, there is to our knowledge as yet no observational evidence of a bubble in contraction.
Given these widely different concepts for the origin of the LB, it seems appropriate to investigate the evolution of the stellar content of the local ISM back in time for the last tens of million years. Thus we are looking for a “smoking gun” of a stellar cluster consisting of massive stars that may have passed through the LB; its most massive members should have already ended as SNe, but the later-type stars should still be present. Applying an initial mass function (IMF) appropriate for OB stars we are able to infer the number of members that may have exploded within a region that now forms the local cavity. However, these stars may have dispersed and are not easily identifiable as a cluster any more. As pointed out by Eggen (1996), small perturbations in the space motion of stellar clusters can lead to a significant spread of cluster members on a relatively short time scale. In Sect. 2 we take a detailed look at the population of stars in the solar neighborhood. In Sect. 3, we provide results of our investigations on the youngest stars known to exist, and in Sect. 4 we derive the time-dependent energy input due to successive SN explosions and calculate the evolution of the LB. Finally, in Sect. 5, we discuss our findings and present our conclusions on the formation of the LB.
2 The local stellar population
Investigations of the stellar content in the solar neighborhood have shown that young stars do exist. Obviously, these stars cannot have the same origin as the much older stellar population including our Sun. Ongoing star formation in combination with phase-mixing and relaxation must have led to young and old stars now co-existing in the solar neighborhood.
Detailed studies of the Hipparcos data have provided the existence of a number of stellar moving groups. Such moving groups are star streams identified by a similar velocity component in the direction of Galactic rotation. A complete review of the concept of such star streams and the Galactic structure can be found in Eggen (1996). It is suggested that some, if not all, of these moving groups belong to so-called superclusters. According to Eggen (1996), internal and external stresses (e.g., disk heating and Galactic differential rotation) may cause perturbations in the space velocities of the individual stars in a cluster, which led the original cluster to expand in a relatively short time and form a supercluster.
Recently, Asiain et al. (1999a) studied the kinematical properties of 1924 B, A and F main sequence stars extracted from the Hipparcos catalog. They included radial velocity measurements to derive galactic space velocity components (U,V,W) and Strömgren photometry to determine stellar ages for their sample stars. Using a method based on non-parametric density estimators they find evidence for moving groups in the four-dimensional (U,V,W,age) space. In addition to already known moving groups, e.g., the Sirius and the Pleiades moving groups, they detect finer substructures with kinematical properties apparently consistent with those of nearby open clusters or associations. In particular, they find that the Pleiades moving group splits into 4 significantly different subgroups of vastly different ages ranging from 20 to 300 Myrs. According to Asiain et al. (1999a), the youngest (B1 in their notation) is also the most distinct subgroup and the only one still concentrated in space. Most of the 27 member B stars lie in the nearest direction of the Gould Belt, . The center of mass of these stars is located pc away from the Sun, whereas the distance of the Gould Belt in this direction is pc. Obviously, this Pleiades moving group is located in the foreground of the Gould Belt. According to Asiain et al. (1999b) the average age of these stars is Myrs. Based on simulations of the evolution of a stellar complex including the influence of the Galactic gravitational potential and the effect of disk heating with a constant diffusion coefficient, Asiain et al. (1999b) are also able to explain the gross properties of the kinematics of the Pleiades moving group substructures.
3 The youngest stars in the solar neighborhood
The stars associated with Pleiades subgroup B1 constitute the youngest stars known to exist in the solar neighborhood. In order to explore whether more massive stars existed in this association that already exploded as SNe while moving through the LB region, we assume coeval star formation and investigate the mass spectrum of the stars in the Pleiades subgroup B1.
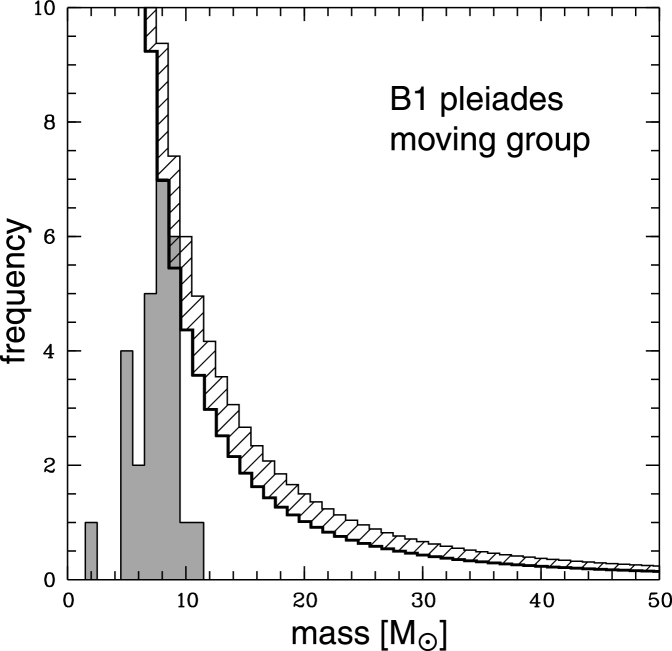
Employing evolutionary tracks by Schaller et al. (1992) for the 27 stars in subgroup B1 we derived individual stellar masses from their spectral types and luminosities. In Fig. 1 we show the mass spectrum of the stars in this subgroup. As can be seen, subgroup B1 is dominated by early B stars of spectral types B3 – B1.5, with masses in the range 6–9 M☉. It is worthwhile to mention that 11 of these stars have already evolved from the main-sequence. Note that the sample of stars investigated by Asiain et al. (1999a) is not a complete sample. The apparent deficit of stars with masses less than in Fig. 1 can be attributed to this incompleteness. In fact, the number of stars known so far to be associated with subgroup B1 is a lower limit. In order to investigate how many stars more massive than 9 M☉ may have existed in the Pleiades subgroup B1 we assume that all stars in the mass range 8–9 M☉ are detected. Next, an initial mass function (IMF) is fit to the distribution of stars in the mass range 8–9 M☉. We adopted a standard power law IMF with a power law index of the form
| (1) |
denotes the number of stars per unit logarithmic mass interval per unit area. This translates into a number of stars in the mass interval ,
| (2) |
According to Massey et al. (1995), for stars in Galactic OB associations with masses in excess of 7 M☉. Assuming this value and normalizing the IMF to solar masses and the mass spectrum of subgroup B1, (see Fig. 1), we derive
| (3) |
This IMF is shown as a thick solid line in Fig. 1. Note that the number of stars known so far to be associated with subgroup B1 is actually a lower limit. Therefore, we also plot the uncertainties in positive direction as a hatched region. The uncertainties take into account the uncertainties in the IMF slope (), which slightly flattens the IMF, and the positive statistical number errors in the mass bins 8 and 9 . If we assume that such a continuous mass distribution is representative for the discrete number of stellar masses in a cluster, and that there are no stars if , we obtain from Eq. (3), . Therefore, it is unlikely that stars with masses in excess of M☉ have existed in subgroup B1. According to Fig. 1 mass depletion becomes apparent for stars with masses ; the estimated total number of SN events, , which will have occurred in this mass range, is then derived from
for . Taking into account that two stars are still present with masses of 10–11 , 19 SNe are estimated to have already occurred. Taking into account that the sample of stars known to be associated with subgroup B1 may be incomplete, the derived number of SN events may be considered as a lower limit.
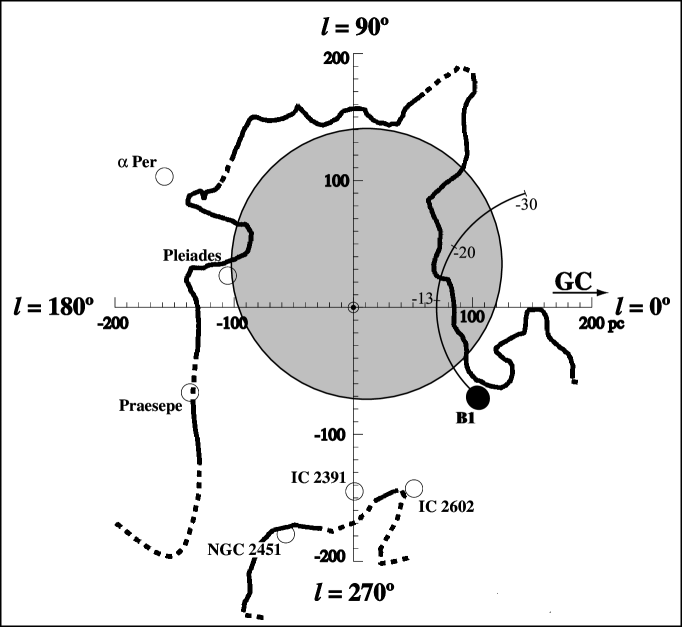
We next compare location and space motion of the Pleiades subgroup B1 with respect to the LB. Fig. 2 provides a sketch of the solar neighborhood in a projection seen from the top of the galactic plane; the direction towards the galactic center is to the right (). The positions of a number of nearby open stellar clusters (open circles in Fig. 2) are shown together with the center of mass position of the Pleiades subgroup B1 (filled circle in Fig. 2). We point out that the Pleiades subgroup B1 is localized in a small volume in space. The evolution of the space distribution of the single member stars is plotted in detail in Asiain et al. (1999b, cf. Fig. 4). The LB is idealized as a sphere; radius and center have been chosen to be consistent with the EUVE measurements presented by Berghöfer et al. (1998, cf. Fig. 13). Additionally, we plot the border of the local cavity as derived by Sfeir et al. (1999) from Nai absorption line studies.
The solid line, ending at the actual position of B1, provides the space motion of the moving group during the past 30 Myrs in the epicyclic approximation; tickmarks indicate the center of mass position 30, 20, and 13 Myrs ago. The path of B1 has been computed by employing the equation of motion provided by Asiain et al. (1999; Eq. (1)). The IAU standard for the solar motion has been adopted to transform the B1 velocity components in the local standard of rest (LSR) system, following the assumption that the system of the LB is bound to the LSR. The time of -13 Myrs is estimated to reflect the time when the most massive star(s) in B1 (M M☉) must have exploded. At this time the center of mass of B1 is located inside the volume of the LB.
We note in passing that there exists a controversy in the interpretation of Hipparcos data, resulting in different values for the solar motion. While there is good agreement on U☉, Dehnen & Binney (1998) obtain a value V km s-1, by arguing that because there is a linear relationship between and the velocity dispersion (also known as asymmetric drift), which is fulfilled for all stars but the youngest, that the latter ones should be excluded from the sample of stars. On the other hand, Torra et al. (2000) have analyzed the kinematics of young stars, using the Hipparcos data plus photometric distances, and by taking into account a distortion of the velocity field by the expansion of the Gould Belt, obtain V km s-1, which is close to the IAU standard value of V km s-1. A more detailed discussion of these problems is clearly beyond the scope of this paper. Assuming the smaller value for V☉ by Dehnen & Binney (1998) stretches the B1 trajectory to the upper direction in Fig. 2 by a factor of 2; however, the trajectory still passes through the LB as outlined by the Nai observations.
Taking into account the spread in the actual positions of individual B1 member stars and the deviations in space velocities (U, V) = (4.7,3.3) km s-1, a significant fraction of former more massive members must have crossed the LB region even closer to the center, while a few might have exploded outside. From the present positions of the individual stars in B1 and their space velocities we estimate that an individual star position may deviate from the center of mass 13 Myrs ago by up to 100 pc. Even if the path of B1 did not run through the very center of the LB it should be emphasized (and will also be discussed in the next section) that the shape or boundary of the bubble are mainly determined by the density and pressure of the ambient medium rather than by the location of individual SNe with respect to the center of explosion. The reason is that a shock wave is weak and propagates fast in a rarefied hot medium, but moves rather slowly when it encounters high density material, which it has to compress and set into motion.
4 Energy budget and evolution of the Local Bubble
While the details of the dynamics and evolution of the LB have to be deferred to a future paper, which concentrates on numerical simulations, we will discuss in the following the time-dependent energy input rate and its consequences for the evolution of the LB.
Obviously, the contribution by stellar winds is only significant at early times and thus is relevant only if massive O stars exist in the cluster, which is not the case here. We will therefore only consider the input rate by SN events, which is by far the dominant at later times (Mac Low & McCray 1988). The main sequence life times, , of stars within the mass range can empirically be approximated by yr (Stothers 1972), with . Since this defines as a function of time , implicitly assuming that the energy input can be described as a continuous process, we obtain
| (5) |
with s. It should be borne in mind that describing discrete events (i.e. SN explosions) by a continuous mass distribution function in time may disregard considerable fluctuations in the time-dependent quantities calculated below. However, the results obtained should be accurate enough in a time averaged sense. Let be the energy input rate per unit time due to a number of successive SN explosions but with a constant energy input of erg each, then the cumulative number of SNe down to mass reads
| (6) |
with , and
| (7) | |||||
| (8) |
with the above values for and , we obtain the handy formula
| (9) |
where , and yr. Here and in the following, the variable has been used as the dynamical time for energy input into the LB and its evolution. Assuming coeval star formation we estimate from the lack of stars with the age of the star cluster to be yr; good agreement with the evolution tracks by Schaller (1992) is obtained for (s. Fig. 2). The present dynamical age for the bubble evolution is therefore given by yr, where Myr defines point zero as the main sequence life-time for the most massive star (). The dynamical time is then given by , and hence .
The assumption of a continuous energy input into the ISM at the center of the first explosion is much better than thought of at first glance. The reason is that every off-center blast wave in a hot rarefied medium with a high speed of sound rapidly degenerates into a Mach 1 shock with a low factor of compressibility of the downstream medium. Therefore, hardly any material is swept up and the bubble remains roughly uniform with negligible radiative cooling due to its high initial temperature. The net effect is simply pressurization of the bubble. The time for the interior weak shock to reach the bubble boundary is of the order of a sound crossing time and thus during most of the evolution much smaller than the dynamical time scale; hence the eccentricity of subsequent explosions has only a minor influence on the evolution of the bubble.
Similarity solutions of superbubbles (e.g. McCray & Kafatos 1987) and their classical analogue, stellar wind bubbles (e.g. Pikelner 1968, Dyson & deVries 1972, Castor et al. 1975, Weaver et al. 1977), can be calculated, provided that the dependent variables and boundary conditions do not explicitly depend on time or length scales that may enter the problem. This is still true for the case of a time-dependent energy input rate, and a density gradient of the ambient medium, .
Similarity conditions hold during the adiabatic expansion phase as long as the bubble pressure is much larger than the ambient medium pressure, i.e. . The mass of the bubble is dominated by the mass swept into a shell,
| (10) |
and the energy input is shared between kinetic and thermal energy,
| (11) |
Using for the ratio of specific heats, observing that remains uniform, and applying spherical symmetry, conservation of momentum
| (12) |
and energy
| (13) |
yields the solution
| (14) | |||||
| (15) | |||||
| (16) |
since the swept-up shell is usually thin, the bubble and shell radius can be treated as equal during the energy driven phase and are denoted by . The similarity variable in the case considered here is given by
| (17) |
To keep matters simple, the ambient density is assumed to be constant (), although it is possible that some of the explosions occur inside a molecular cloud (s. Breitschwerdt & Schmutzler 1994). With the previously used values, the radius of the bubble evolves as
| (18) |
and the expansion velocity as
| (19) |
As a consequence of a decreasing energy input rate the expansion law exponent in Eq. (18) is between a Sedov () and a stellar wind () type solution. According to Eqs. (18) and (19) the radius of the LB will be 289 pc and 158 pc and its velocity is 11.7 km/s and 6.4 km/s, if the ambient density is and , or and , respectively. In the latter case the value of the ambient density would correspond roughly to that of the cold neutral medium. It is interesting to note that the radius, the dynamical time or age of the LB, and the rate of SNe () are very similar to that of the neighboring Loop I superbubble; Egger (1998) estimated its radius to be pc, its dynamical age to be yr and the SN rate to be . Loop I is an active superbubble and has been powered by about 40 SNe in the Sco-Cen OB association, which is about twice as many as in the case of the LB; in this respect, its radius is also fairly small.
According to ROSAT PSPC broad band spectral fitting the Loop I bubble temperature is about K (Egger 1998). This gives support to the idea that we live in an environment of ongoing star formation, although the LB itself is probably extinct.
There are several reasons why we may have overestimated the size of the LB in the similarity solutions above. Firstly, the mass inside the bubble is significantly higher than the pure ejecta mass, as can be inferred from the ROSAT X-ray emission measures; when assuming bubble parameters of pc and (e.g. Snowden et al. 1990) a mass of at least 600 is derived whereas non-equilibrium ionization plasma models (Breitschwerdt & Schmutzler 1994) result in a more than a factor of five higher mass.
The contribution of ejecta is of the order of 100 , and the bulk of the bubble mass is due to hydrodynamic mixing of shell material, heat conduction between shell and bubble and evaporation of entrained clouds; therefore the flow is mass-loaded. The net effect is to reduce the amount of specific energy per unit mass, because the material mixed in is essentially cold, and thereby also increases the rate of radiative cooling. Secondly, the stellar association has probably been surrounded by a molecular cloud with a density in excess of with subsequent break-out of the bubble and dispersal of the parent cloud (Breitschwerdt et al. 1996). Thirdly, the number of SN explosions could be less; here we have assumed that all 20 SNe have occurred inside the LB. This need not be the case as is also suggested by Fig. 2. ROSAT PSPC observations have revealed an annular shadow centered toward the direction (, ), which has been interpreted as an interaction between the LB and the neighboring Loop I superbubble (Egger & Aschenbach 1995). The trajectory of the cluster B1 may have partly crossed the Loop I region. Alternatively and more likely, part of the thermal energy might have been liberated into the Galactic halo, since there is some evidence (see Sect. 5) that the LB is open toward the North Galactic Pole. It should also be mentioned that due to small number statistics the true number of SNe can vary by a factor of 2. Finally, although there is no stringent evidence, it would be very unusual, if the LB would not be bounded by a magnetic field, whose tension and pressure forces would decrease the size of the LB.
Given these uncertainties and the fact that the simple analytic model discussed above can be considered as an upper limit, the agreement with observations is quite good. The bubble radius and shell velocity are rather insensitive to the energy input rate and the ambient density (due to the power of ) and therefore not well constrained, but depend more sensitively on the expansion time scale. Thus we can assert with some confidence that the age of the LB should be between yr.
The radiative cooling time scale of the LB can be estimated using Kahn’s (1976) cooling law (in the temperature range K), , with being the adiabatic parameter and . Using and K, which have been derived from X-ray broad band spectral fitting of a plasma in collisional ionization equilibrium (e.g. Snowden et al. 1990), we obtain yr, comparable to the dynamical time scale. If the X-ray emission is mainly due to the delayed recombination of highly ionized species of a plasma not in in ionization equilibrium, then the cooling time can be as short as yr (Breitschwerdt et al. 1996). In either case, the energy input of previous SNe has largely been used up for expansion and radiative cooling of the bubble. We thus conclude that the emergent X-ray emission must be largely due to the energy input of the last supernova.
We can express the number of stars (and potential SNe) in the mass interval , , by a number of stars ending their lives in the time interval , , using Eq. (3) and ( yr), which results in
The average energy input rate by recent SNe, , (not to be confounded with the cumulative rate of Eq. (3)) is then given by
As a result of the increasing number of exploding stars with time (compensating their increasing main sequence life time) and the assumption that the individual contribution is constant, i.e. erg, the energy input rate (using ) is a moderately increasing function with time.
Analysis of ferromanganese crust samples in deep ocean layers have shown an increased flux rate of , which is indicative of at least one SN which exploded inside the LB at about Myr ago (Knie et al. 1999). Thus, using , we obtain for the associated energy input rate, erg/s. This is a moderate value, but still comfortably larger by a factor of 5 than the total present day soft X-ray photon energy output rate of the LB.
5 Discussion and Conclusions
The fact that the Gould Belt stars show receding velocities, and that the stellar associations are also closely related to molecular clouds and local Hi (see Pöppel 1997) argues in favor of a common history of gas and stars in the local environment. The nature of the Gould Belt is yet unclear; current ideas favor either an explosive origin (Blaauw 1965, Olano 1982) or a collision between a high velocity cloud and the Galactic disk (e.g. Tenorio-Tagle et al. 1986; Comerón & Torra 1992). It is noteworthy that the LB extends perpendicular to the Gould Belt rather than to the Galactic disk (Sfeir et al. 1999), hinting at an origin of the LB connected to the Gould Belt stars and gas.
Regardless whether the expansion was caused by multiple SN events or by the oblique impact of a high velocity cloud, the implications are similar: the shock fronts that have propagated into the ISM, presumably at some angle with respect to the disk, will overrun ambient clouds. If the clouds have low masses, they could be disrupted hydrodynamically and/or evaporated, thereby mass loading and decelerating the flow. As a matter of fact, the spectral properties of the soft X-ray emission combined with the Hi distribution in the local cavity show that the hot LB plasma must consist of a total mass of the order of . This cannot be provided solely by ejecta material, but must be due to hydrodynamic mixing and/or evaporation of ambient gas clouds. In the case of more massive clouds, the shock propagating into the gas will compress it without destroying the cloud, so that a growing number of Jeans unstable clumps will eventually collapse into protostellar cores. A considerable number of nearby stars with ages substantially lower than the Gould Belt’s kinematical age and the existence of active superbubbles (e.g. Loop I with an estimated dynamical age of years, see Egger 1998) seem to support this hypothesis. Note that the age of the Gould Belt is rather uncertain, Comerón (1999) provides an age estimate of Myrs whereas Torra et al. (2000) derive an age in the range of 30–60 Myrs.
In the above picture, the origin of the LB is connected to the evolution of the Gould Belt itself as the disturbed medium that formed the LB. We favor a scenario in which the LB was created by about SNe about yr ago, with a preferred value of yr; the star cluster itself is about yr. It is conceivable that the stars have also been embedded in a molecular cloud for some time (Breitschwerdt et al. 1996). The present day total LB X-ray luminosity is fairly moderate, at most (Cox & Reynolds 1987), and can easily be supplied by the last SN reheating the cavity about a million years ago. This could also explain why only part of the local cavity is illuminated now by X-rays. Note that the sound crossing time out to a distance of 200 pc (in direction of CMa) in a K plasma is roughly 2 Myrs. Moreover, the recombination time scale of major coolants, such as Ovii and Cvi can be estimated from analytical approximations to the rate coefficients (Shull & van Steenberg 1982) to be and Myrs, respectively, for commonly used LB fit parameters of and K (Breitschwerdt & Freyberg 2002). Therefore the emergent X-ray spectrum should be a fairly complex superposition of freshly ionized and recombining plasma (from previous explosions) and definitely be out ionization equilibrium.
We have shown that the subgroup B1 of the Pleiades moving group has actually passed through the LB. If the IMF of this cluster of young stars is similar to the OB associations we observe in our local neighborhood, then obviously some of these stars must have exploded as SNe on their way. Since the kinematic age of B1 can be fairly well determined (assuming they are not bound gravitationally) to be Myrs, it can certainly not be responsible for the origin of the Gould Belt itself. Note that all age determinations for the Gould Belt point to ages older than 30 Myrs. However, the SN events in B1 should have left their imprint on the LB. One important question is when the last one injected mass and energy. According to Eq. (3) and Fig. 1 about 4–5 stars of should have been members of B1. Since two of them are still with us and the average life time of such stars is about 25 Myrs, while stars with live 30 Myrs the last SN is expected to have exploded about Myrs ago, or 3 SNe occurred within the last 5 Myrs. This is roughly consistent with the measurements of radioactive (Knie et al. 1999), where the high flux rate is interpreted by one SN, but within a radius of 30 pc from the Sun and a progenitor mass of about .
The existence of a “Local Chimney” as claimed by Sfeir et al. (1999) and Welsh et al. (1999) may support the hypothesis that the LB is created and shaped by as many as 20 SNe, because it allows a significant fraction of the large superbubble thermal energy to be vented into the Galactic halo. Consequently, after the last explosion, the LB is left in a state of long-term recombination. According to non-equilibrium models (Breitschwerdt & Schmutzler 1994; Breitschwerdt 2002) the observed modest amount of soft X-ray emission can still be generated, even if the last SN occurred more than a million years ago.
B1 still provides another 10 SN candidate members. Since it is about to leave the volume of the local cavity, the LB will remain in a state of recombination, which is what we probably observe at present. Reheating will become progressively less important and the future of the LB should be fairly quiescent.
Acknowledgements.
TWB acknowledges support from the Alexander-von-Humboldt-Stiftung (AvH) by a Feodor-Lynen Fellowship. The research of DB has been funded by the Deutsche Forschungsgemeinschaft (DFG) with a Heisenberg Fellowship and by the Max-Planck-Gesellschaft (MPG). DB thanks G. Hasinger, J. Trümper and the Max-Planck-Institut für extraterrestrische Physik as well as the Department of Astrophysical Sciences at Princeton University, where part of this work was done, for their hospitality. We are indebted to F. Figueras and R. Asiain of the Departament d’Astronomia i Meteorologia, Universitat de Barcelona, who kindly provided us with the listings of stars in the Pleiades moving groups, and to D. Fernandez for helping us in calculating the trajectories of B1. We kindly acknowledge valuable discussions with F. Comerón (ESO), B. Fuchs (ARI Heidelberg) and C. de Vegt (Hamburger Sternwarte).References
- (1) Asiain, R., Figueras, F., Torra, J.,& Chen, B. 1999a, A&A, 341, 427
- (2) Asiain, R., Figueras, F.,& Torra, J. 1999b, A&A, 350, 434
- (3) Berghöfer, T. W., Bowyer, S., Lieu, R.,& Knude, J. 1998, ApJ, 500, 838
- (4) Blaauw, A. 1965, Koninkl. Ned. Akad. Wetenschap., 74, No. 4
- (5) Bochkarev, N. G. 1987, Astrophys. & Sp. Sci., 138, 229
- (6) Breitschwerdt, D. 2002, A&A, (in preparation)
- (7) Breitschwerdt, D., Egger, R., Freyberg, M. J., Frisch, P. C.,& Vallerga, J. V. 1996, Space Sci. Rev., 78, 183
- (8) Breitschwerdt, D., Egger, R.,& Freyberg, M. J. 2000, A&A 361, 303
- (9) Breitschwerdt, D., & Freyberg, M. J. 2002, in: Proc. of the COSPAR Colloquium “The interstellar environment of the Heliosphere”, eds. D. Breitschwerdt & G. Haerendel, invited paper, Elsevier (in press)
- (10) Breitschwerdt D.,& Schmutzler T. 1994, Nature 371, 774
- (11) Caraveo, P. A., Bignami, G. F., Mignani, R.,& Taff, L. G. 1996, ApJ, 461, L91
- (12) Castor, J. McCray, R., & Weaver, R. 1975, ApJ 200, L107
- (13) Comerón, F. 1999, A&A, 351, 506
- (14) Comerón, F.,& Torra, J. 1992, A&A, 261, 94
- (15) Cox D. P.,& Anderson, P. R. 1982, ApJ 253, 268
- (16) Cox D. P.,& Reynolds, R. J. 1987, ARA&A, 25, 303
- (17) Dehnen, W., & Binney, J.J. 1998, MNRAS 298, 387
- (18) Dyson, J.E., & deVries, J. 1972, A&A 20, 223
- (19) Eggen, O. J. 1996, AJ, 112, 1595
- (20) Egger, R. J. 1998 in: Proceedings of the IAU Colloquium No. 166 “The Local Bubble and Beyond”, eds. D. Breitschwerdt, M.J. Freyberg, J. Trümper, Lecture Notes in Physics, 506, 287
- (21) Egger, R. J.,& Aschenbach, B. 1995, A&A 294, L25
- (22) Frisch, P. C.,& York, D. G. 1983, ApJ, 271, L59
- (23) Frisch, P. C. 1995, Space Sci. Rev., 72, 499
- (24) Frisch, P. C. 1996, Space Sci. Rev., 78, 213
- (25) Gehrels, N.,& Chen, W. 1993, Nature, 361, 706
- (26) Gry C., Lemonon L., Vidal-Madjar A., Lemoine A.,& Ferlet R. 1995, A&A 302, 497
- (27) Innes, D. E.,& Hartquist, T. W. 1984, MNRAS 209, 7
- (28) Kahn, F.D. 1976, A&A 50, 145
- (29) Knie, K., Korschinek, G., Faestermann, T. Wallner, C., Scholten, J., & Hillebrandt, W. 1999, Phys. Rev. Letters 83, 1
- (30) Massey, P., Johnson, K. E.,& Degioia-Eastwood, K. 1995, ApJ, 454, ApJ, 454, 151
- (31) McCray, R., & Kafatos, M. 1987, ApJ 317, 190
- (32) Mac Low, M.-M., & McCray, R. 1988, ApJ 324, 776
- (33) McCammon, D., Burrows, D. N., Sanders, W. T.,& Kraushaar, W. L. 1983, ApJ, 269, 107
- (34) Olano, C. A. 1982, A&A, 112, 1950
- (35) Pikelner, S.B. 1968, Astrophys. Letters 2, 97
- (36) Pöppel, W. 1997, Fundamentals of Cosmic Physics, Vol. 18, 1
- (37) Sanders, W. T., Kraushaar, W. L., Nousek, J. A.,& Fried, P. M. 1977, ApJ 217, L87
- (38) Schaller, G., Schaerer, D., Meynet, G.,& Maeder, A. 1992, A&AS, 96, 269
- (39) Sfeir, D. M., Lallement, R., Crifo, F.,& Welsh, B. Y. 1999, A&A, 346, 785
- (40) Shull, J.M., & van Steenberg, M. 1982, ApJSS
- (41) Smith, R. K.,& Cox, D. P. 2001, ApJSS 134, 283
- (42) Snowden, S. L., Cox, D. P., McCammon, D.,& Sanders, W. T. 1990, ApJ, 354, 211
- (43) Stothers. R., 1972, ApJ 175, 431
- (44) Tanaka, Y.,& Bleeker, J. A. M. 1977, Space Sci. Rev., 20, 815
- (45) Tenorio-Tagle, G., Bodenheimer, P., Rozyczka, M.,& Franco, J. 1986, A&A, 170, 107
- (46) Torra, J., Fernández, D.,& Figueras, F. 2000, A&A 359, 82
- (47) Weaver, R., Castor, J., McCray, R., Shapiro, P.,& Moore, R. 1977, ApJ 218, 377; (Erratum 1978, 220, 742)
- (48) Welsh, B.Y., Crifo, F.,& Lallement, R. 1998, A&A 333, 101
- (49) Welsh, B.Y., Sfeir, D. M., Sirk, M. M.,& Lallement, R. 1999, A&A, 352, 308