The afterglow and complex environment of the optically dim burst GRB 980613 (catalog )111Based on observations with the Nordic Optical Telescope, which is operated on the island of La Palma jointly by Denmark, Finland, Iceland, Norway, and Sweden, at the Spanish Observatorio del Rocque de los Muchachos of the Instituto de Astrofisica de Canarias, and on observations with the NASA/ESA Hubble Space Telescope, obtained at the Space Telescope Science Institute, which is operated by the Association of Universities for Research in Astronomy, Inc. under NASA contract NAS5-26555.
Abstract
We report the identification of the optical afterglow of GRB 980613 (catalog ) in - and -band images obtained between 16 and 48 hours after the gamma-ray burst. Early near-infrared (NIR) and observations are also reported. The afterglow was optically faint () at discovery but did not exhibit an unusually rapid decay (power-law decay slope at 2). The optical/NIR spectral index () was consistent with the optical-to--ray spectral index (), indicating a maximal reddening of the afterglow of mag in . Hence the dimness of the optical afterglow was mainly due to the fairly flat spectral shape rather than internal reddening in the host galaxy. We also present late-time HST/STIS images of the field in which GRB 980613 (catalog ) occurred, obtained 799 days after the burst. These images show that GRB 980613 (catalog ) was located close to a very compact, blue object inside a complex region consisting of star-forming knots and/or interacting galaxy fragments. Therefore, GRB 980613 (catalog ) constitutes a strong case for the association of cosmological gamma-ray bursts with star-forming regions.
1 Introduction
Gamma-ray bursts (GRBs) are the most energetic events in the Universe. The currently favored models for long-duration GRBs (lasting more than about one second) involve the collapse of a very massive progenitor star (see e.g., MacFadyen & Woosley (1999), Vietri & Stella (1998), and Bloom, Kulkarni & Djorgovski (2002a)). Because of the short-lived nature of massive stars, GRBs are believed to originate in regions where stars are born. Hence, in this scenario, GRBs are expected to be efficient tracers of massive-star formation in galaxies (Paczyński, 1998). Consequently, GRBs may trace the (massive) star-formation rate in the Universe as a function of redshift (Totani, 1997; Wijers et al., 1998; Blain & Natarajan, 2000). Evidence supporting this hypothesis includes (i) the association of SN1998bw (catalog ) and GRB 980425 (catalog ) which occurred in a star-forming region (Galama et al., 1998; Fynbo et al., 2000), (ii) the association of cosmological GRBs with supernovae (e.g., Bloom et al. 1999; Galama et al. 2000; Björnsson et al. 2001; Bloom et al. 2002; Garnavich et al. 2002), (iii) the discovery of -ray absorption edges and lines in GRB afterglows (Amati et al., 2000; Piro et al., 2000; Reeves et al., 2002), (iv) the locations of GRBs close to star-forming regions in interacting galaxies (Holland & Hjorth, 1999), in starburst or ultraluminous infrared galaxies (ULIRGs) (Djorgovski et al., 1998a; Holland et al., 2001; Berger, Kulkarni & Frail, 2001) or in Ly-emitting galaxies (Fynbo et al., 2002), (v) indications of circumburst density distributions similar to those generated by stellar winds (Jaunsen et al., 2001), (vi) the existence of GRBs at very high redshifts (Andersen et al., 2000), and (vii) the inferred high column densities of neutral Hydrogen along the line of sight to GRBs (Wijers & Galama, 2001).
GRB 980613 (catalog ) triggered the BeppoSAX Gamma-Ray Burst Monitor (40–700 keV, Costa et al. (1998a)) on 1998 June 13 at 04:51:06 UT and was simultaneously detected and positioned at the equatorial coordinates R.A. (J2000.0) = 10h17m44s, Dec. (J2000.0) = +71∘299 (4′ error radius) by the Wide Field Cameras instrument (2–26 keV, Jager et al. (1997)) on board the same satellite (Smith et al., 1998). The event was also detected by BATSE/CGRO with a flux and fluence near the middle of the BATSE burst distribution (Woods, Kippen & Connaughton, 1998). As measured by BeppoSAX, it was composed of a single pulse of duration s in -rays and s in -rays. The peak flux and fluence were erg cm-2 s-1 and erg cm-2 in the 40–700 keV energy band, and erg cm-2 s-1 and erg cm-2 in the 2–26 keV energy band. The BeppoSAX Narrow Field Instruments (Boella et al., 1997) were pointed to the GRB 980613 (catalog ) error box about 9 h after the burst for a total time of about 100 ks, leading to the discovery of a possible -ray afterglow source at R.A. (J2000.0) = 10h17m53s, Dec. (J2000.0) = +71∘27′24″ (1′ error radius) with an average flux of erg cm-2 s-1 (Costa et al., 1998b). GRB 980613 (catalog ) is the faintest burst detected by BeppoSAX in the -ray band but is relatively rich in -rays (Costa et al., 1998c; Costa, 1999). It belongs to the less luminous -ray class of Boër & Gendre (2000).
Following the discovery of the optical afterglow by Hjorth et al. (1998) (described in more detail in this paper) an object identified as the host galaxy was detected by Djorgovski et al. (1998b) and suggested to be part of an interacting system by Hjorth et al. (1999). The complex region in which GRB 980613 (catalog ) occurred was studied in more detail by Djorgovski et al. (2000) who concluded that the burst was located in a starburst galaxy at which is interacting with one or more of several galaxies or galaxy fragments in the vicinity of the GRB. This led Djorgovski et al. (2000) to propose that the GRB originated from a merger-induced starburst.
We here present the initial identification and optical/near-infrared follow-up observations of the afterglow which are used to constrain its exact location, decay rate and spectral index (§2). We next discuss the properties of the host and its environment, as observed with the Hubble Space Telescope (HST) (§3). We conclude by discussing the implications for the nature of dark bursts and for the birth places of GRBs.
We assume a cosmology where km s-1 Mpc-1, , and . In this case a redshift of 1.0969 corresponds to a luminosity distance of 7.41 Gpc and a distance modulus of 44.35. One arcsecond corresponds to 8.2 proper kpc, and the lookback time is 8.1 Gyr.
2 The optical afterglow
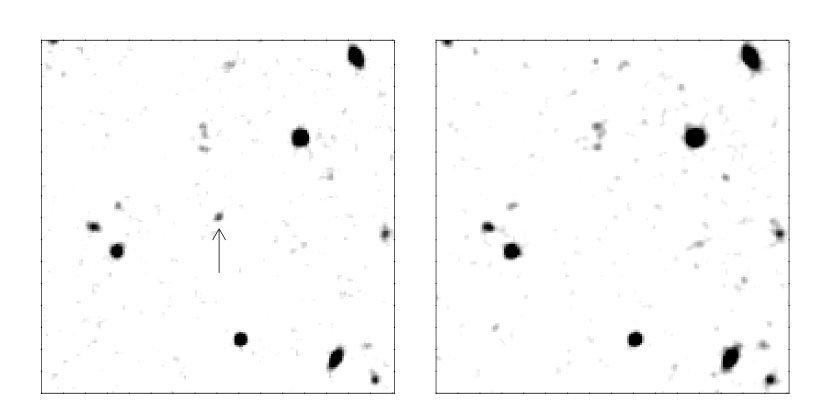
The optical and near-infrared observations are reported in Table 1. The discovery of the optical afterglow was made on the basis of a comparison of the 1998 June 13.9 UT and 17.9 UT NOT images as described by Hjorth et al. (1998) and shown in Fig. 1. There were only two detections of the optical afterglow in each of the and bands from NOT and MDM. In the near infrared the afterglow was not detected to a limit of = 20.9, but a faint object was however detected with . The magnitude of the host galaxy is (R. Chary, private communication, see also Chary, Becklin & Armus (2002)). Even taking the offset between and into account this indicates a substantial contribution from the host galaxy. For this reason we disregard the data in the remainder of this paper.
Djorgovski et al. (2000) reported the detection of several objects within a few arcseconds of the afterglow. Using the HST data presented in §3 we subtracted the contribution from these objects to derive the corrected optical afterglow magnitudes presented in Table 1. At discovery, 16 hours after the burst, the brightness of the optical afterglow was , making it one of the faintest known optical afterglows (Fynbo et al., 2001; Lazzati, Covino & Ghissellini, 2002; Bloom et al., 2002c).
An astrometric fit to the Guide Star Catalog II yielded the afterglow coordinates R.A. (J2000.0) = 10h17m57.90s, Dec. (J2000.0) with an rms uncertainty of .
As observed for most afterglows (and expected from theory cf. e.g. Mészáros, Rees & Papathanassiou (1994); Sari, Piran & Narayan (1998)), the optical spectrum and light decay of the optical afterglow can be described by a power-law, i.e. . Formally, the decay slope derived from the -band data (16–24 hours after the burst) is while from the -band data (24–48 hours after the burst). These values are consistent with the decay slope of observed in the -rays (Boër & Gendre, 2000) and with the 1998 June 16.30 UT datapoint of Djorgovski et al. (1998b). The formal 2 upper limit to the decay slope of indicates that the optical afterglow did not exhibit an unusually rapid decay during the first day after the burst. Thus, the hypothesis that rapid decay is the cause for the dimness of some optical afterglows (Groot et al., 1998) is not applicable to GRB 980613 (catalog ).
The spectral index was computed from the NOT and WHT data from 1998 June 13.9 UT, and from the MDM and data from 1998 June 14.2. We corrected for a Galactic extinction of (Schlegel et al., 1998), i.e., , , and . The resulting spectral indices are and . From the BeppoSAX -ray flux reported by Boër & Gendre (2000) and Soffita et al. (2001) we determine the spectral index between the band and the 2–10 keV -ray band to be , 16 hours after the burst, consistent with and the upper limit on . The latter limit translates into a maximum internal extinction in the host galaxy of 0.45 mag in in addition to the 0.23 mag of foreground extinction.
We note that these observations are consistent with a fireball model ( is the power-law index of the electron energy distribution) which in the spherical adiabatic expansion (pre-break) regime (Sari, Piran & Narayan, 1998) gives and for . However, given the limited amount of data available, other models are also viable.
3 The host complex
3.1 Observations
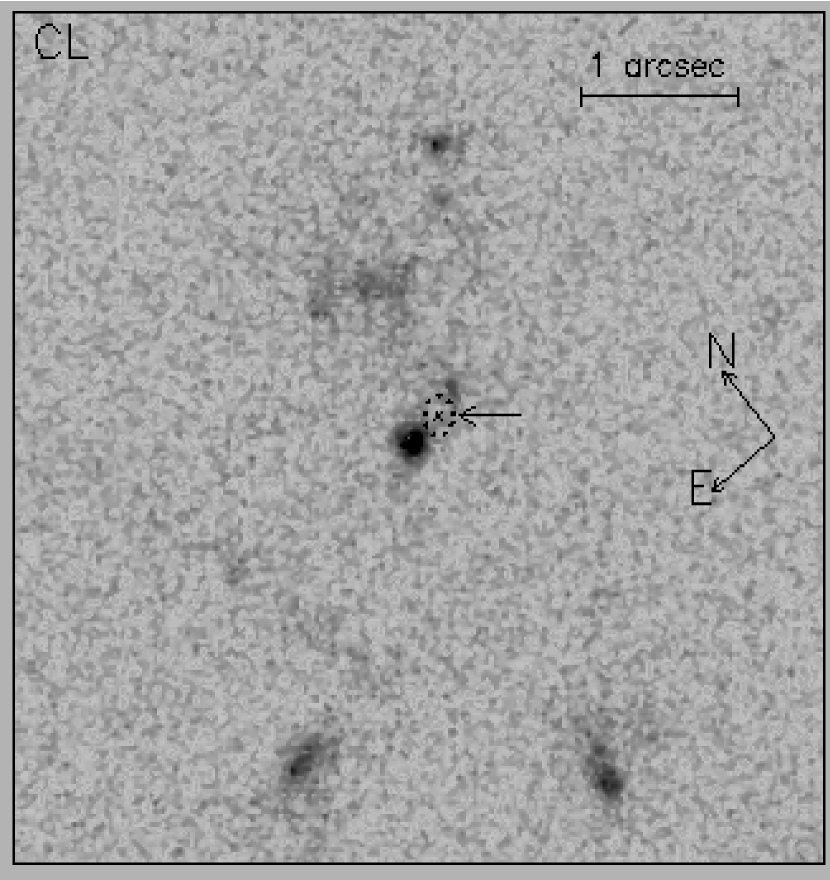
We used the Space Telescope Imaging Spectrograph (STIS) aboard the HST to obtain CCD images of the environment where GRB 980613 (catalog ) occurred. These images were taken on 2000 August 20, 799 days after the burst. The total exposure times were 5851 seconds in the 50CCD (clear; hereafter referred to as CL) aperture and 5936 seconds in the F28X50LP (long pass; hereafter referred to as LP) aperture. The CCD gain was set to 1 e-/ADU and the read-out noise was 4.46 e-. We used a four-point STIS-CCD-BOX dithering pattern with shifts of 2.5 pixels () between exposures. The data were preprocessed through the standard STIS pipeline and combined using the DITHER (v1.2) software (Fruchter & Hook, 2002) as implemented in IRAF (v2.11.3)/STSDAS (v2.1.1). The ‘pixfrac’ parameter was set to 0.6 and we selected a final output scale of 00254 pixel-1. These observations were taken as part of the Cycle 9 program GO-8640: A Survey of the Host Galaxies of Gamma-Ray Bursts. The URI for the survey is http://www.ifa.au.dk/hst/grb_hosts/index.html (Holland et al., 2000). In Fig. 2 we show an inverted gray-scale plot of a excerpt of the CL image, centered on the location of GRB 980613 (catalog ). It reveals a chaotic region consisting of numerous knots and/or interacting galaxy fragments.
3.2 Model fitting
In order to obtain quantitative measures of the structural and photometric parameters of the objects in the host complex we made successive robust fits of a tilted exponential disk model convolved by the drizzled combination of a set of shifted and rebinned PSFs calculated by the TinyTim program (Krist, 1995) using a subsampling of . We fitted one object at a time, after having subtracted and/or masked all neighbouring objects. The spectral type was chosen to match the color of the fitted object as closely as possible. A telescope jitter of was assumed. In order to take proper care of charge diffusion in the STIS CCD each of the PSFs in the set was convolved with a Gaussian kernel appropriate for the spectral type used to generate the subsampled PSF. Finally, the DITHER software was applied as for the observational data.
The model fitting is robust in the sense that the parameters are obtained by a maximum likelihood (ML) estimation assuming a distribution of the residuals which has broader wings than the normal distribution (Press et al., 1992). As an example, the median is an ML estimator if the errors are distributed as a symmetric two-sided exponential. We would, however, prefer to retain the possibility of having asymmetrically distributed residuals. In addition, the deviation from a normal distribution should be small near the peak of the distribution. The simplest probability density satisfying these criteria is a convolution of a Gaussian and an asymmetric double exponential , where and . The three parameters , , and the Gaussian are fixed by use of the maximum likelihood estimator on a sky annulus centered on the galaxy to be fitted. The residuals are scaled by the square root of the weights produced by the DITHER software. The robust fit of the galaxy parameters are obtained by seeking the minimum of minus the logarithm of the likelihood function, but this time with , , and held at fixed values.
The minimization is implemented in the IDL programming language by use of the downhill simplex method (amoeba) described by Press et al. (1992). In general the errors on a parameter determined by a maximum likelihood estimator are not symmetrically distributed around the most probable value. The error range corresponding to (if the method of least squares had been used) is defined by the parameter values that decrease the maximum of (likelihood) by when the remaining parameters are left free to vary. It was obtained by an iterative procedure. In order to obtain convergence for the smallest objects (F, I and J in Fig. 3) they were forced to have circular symmetry.
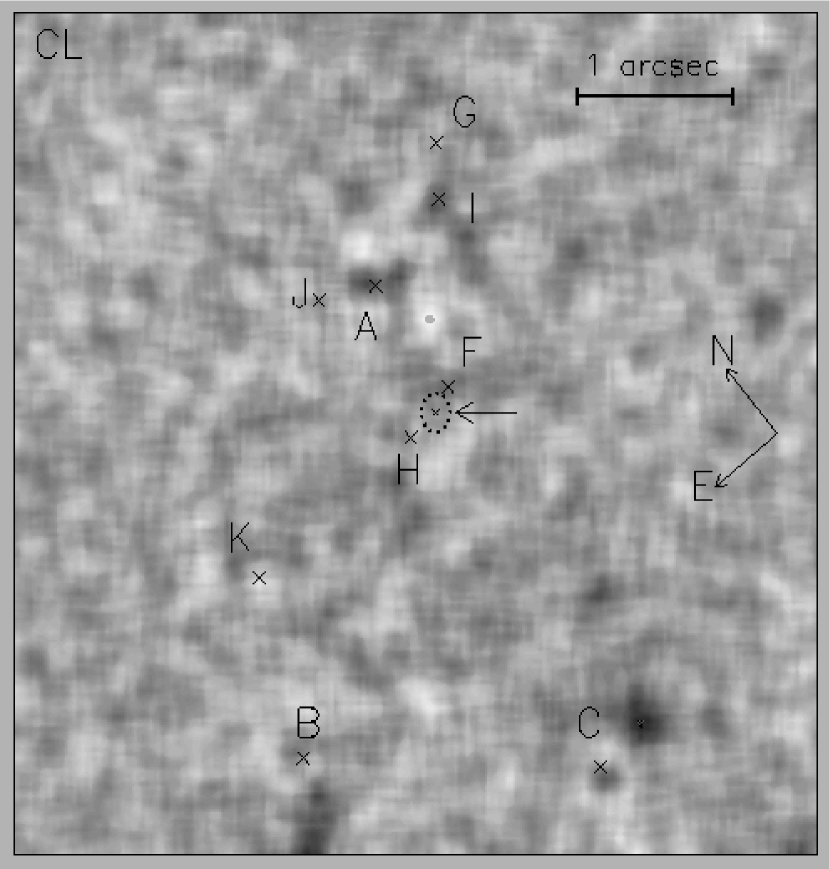
Fig. 3 is a contour plot of our model fit to the image area shown in Fig. 2. The quality of our model is demonstrated in Fig. 4 which shows the residual image smoothed by a box. The fit is remarkably good, except for a bar-like structure near the center of the galaxy A and some positive residuals in the outskirts of galaxies B and C. In these plots we have extended the labeling introduced by Djorgovski et al. (2000). We use A to refer to the face-on disk galaxy (to the north of the GRB, cf. § 3.3). We did not detect the very red object D nor the faint object E of Djorgovski et al. (2000) in either the CL or LP images.
The individual components have apparent diameters ranging from (0.3 kpc) to (4.5 kpc). Their small sizes show the need for high-resolution (HST) photometry to resolve internal details in GRB host galaxies and their environments.
3.3 Localization
We used the discovery NOT -band image obtained on 1998 June 13.9 UT to determine the location of the optical afterglow in the STIS CL image. The host complex made a significant contribution to the flux in the NOT image. Therefore we subtracted the STIS CL image after it was transformed, scaled and smoothed to the resolution and intensity scale of the ground-based image. Based on four reference sources common to the STIS CL image and the ground-based NOT image we find GRB 980613 (catalog ) to be displaced to the west () of a compact, blue galaxy (H in Fig. 3) seen close to the center of the host complex, towards a fainter companion (F). Both these objects are embedded in or projected onto the large, nearly face-on, low surface-brightness (the cosmological surface-brightness dimming amounts to 3.22 mag at ) disk galaxy (A) identified by Djorgovski et al. (2000) as the host galaxy based on ground-based images. The high spatial resolution (HST) images has allowed us to pinpoint the location of the GRB to the galaxy H which was not seen in the ground-based images of Djorgovski et al. (2000). We note that Bloom, Kulkarni & Djorgovski (2002a), based on the HST data presented here, also localized the GRB to the galaxy H. As shown below, the properties of H are quite different from those of A.
3.4 Photometry
We measured the color of each of the objects labeled A, B, C, F, G, H, J, and K in Fig. 3 from robust model fits to the CL and LP images while keeping the structural parameters (scale length, axial ratio, and position angle of major axis) fixed at the values obtained from the fit of all model parameters to the CL image. For the color measurements, only the positions and magnitudes of the galaxy models were fitted, as it makes little sense to calculate the color from magnitudes obtained from different structural parameters (a procedure similar to using different apertures). Furthermore, for fixed structural parameters the magnitude errors are nearly symmetric so the error in the color can be derived as the square root of the sum of magnitude errors. Note that the CL magnitudes and the structural parameters were obtained from unrestricted fits to each galaxy in turn. The rather modest overlaps of some of the objects do not justify the complications of a simultaneous multicomponent fit (the very robust downhill simplex algorithm is not suitable for problems involving more than about 10 parameters).
The STIS magnitudes CL and LP are calculated on the AB system. We have used the zero points and given by Gardner et al. (2000) for 1 count s-1 in CL and LP, respectively. The photometric and morphological parameters are listed in Table 2. For each object we present the CL total magnitude, the color, the central surface brightness in mag arcsec-2, the scale length of the exponential disk , the axial ratio , and the position angle of the major axis. The errors given in Table 2 correspond to errors, if the method of least squares had been used.
3.5 Star-formation rates
In the following we will assume that all of the objects in the host complex are at the same redshift—that of object A. In this case the separations between the objects indicate that the host complex is a compact group. The best fit to the host object H has a disk scale length of ( proper kpc). The object is approximately circular with an ellipticity of . The host object H and its fainter companion F are the bluest objects in the field and H has the highest central surface brightness (Table 2).
As shown in Fig. 1 of Madau, Pozzetti & Dickinson (1998) the power radiated at 2800 Å is proportional to the instantaneous Star Formation Rate (SFR) of a model stellar population with a stellar birthrate of the form SFR , where is the duration of the starburst. The constant of proportionality is quite insensitive to the details of the past star formation history. At the rest-frame wavelength of the CL bandpass is very close to 2800 Å. We used the on-line version of the Galaxy Isochrone Synthesis Spectral Evolution Library (Bruzual & Charlot, 1993; Charlot et al., 1996) and the SYNPHOT package of STSDAS under the IRAF environment to calculate both rest-frame and redshifted AB-magnitudes for a set of Spectral Energy Distributions (SEDs) for bursts of star formation characterized by a Salpeter IMF and an exponentially decreasing SFR with Gyr. Specifically, we obtained the star-formation rate, the absolute magnitude, , the apparent CL magnitude, and the color for each of 12 starbursts with solar metallicity at ages ranging from 1 Myr to 10 Gyr. A Galactic extinction of was applied.
In Fig. 5 we show the specific star-formation rates of the galaxies in the host complex as a function of the observed color, in both the observer’s frame (a) and the rest frame (b). The two continuous curves represent a cubic spline through the 12 model values. The spline curves are used to transform from color to specific SFR and as such are also used to infer the errors. Figures 5a and 5b show and ( is the star-formation rate per unit blue luminosity), both as a function of the color. SFR and are given in units of and , respectively, where is the rest-frame B-band luminosity of a typical galaxy. Lilly et al. (1995) find a typical magnitude of (AB) for blue galaxies with if . For our adopted cosmology of this corresponds to (AB). The values in Table 2 were calculated using this value. The error bars of are taken from Table 2. Note that the objects F, J, and K have error bars extending outside the full color range of the model SEDs. The end-points of the vertical bars are calculated as the curve values of the end-points of the horizontal bars, except for the cases where they extend outside the model range. These bars are limited by the extreme values of the burst models. The specific SFR with respect to the CL-passband (Fig. 5a) is, as expected, nearly constant in the color range . This is, unfortunately, not the case when the SFR is expressed in terms of the rest-frame B-band luminosity (Fig. 5b).
In the last two columns of Table 2 we present the specific star-formation rates in units of for eight of the objects in the host complex, as well as for three of these objects, including the host object. The intrinsic luminosities for the rest of the objects are not given due to their very large uncertainties. The star-formation rates listed in Table 2 and the curves shown in Fig. 5 assume that there is little or no intrinsic extinction in the galaxies of the host complex. The star-formation rates determined from the optical images therefore represent lower limits to the true values.
The star-formation rates per unit blue luminosity in the compact host object (H) and its companion (F) are the highest of the objects listed in Table 2. If H is a galaxy in its own right then it is sub-luminous with . However, this value is somewhat uncertain since is highly correlated with both the slope of the faint end of the galaxy luminosity function and its normalization (Lilly et al., 1995). The specific star-formation rate of the compact host is yr-1 , the highest value of any known GRB host galaxy, as estimated from the 2800 Å flux. The star-formation rate density inside the disk scale length is yr-1 kpc-2, consistent with values (1–1000 yr-1 kpc-2) characterizing a star burst (Kennicutt, 1998). We stress that this is lower limit to the true star-formation rate because of the unknown UV extinction in the host galaxy (see also Chary et al. 2002).
4 Discussion
The dim optical afterglow of GRB 980613 (catalog ) would have gone undetected under slightly less favorable search and observing conditions and, in this case, would have been classified as a ‘dark burst’ (Fynbo et al., 2001; Lazzati, Covino & Ghissellini, 2002; Reichart & Yost, 2001). Part of the reason that the optical afterglow was faint may have been dust extinction in the host galaxy. However, we have presented evidence that the afterglow suffered only at most 0.45 mag of extinction along the line of sight (at a redshift of 1.0969 the rest-frame reddening in the host is ) in the host galaxy plus 0.23 mag of foreground extinction.
Another explanation for the faintness of the optical afterglow may be that the burst was collimated but with the line of sight outside the collimated beam. This results in a much fainter peak afterglow magnitude while the late time light curve behaviour is similar to that observed if the line of sight is inside the collimated beam (Huang, Dai & Lu, 2000). As observed, the burst may in that case be expected to be weaker in -rays than in -rays (Nakamura, 2000).
The positional coincidence between GRB 980613 (catalog ) and the faint compact blue object (H) with a high surface brightness and specific star-formation rate provides strong evidence in favor of the association of GRBs with star formation. Not only did GRB 980613 (catalog ) occur in a chaotic and possibly interacting region (Djorgovski et al., 2000), the STIS images presented here also reveal that the GRB occurred in what is probably the most active site of star formation in the entire complex.
It is interesting to note that GRB 980613 (catalog ) did not occur in the region of highest inferred total star-formation rate (object A) but in the region of the highest specific star-formation rate (objects H and F) (although the total star-formation rate of H is also relatively high). One may speculate that GRBs trace regions of high specific optical star-formation rate, either because the total star-formation rate is in fact dramatically higher than that inferred from the UV flux due to dust (as in GRB 980703 (catalog ), cf. Berger, Kulkarni & Frail (2001)) or because the IMF could be biased towards high-mass stars in regions experiencing its first intensive starburst, possibly leading to a much higher rate of massive-star formation. We caution however that such conclusions should not be based on one system and note that GRB 990705 (catalog ) (Andersen et al., 2002) occurred in a region of very little star-formation activity in an evolved galaxy.
References
- Amati et al. (2000) Amati, L. et al. 2000, Science, 290, 953
- Andersen et al. (2000) Andersen, M. I. et al. 2000, A&A, 364, L54
- Andersen et al. (2002) Andersen, M. I. et al. 2002, Science, submitted
- Berger, Kulkarni & Frail (2001) Berger, E., Kulkarni, S. R., & Frail, D. A. 2001, ApJ, 560, 652
- Björnsson et al. (2001) Björnsson, G., Hjorth, J., Jakobsson, P., Christensen, L., & Holland, S. T. 2001, ApJ, 552, L121
- Blain & Natarajan (2000) Blain, A. W., & Natarajan, P. 2000, MNRAS, 312, L35
- Bloom et al. (1999) Bloom, J. S. et al. 1999, Nature, 401, 453
- Bloom, Kulkarni & Djorgovski (2002a) Bloom, J. S., Kulkarni, S. R., & Djorgovski, S. G. 2002a, AJ, 123, 1111
- Bloom et al. (2002b) Bloom, J. S. et al. 2002b, ApJ, submitted (astro-ph/0203391)
- Bloom et al. (2002c) Bloom, J. S., Mirabal, N., Halpern, J. P., Fox, D. W., & Lopez, P. A. A. 2002c, GCN Circ. 1294
- Boella et al. (1997) Boella, G. et al. 1997, A&AS, 122, 299
- Boër & Gendre (2000) Boër, M., & Gendre, B. 2000, A&A, 361, L21
- Bruzual & Charlot (1993) Bruzual, A. G., & Charlot, S. 1993, AJ, 87, 1165
- Charlot et al. (1996) Charlot, S., Worthey, G., & Bressan, A. 1996, ApJ, 457, 625
- Chary, Becklin & Armus (2002) Chary, R., Becklin, E. E., & Armus, L. 2002, ApJ, 566, 229
- Costa et al. (1998a) Costa, E. et al. 1998a, Adv. Sp. Res., 22, 1129
- Costa et al. (1998b) Costa, E. et al. 1998b, IAU Circ., 6939
- Costa et al. (1998c) Costa, E. et al. 1998c, AAS #193, #79.04
- Costa (1999) Costa, E. 1999, A&AS, 138, 425
- Djorgovski et al. (1998a) Djorgovski, S. G., Kulkarni, S. R., Bloom, J. S., Goodrich, R., Frail, D. A., Piro, L., & Palazzi, E. 1998a, ApJ, 508, L17
- Djorgovski et al. (1998b) Djorgovski, S. G., Kulkarni, S. R., Odewahn, S. C., & Ebeling, H. 1998b, GCN Circ. 117
- Djorgovski et al. (2000) Djorgovski, S. G., Bloom, J. S., & Kulkarni, S. R. 2000, ApJ, submitted (astro-ph/0008029)
- Fruchter & Hook (2002) Fruchter, A. S., & Hook, R. N. 2002, PASP, 114, 144
- Fynbo et al. (2000) Fynbo, J. P. U. et al. 2000, ApJ, 542, L89
- Fynbo et al. (2001) Fynbo, J. P. U. et al. 2001, A&A, 369, 373
- Fynbo et al. (2002) Fynbo, J. P. U. et al. 2002, A&A, in press (astro-ph/0203245)
- Galama et al. (1998) Galama, T. J. et al. 1998, Nature, 395, 670
- Galama et al. (2000) Galama, T. J. et al. 2000, ApJ, 536, 185
- Gardner et al. (2000) Gardner, J. P. et al. 2000, AJ, 119, 486
- Garnavich et al. (2002) Garnavich, P. M. et al. 2002, ApJ, submitted (astro-ph/0204234)
- Groot et al. (1998) Groot, P. J. et al. 1998, ApJ, 502, L123
- Halpern & Fesen (1998) Halpern, J. P., & Fesen, R. 1998, GCN Circ. 134
- Hjorth et al. (1998) Hjorth, J., Andersen, M. I., Pedersen, H., Jaunsen, A. O., Costa, E., & Palazzi, E. 1998, GCN Circ. 109
- Hjorth et al. (1999) Hjorth, J., Pedersen, H., Jaunsen, A. O., & Andersen, M. I. 1999, A&AS, 138, 461
- Holland & Hjorth (1999) Holland, S. T., & Hjorth, J. 1999, A&A, 344, L67
- Holland et al. (2000) Holland, S. T. et al. 2000, GCN Circ. 698; GCN Circ. 777
- Holland et al. (2001) Holland, S. T. et al. 2001, A&A, 371, 52
- Huang, Dai & Lu (2000) Huang, Y. F., Dai, Z. G., & Lu, T. 2000, MNRAS, 316, 943
- Jager et al. (1997) Jager et al. 1997, A&AS, 125, 557
- Jaunsen et al. (2001) Jaunsen, A. O. et al. 2001, ApJ, 546, 127
- Kennicutt (1998) Kennicutt, R. C. 1998, ARA&A, 189
- Krist (1995) Krist, J. 1995, in ASP Conf. Ser. 77, Astronomical Data Analysis Software and Systems IV, ed. R. A. Shaw, H. E. Payne, & J. J. E. Hayes (San Francisco: ASP), 349
- Landolt (1992) Landolt, A. 1992, AJ, 104, 372
- Lazzati, Covino & Ghissellini (2002) Lazzati, D., Covino, S., & Ghissellini, G. 2002, MNRAS, 330, 583
- Lilly et al. (1995) Lilly, S., Tresse, L., Hammer, F., Crampton, D., & Le Fèvre, O. 1995, ApJ, 455, 108
- MacFadyen & Woosley (1999) MacFadyen, A. I., & Woosley, S. E. 1999, ApJ, 524, 262
- Madau, Pozzetti & Dickinson (1998) Madau, P., Pozzetti, L., & Dickinson, M. 1998, ApJ, 498, 106
- Mészáros, Rees & Papathanassiou (1994) Mészáros, P., Rees, M. J., & Papathanassiou, H. 1994, ApJ, 432, 181
- Nakamura (2000) Nakamura, T. 2000, ApJ, 534, L159
- Paczyński (1998) Paczyński, B. 1998, ApJ, 494, L45
- Palazzi et al. (1992) Palazzi, E. et al. 1998, A&A, 336, L95
- Piro et al. (2000) Piro, L. et al. 2000, Science, 290, 955
- Press et al. (1992) Press, W. H., Teukolsky, S. A., Vetterling, W. T., & Flannery, B. P. 1992, Numerical Recipes in C (New York: Cambridge University Press)
- Reeves et al. (2002) Reeves, J. N., et al. 2002, Nature, 416, 512
- Reichart & Yost (2001) Reichart, D. E., & Yost, S. A. 2001, ApJ, submitted (astro-ph/0107556)
- Sari, Piran & Narayan (1998) Sari, R., Piran, T., & Narayan, R. 1998, ApJ, 497, L17
- Schlegel et al. (1998) Schlegel, D. J., Finkbeiner, D. P., & Davis, M. 1998, ApJ, 500, 525
- Sérsic (1968) Sérsic, J. L. 1968, Atlas de galaxias astrales, Observatorio Astronomico, Cordoba
- Smith et al. (1998) Smith, M. J. S., Ricci, R., in’t Zand, J., Feroci, M., Piro, L., Soffitta, P., Masetti, N., Palazzi, E. 1998, IAU Circ., 6938
- Soffita et al. (2001) Soffitta, P. et al. 2001, in ESO Astrophysics Symposia, Gamma-Ray Bursts in the Afterglow Era, ed. E. Costa, F. Frontera, & J. Hjorth (Berlin: Springer), 201
- Totani (1997) Totani, T. 1997, ApJ, 486, L71
- Vietri & Stella (1998) Vietri, M, & Stella, L. 1998, ApJ, 507, L45
- Wijers et al. (1998) Wijers, R. A. M. J., Bloom, J. S., Bagla, J. S., & Natarajan, P. 1998, MNRAS, 294, L13
- Wijers & Galama (2001) Wijers, R. A. M. J., & Galama, T. 2001, ApJ, 549, L209
- Woods, Kippen & Connaughton (1998) Woods, P., Kippen, R. M., & Connaughton, V. 1998, GCN Circ. 112


| Date | Filter | Exposure time | Telescopeaa NOT is the 2.56-m Nordic Optical Telescope on La Palma, equipped with ALFOSC (1998 June 13.89) and HiRAC (1998 June 17.89); CAHA is the 3.5-m telescope at Calar Alto, equipped with OMEGA-Cass; WHT is the 4.2-m Willian Herschel Telescope on La Palma, equipped with CIRSI; MDM is the 2.4-m Hiltner telescope of the MDM Observatory on Kitt Peak, equipped with a thinned, back-side illuminated SITe CCD. | FWHM | Brightnessbb The and data were calibrated to the Cousins system using Landolt (1992) standard stars (Halpern & Fesen, 1998). The quoted magnitudes refer to a 1″ radius aperture. | Afterglowcc The and magnitudes after subtracting scaled and transformed HST/STIS images to correct for the contribution from the host environment. |
|---|---|---|---|---|---|---|
| (June 1998 UT) | (sec) | (arcsec) | (mag) | (mag) | ||
| 13.89 | 600 | NOT | 0.7 | |||
| 13.89 | CAHA | 1.2 | ||||
| 13.90 | 2400 | WHT | 1.2 | |||
| 14.20 | MDM | 0.96 | ||||
| 14.24 | MDM | 1.14 | ||||
| 14.90 | CAHA | 1.2 | ||||
| 15.19 | MDM | 0.99 | ||||
| 17.91 | 600 | NOT | 0.68 |
| Object | CL | Rd | P.A. | |||||
|---|---|---|---|---|---|---|---|---|
| (mag) | (mag) | (mag arcsec-2) | (mas) | () | ||||
| A | ||||||||
| B | ||||||||
| C | ||||||||
| F | ||||||||
| G | ||||||||
| H | ||||||||
| I | ||||||||
| J | ||||||||
| K |
Note. — The meaning of the quoted errors is discussed in §§ 3.2 and 3.4