Cosmological constraints from the X-ray gas mass fraction in relaxed lensing clusters observed with Chandra
Abstract
We present precise measurements of the X-ray gas mass fraction for a sample of luminous, relatively relaxed clusters of galaxies observed with the Chandra Observatory, for which independent confirmation of the mass results is available from gravitational lensing studies. Parameterizing the total (luminous plus dark matter) mass profiles using the model of Navarro, Frenk & White (1997), we show that the X-ray gas mass fractions in the clusters asymptote towards an approximately constant value at a radius , where the mean interior density is times the critical density of the Universe at the redshifts of the clusters. Combining the Chandra results on the X-ray gas mass fraction and its apparent redshift dependence with recent measurements of the mean baryonic matter density in the Universe and the Hubble Constant determined from the Hubble Key Project, we obtain a tight constraint on the mean total matter density of the Universe, , and measure a positive cosmological constant, . Our results are in good agreement with recent, independent findings based on analyses of anisotropies in the cosmic microwave background radiation, the properties of distant supernovae, and the large-scale distribution of galaxies.
keywords:
X-rays: galaxies: clusters – galaxies: clusters: general – gravitational lensing – cosmological parameters1 Introduction
The matter content of rich clusters of galaxies is thought to provide a fair sample of the matter content of the Universe as a whole (White et al. 1993). The observed ratio of the baryonic to total mass in clusters should therefore closely match the ratio of the cosmological parameters , where and are the mean baryon and total mass densities of the Universe, in units of the critical density. The combination of robust measurements of the baryonic mass fraction in clusters with accurate determinations of from cosmic nucleosynthesis calculations (constrained by the observed abundances of light elements at high redshifts) can therefore be used to determine .
This method for measuring , which is particularly simple in terms of its underlying assumptions, was first highlighted by White & Frenk (1991) and subsequently employed by a number of groups (e.g. Fabian 1991, White et al. 1993, David, Jones & Forman 1995; White & Fabian 1995; Evrard 1997; Fukugita, Hogan & Peebles 1998; Ettori & Fabian 1999; Bahcall et al. 2000). In general, these studies have found at high significance, with preferred values lying in the range .
Sasaki (1996) and Pen (1997) described how measurements of the mean baryonic mass fraction in clusters as a function of redshift can, in principle, be used to place more detailed constraints on cosmological parameters, since the observed baryonic mass fraction values are sensitive to the angular diameter distances to the clusters assumed in the analyses. Until now, however, systematic uncertainties in the observed quantities have seriously complicated the application of such methods.
The baryonic mass content of rich clusters of galaxies is dominated by the X-ray emitting intracluster gas, the mass of which exceeds the mass of the optically luminous material by a factor (e.g. White et al. 1993; David et al. 1995; Fukugita, Hogan & Peebles 1998). Since the X-ray emissivity of the X-ray gas is proportional to the square of its density, the gas mass profile can be precisely determined from the X-ray data. With the advent of accurate measurements of (e.g. O’Meara et al. 2001 and references therein) and a precise determination of the Hubble Constant (Freedman et al. 2001), the dominant uncertainty in determining from the baryonic mass fraction in clusters has lain in the measurements of the total (luminous plus dark) matter distributions in the individual clusters.
In this letter we report precise measurements of the X-ray gas mass fraction for a sample of luminous, relatively relaxed clusters spanning the redshift range , for which precise, consistent mass models have recently been determined from Chandra X-ray data and independent gravitational lensing constraints (Allen et al. 2001a, 2002; Schmidt, Allen & Fabian 2001). The agreement between the mass measurements determined from the two independent methods firmly limits the systematic uncertainties in the baryonic mass fraction measurements to per cent, an accuracy comparable to the current results. With the reduced systematic uncertainties, we show that a method similar to those proposed by Sasaki (1996) and Pen (1997) can be successfully applied to the data, resulting in a tight constraint on and an interesting constraint on . We show that the results obtained are in good agreement with those from recent studies of anisotropies in the cosmic microwave background radiation, the large-scale distribution of galaxies, and the properties of distant supernovae (e.g. Jaffe et al. 2001; Efstathiou et al. 2001).
Results on the X-ray gas mass fractions are quoted for two default cosmologies: SCDM with , and , and CDM with , and .
2 Observations and data analysis
| z | Date | Exposure (ks) | |
|---|---|---|---|
| PKS0745-191 | 0.103 | 2001 Jun 16 | 17.9 |
| Abell 2390 | 0.230 | 1999 Nov 07 | 9.1 |
| Abell 1835 | 0.252 | 1999 Dec 12 | 19.6 |
| MS2137-2353 | 0.313 | 1999 Nov 18 | 20.6 |
| RXJ1347-1145(1) | 0.451 | 2000 Mar 05 | 8.9 |
| RXJ1347-1145(2) | 0.451 | 2000 Apr 29 | 10.0 |
| 3C295 | 0.461 | 1999 Aug 30 | 17.0 |
The Chandra observations were carried out using the back-illuminated S3 detector on the Advanced CCD Imaging Spectrometer (ACIS) between 1999 August 30 and 2001 June 16. For our analysis we have used the the level-2 event lists provided by the standard Chandra pipeline processing. These lists were cleaned for periods of background flaring using the CIAO software package resulting in the net exposure times summarized in Table 1.
The Chandra data have been analysed using the methods described by Allen et al. (2001a, 2002) and Schmidt et al. (2001). In brief, concentric annular spectra were extracted from the cleaned event lists, centred on the peaks of the X-ray emission from the clusters.111For RXJ1347-1145, the data from the southeast quadrant of the cluster were excluded due to ongoing merger activity in that region; Allen et al. (2002). The spectra were analysed using XSPEC (version 11.0: Arnaud 1996), the MEKAL plasma emission code (Kaastra & Mewe 1993; incorporating the Fe-L calculations of Liedhal, Osterheld & Goldstein 1995), and the photoelectric absorption models of Balucinska-Church & McCammon (1992). Only data in the keV energy range were used. The spectra for all annuli were modelled simultaneously, in order to determine the deprojected X-ray gas temperature profiles under the assumption of spherical symmetry.
For the mass modelling, azimuthally-averaged surface brightness profiles were constructed from background subtracted, flat-fielded images with a arcsec2 pixel scale ( raw detector pixels). When combined with the deprojected spectral temperature profiles, the surface brightness profiles can be used to determine the X-ray gas mass profiles (to high precision) and total mass profiles in the clusters.222The observed surface brightness profile and a particular parameterized mass model are together used to predict the temperature profile of the X-ray gas. (We use the median temperature profile determined from 100 Monte-Carlo simulations. The outermost pressure is fixed using an iterative technique which ensures a smooth pressure gradient in these regions.) The predicted temperature profile is rebinned to the same binning as the spectral results and the difference between the observed and predicted, deprojected temperature profiles is calculated. The parameters for the mass model are stepped through a regular grid of values in the - plane (see text) to determine the best-fit values and 68 per cent confidence limits. (The best-fit models generally provide good descriptions of the data). The gas mass profile is determined to high precision at each grid point directly from the observed surface brightness profile and model temperature profile. Spherical symmetry and hydrostatic equilibrium are assumed throughout. For this analysis, we have used an enhanced version of the image deprojection code described by White, Jones & Forman (1997) with distances calculated using the code of Kayser, Helbig & Schramm (1997).
We have parameterized the cluster mass (luminous plus dark matter) profiles using a Navarro, Frenk & White (1997; hereafter NFW) model with
| (1) |
where is the mass density, is the critical density for closure at redshift , is the scale radius, is the concentration parameter (with ) and . The normalizations of the mass profiles may also be expressed in terms of an equivalent velocity dispersion, (with in units of Mpc and in ).
In determining the results on the X-ray gas mass fraction, , we have adopted a canonical radius , within which the mean mass density is 2500 times the critical density of the Universe at the redshift of the cluster. (The values are determined directly from the Chandra data, with confidence limits calculated from the grids.) The values are well-matched to the outermost radii at which reliable temperature measurements can be made from the Chandra data. Note that the data for PKS0745-191 do not quite reach to and for this cluster we quote at the outermost radius at which reliable measurements can be made . Although independent confirmation of the X-ray mass results for 3C295 is not available, we include this cluster in our simple since in most other ways it appears similar to the other objects in the sample. The values for the clusters are listed in Table 2. The best-fit NFW model parameters and 68 per cent confidence limits are summarized by Allen et al. (2001b).
3 Results
| SCDM | CDM | |||||
|---|---|---|---|---|---|---|
| PKS0745-191 | ||||||
| Abell 2390 | ||||||
| Abell 1835 | ||||||
| MS2137-2353 | ||||||
| RXJ1347-1145 | ||||||
| 3C295 | ||||||
3.1 The X-ray gas mass fraction measurements
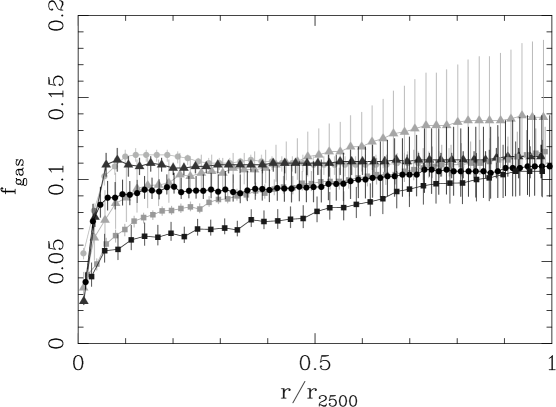
Fig. 1 shows the observed profiles for the six clusters assuming the standard CDM cosmology. We see that although some variation is present from cluster to cluster, the profiles tend towards a similar value at . Table 2 lists the results on the X-ray gas mass fractions measured at for both the SCDM and CDM cosmologies. Taking the weighted mean of the results for all six clusters studied, we obtain for SCDM (h=0.5) and for CDM (h=0.7).
In calculating the total baryonic mass in the clusters, we assume that the optically luminous baryonic mass in galaxies is times the X-ray gas mass (White et al. 1993; Fukugita, Hogan & Peebles 1998). Other sources of baryonic matter are expected to make only very small contributions to the total mass and are ignored.
Given the baryonic masses, and assuming that the regions of the clusters within provide a fair sample of the matter content of the Universe, we can write
| (2) |
For (O’Meara et al. 2001) and using the CDM () values, we obtain the (self-consistent) result . Using the SCDM () values, we obtain .
3.2 Cosmological constraints from the data


In addition to the simple calculation of based on the weighted-mean values, described above, the data for the present sample can be used to obtain more rigorous constraints on cosmological parameters from the apparent variation of with redshift.
Fig. 2 shows the values as a function of redshift for the SCDM and CDM cosmologies. We see that whereas the results for the CDM cosmology are consistent with a constant value, the results for SCDM indicate an apparent drop in as the redshift increases. The differences in the behaviour for the SCDM and CDM cosmologies reflect the dependence of the measurements on the assumed angular diameter distances to the clusters (). Under the assumption that the values should be invariant with redshift, as would be expected if rich, relaxed clusters provide a fair sample of the matter content of the Universe, we can see from inspection of Fig. 2 that the data for the present sample favour the CDM over the SCDM cosmology.
In order to quantify more precisely the degree to which our data can constrain the relevant cosmological parameters, we have fitted the data in Fig. 2(a) with a model which accounts for the expected apparent variation in the values, which are measured assuming an SCDM cosmology, for different underlying cosmologies. The ‘true’ cosmology should be the cosmology that provides the best fit to the measurements. (We work with the SCDM data. Note that the profiles exhibit only small variations around , and so the effects of changes in as the cosmology is varied can be ignored.)
The model function fitted to the data is
| (3) |
which depends on , , and . The ratio accounts for the change in the Hubble Constant between the considered model and default SCDM cosmology, and the ratio of the angular diameter distances accounts for deviations in the geometry of the Universe from the Einstein-de Sitter case. We constrain (O’Meara et al. 2001) and , the final result from the Hubble Key Project reported by Freedman et al. (2001). The difference between the model and SCDM data is then
| (4) | |||||
where and are the best-fit values and symmetric root-mean-square errors for the SCDM data from Table 2, and are the redshifts of the clusters. We have examined a grid of cosmologies covering the plane and . The joint 1, 2 and 3 confidence contours on and (corresponding to values of 2.30, 6.17 and 11.8, respectively) determined from the fits are shown in Fig. 3.
The best-fit cosmological parameters and marginalized 1 error bars are and , with for 4 degrees of freedom, indicating that the model provides an acceptable description of the data. The best-fit cosmological parameters are similar to those assumed for the default CDM cosmology in Fig. 2b, which is expected given the approximately constant nature of the (z) values shown in that Figure.
4 Discussion
The result on the mean matter density of the Universe, , determined from the Chandra results on the X-ray gas mass fraction for the present sample of relaxed, lensing clusters, represents one of the tightest constraints on this cosmological parameter to date. The variation of the gas mass fraction with redshift also yields the measurement of a positive cosmological constant with , in good agreement with previous results based on studies of the properties of distant supernovae (Riess et al. 1998; Perlmutter et al. 1999)
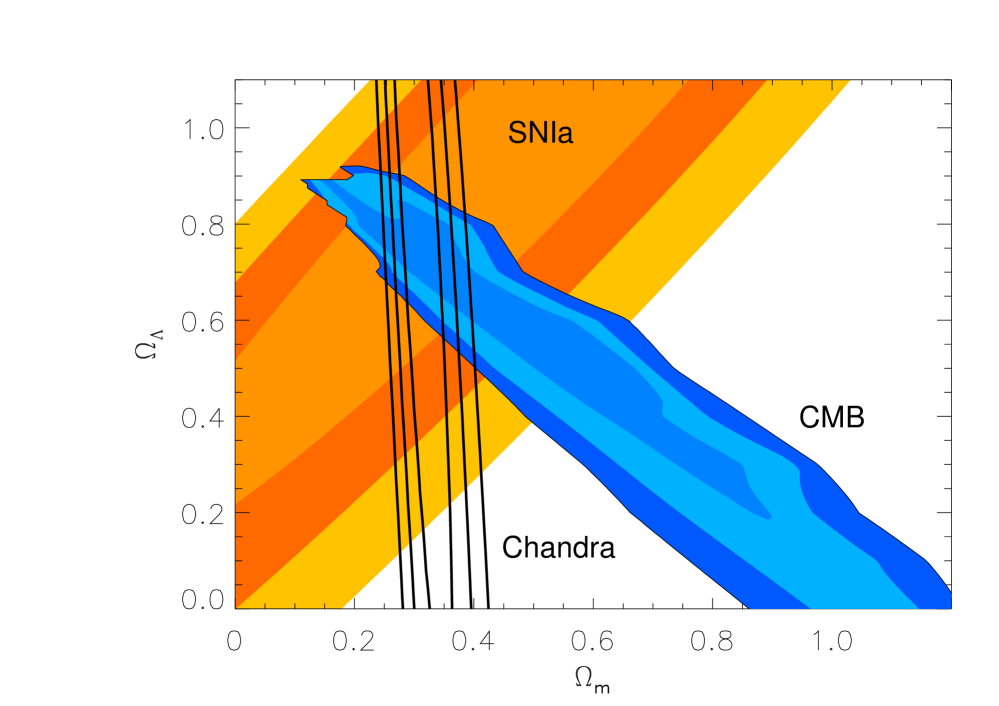
In Fig. 3 we show a comparison of the joint constraints on and determined from the Chandra data, with the results of Jaffe et al. (2001) from studies of cosmic microwave background (CMB) anisotropies (incorporating the COBE Differential Microwave Radiometer, BOOMERANG-98 and MAXIMA-1 data of Bennett et al. 1996, de Bernardis et al. 2000 and Hanany et al. 2000, respectively)333We note that the results on and from the CMB data reported by Jaffe et al. (2001) are consistent with, though less constraining than, the later analyses of de Bernardis et al. (2002) and Stompor et al. (2001) using the full BOOMERANG and MAXIMA-1 data sets. and the properties of distant supernovae (incorporating the data of Riess et al. 1998 and Perlmutter et al. 1999). The agreement between the results obtained from the independent methods is striking: all three data sets are consistent, at the confidence level, with a cosmological model with and . These results are also consistent with the findings of Efstathiou et al. (2001) from a combined analysis of the 2dF Galaxy Redshift Survey and CMB data.
An important aspect of the present work is that, in addition to the exquisite data quality provided by Chandra, the clusters studied are all regular, relatively relaxed systems for which independent confirmation of the mass results is available from gravitational lensing studies. The systematic uncertainties in the measurements are therefore greatly reduced with respect to previous X-ray studies. For both Abell 2390 and RXJ1347-1145, the X-ray and weak lensing mass profiles are consistent within their 68 per cent confidence limits. For Abell 1835, 2390, MS2137-2353 and PKS0745-191, the observed strong lensing configurations (on scales kpc) can be explained by mass models within the 68 per cent Chandra confidence contours, although redshift measurements for the arcs (which are required to define the lensing masses precisely) are not available in all cases.444For RXJ1347-1145, a two-component mass model, consistent with the complex X-ray structure observed in the southeast quadrant, is required to explain the strong lensing data. The presence of significant non-thermal pressure support (e.g. arising from turbulent and/or bulk motions and/or magnetic fields) on scales can therefore be excluded, and the residual systematic uncertainties in the values are small ( per cent i.e. smaller, typically, than the statistical uncertainties. We note that the effects of departures from spherical symmetry on the results are expected to be a few per cent e.g. Buote & Canizares 1996).
The observed profiles are essentially flat around , which supports the assumption that the measured values represent a fair sample of the matter content of the Universe. If, however, the values were to rise by a further per cent beyond , the result on would drop by a corresponding amount. The values measured at are not sensitive to the choice of using an NFW model to parameterize the total mass distributions in the clusters. Repeating the analysis presented here using either a non-singular isothermal sphere or a Moore et al. (1998) model to parameterize the total mass distributions leads to results on the weighted-mean values in good agreement with those quoted in Section 3.1. We note, however, that the profiles determined using the different mass models exhibit some systematic variation, particularly at small radii (), and when extrapolated to large radii (), as can be expected given the different asymptotic slopes. In a future paper, we will examine in detail the ability of different parameterized models to describe the Chandra data for relaxed clusters.
The constraints on and should improve as further Chandra, XMM-Newton and high-quality gravitational lensing data become available for more regular, relaxed clusters, especially at high redshifts (although relaxed systems, like those studied here, are expected to be very rare at high redshifts). This work can also be extended to include less relaxed clusters, or clusters which appear relaxed at X-ray wavelengths but for which independent confirmation of the mass results from gravitational lensing studies is not yet available, although this will require careful consideration of the additional systematic uncertainties involved.
We thank Andrew Jaffe for providing the CMB and supernovae results shown in Fig. 3. SWA and ACF thank the Royal Society for support.
References
- [1] Allen S.W., Ettori S., Fabian A.C., 2001a, MNRAS, 324, 877
- [2] Allen S.W., Schmidt R.W., Fabian A.C., 2001b, MNRAS, 328, L37
- [3] Allen S.W., Schmidt R.W., Fabian A.C., 2002, MNRAS, in press (astro-ph/0111368)
- [4] Arnaud, K.A., 1996, in Astronomical Data Analysis Software and Systems V, eds. Jacoby G. and Barnes J., ASP Conf. Series volume 101, p17
- [5] Bahcall N.A., Ostriker J.P., Perlmutter S., Steinhardt P.J., 1999, Science, 284, 1481
- [6] Balucinska-Church M., McCammon D., 1992, ApJ, 400, 699
- [7] Bennett C. et al. , 1996, ApJ, 464, L1
- [8] Buote D.A., Canizares C.R., 1996, ApJ, 457, 565
- [9] David L.P., Jones C., Forman W., 1995, ApJ, 445, 578
- [10] de Bernardis P. et al. , 2000, Nature, 404, 995
- [11] de Bernardis P. et al. , 2002, ApJ, 564, 559
- [12] Efstathiou G. et al. , 2001, MNRAS, submitted (astro-ph/0109152)
- [13] Ettori S., Fabian A.C., 1999, MNRAS, 305, 834
- [14] Evrard A.E., 1997, MNRAS, 292, 289
- [15] Fabian A.C., 1991, MNRAS, 253, L29
- [16] Freedman W. et al. , 2001, ApJ, 553, 47
- [17] Fukugita M., Hogan C.J., Peebles P.J.E., 1998, ApJ, 503, 518
- [18] Hanany S. et al. , 2000, ApJ, 545, L5
- [19] Jaffe A.H. et al. , 2001, Phys. Rev. Lett., 86, 3475
- [20] Kaastra J.S., Mewe R., 1993, Legacy, 3, HEASARC, NASA
- [21] Kayser R., Helbig P., Schramm T., 1997, A&A, 318, 680
- [22] Liedhal D.A., Osterheld A.L., Goldstein W.H., 1995, ApJ, 438, L115
- [23] Moore B., Quinn T., Governato F., Stadel J., Lake G., 1999, MNRAS, 310, 1147
- [24] Navarro J.F., Frenk C.S., White S.D.M., 1997,ApJ, 490, 493
- [25] O’Meara J.M., Tytler D., Kirkman D., Suzuki N., Prochaska J.X., Lubin D., Wolfe A.M., 2001, ApJ, 552, 718
- [26] Pen U., 1997, NewA, 2, 309
- [27] Perlmutter S. et al. , 1999, ApJ, 517, 565
- [28] Riess A.G. et al. , 1998, AJ, 116, 1009
- [29] Sasaki S., 1996, PASJ, 48, L119
- [30] Schmidt R.W., Allen S.W., Fabian A.C., 2001, MNRAS, 327, 1057
- [31] Stompor R. et al. , 2001, ApJ, 561, L7
- [32] White D.A., Fabian A.C., 1995, MNRAS, 273, 72
- [33] White D.A., Jones C., Forman W., 1997, MNRAS, 292, 419
- [34] White S.D.M., Frenk C.S., 1991, ApJ, 379, 52
- [35] White S.D.M., Navarro J.F., Evrard A.E., Frenk C.S., 1993, Nature, 366, 429.