Star-Formation Rates of Local Blue Compact Dwarf Galaxies I: 1.4 GHz and 60 m luminosities
Abstract
We determine and examine the star-formation rates of 50 well known, local Blue Compact Dwarf (BCD) galaxies based on their 1.4 GHz and 60 m luminosities. We find that in cases for which both radio and far-infrared luminosities are available, the resulting star-formation rates agree extremely well with one another. We determine that the star-formation rates of the BCD galaxies in our sample span nearly five orders of magnitude, from approximately a few times 10-3 to several times 101 M⊙ yr-1, with a median SFR of about 0.3 M⊙ yr-1. We discuss trends of metallicity (primarily oxygen abundance) with star-formation rate, and explore the connections between SFR and galaxy mass estimates.
1 Introduction
Blue Compact Dwarf (BCD) galaxies provide evidence that isolated, small, low-metallicity galaxies may experience vigorous star formation in the present epoch, challenging our current understanding of galaxy formation. The very nature of BCDs remains puzzling in spite of thirty years of research since they were first recognized as an interesting class of galaxy (Sargent & Searle, 1970). For instance, it is still debated whether some “primeval” BCDs are perhaps in the process of undergoing their very first starburst, or whether BCDs undergo several episodic starbursts separated by long quiescent intervals, what triggers the star formation in BCDs, and whether starburst-induced supernova-driven winds can cause the transformation of BCDs into one of the other known types of dwarf galaxy (Kunth & Östlin, 2000, for a recent review). While star-formation rates (SFRs) are central to discussions of the evolution of BCDs, there are surprisingly few quantitative SFRs for BCDs available in the literature.
The earliest and most quoted quantitative SFRs are based on direct measures of the ultraviolet luminosity of massive stars in formation. Fanelli et al. (1988) modeled the International Ultraviolet Explorer spectra of seven BCDs. The implied SFRs for a Salpeter initial mass function (IMF) with index 2.35 and mass cutoffs at 0.1 and 100 M⊙ (which we adopt for all measurements given in this paper) range from about to 25 M⊙ yr-1.
Subsequent efforts preferentially used the reprocessed ultraviolet radiation of massive stars as measures for BCD SFRs, derived from either dust, or ionized gas emission. Sage et al. (1992) investigated a sample of 15 BCDs, and derived SFRs based on far-infrared (FIR) and H luminosity. Their values range from about 0.1 to 30 M⊙ yr-1. Popescu et al. (1999) studied the SFRs of a sample of 48 compact star-forming dwarf galaxies in voids. Using spectroscopically derived Hβ luminosities, they determined values that range from 0.02 to 2.2 M⊙ yr-1, with a mean SFR of about 0.5 M⊙ yr-1. Most recently, Izotova et al. (2000) derived the SFRs of 27 BCDs from the Second Byurakan Survey (SBS). Their SFRs are based on FIR (60 m) and radio continuum (1.4 GHz) luminosities. The SFRs derived from FIR luminosity span the range from about 0.9 to 80 M⊙ yr-1. Radio luminosities were converted to SFRs assuming that the continuum is due to thermal, free-free emission. These SFRs range from approximately 2.5 to 270 M⊙ yr-1, with a mean of about 18 M⊙ yr-1.
The values available in the literature suggest that the SFRs of BCDs might vary over five orders of magnitude, from 10-3 to 102 M⊙ yr-1. However, the mean SFRs given in the existing investigations are noted to also vary over two orders of magnitude, from M⊙ yr-1 to 10 M⊙ yr-1. It is therefore not clear whether and to what extent the wide range of BCD SFRs results from the use of different techniques, assumptions, or sample selections, employed in the available studies. Clearly, a systematic exploration of the parameter space of BCD SFRs is both warranted and timely. Accurate SFRs are needed before any correlations of the SFR with other physical properties can be discussed.
This paper is meant to be a first step toward establishing a baseline of systematic, quantitative SFRs for BCDs. It was motivated by our desire to measure the SFRs of BCDs using a uniform approach and by employing techniques that are prone to minimal systematic errors. Specifically, as star-formation may occur throughout BCDs and not just in their very active centers, we excluded spectroscopic methods. These require corrections for the (unknown) amount of flux missed outside of the aperture. We also wanted to use a measurement that is free from the potentially large and uncertain corrections imposed by internal and foregound dust extinctions. This immediately also ruled out ultraviolet continuum and optical emission line indicators of the SFR. We therefore decided to examine the SFRs of BCDs based on their radio continuum and FIR luminosities. Fortunately, public databases of FIR and radio flux densities that include BCDs are readily at hand. For completeness, and to investigate the extent of and role played by obscuration in our sample, a subsequent study to be presented in Paper II will explore the SFRs derived from very wide-slit H spectroscopy.
2 Sample selection
The sample under investigation consists of 50 of the most well known and well studied BCDs. It is in this regard that our sample consists of “typical” BCDs, and that the resulting SFRs are called “typical”. By no means does this investigation present an unbiased or a complete sample of BCD SFRs. The present sample comes from those BCDs that have been well studied because they were used to derive the primordial helium abundance, and have been taken from a recent compilation of 54 objects (Izotov & Thuan, 1999, hereafter IT). For all of these galaxies, accurate redshifts, needed to calculate luminosities, are available. The BCDs in this sample also have careful determinations of the oxygen abundance of the ionized gas. Since oxygen is produced by massive stars, and since massive stars are used as a quantitative measure of the SFR, a particular emphasis of the present paper is to investigate any correlations between these two quantities.
Observational information for the galaxies in this study is presented in Table 1. This contains positions (J2000), m flux densities from IRAS (Infrared Astronomical Satellite) catalogues, GHz flux densities from the NVSS (NRAO VLA Sky Survey) and FIRST (Faint Images of the Radio Sky at Twenty centimeters) catalogues and images, and heliocentric velocities. Much of this information was obtained from NED111The NASA/IPAC Extragalactic Database (NED) is operated by the Jet Propulsion Laboratory, California Institute of Technology, under contract with the National Aeronautics and Space Administration.. Four of the galaxies in Table 1, Mrk 71, SBS 1319+579, SBS 1331+493 and SBS 1533+574, were split into multiple components for their metallicity measurements (Izotov & Thuan, 1999, their Table 1, which has 54 entries). Since the m (IRAS) and 1.4 GHz (NVSS) flux densities do not have fine enough resolution to distinguish between these components, these galaxies are treated as single objects in the current study. The metallicities (shown in Table 2) for those objects are the average of the values measured for the individual components (IT), while the errors reflect the ranges in values.
2.1 Distances and flux densities
The majority of the 50 BCDs in the sample had their distances estimated based on heliocentric velocities taken from NED. The velocities given in NED were derived from emission line or HI measurements made predominantly by Izotov, Thuan and collaborators (Thuan et al., 1999a; Izotov & Thuan, 1998; Izotov et al., 1997, 1994), or taken from the RC3 (de Vaucouleurs et al., 1991). In cases where velocities for several components were listed, we assumed the velocity that is associated with the main body or main component of the galaxy. Distances for all but three of our sample were estimated from velocities by using a Virgocentric flow model (Kraan-Korteweg, 1986). We adopted a Hubble constant of km s-1 Mpc-1 (Freedman et al., 2001) and a Virgo distance of Mpc (Tonry et al., 2001). The three exceptions, where distances were estimated from analysis of the I-band brightness of tip of the red giant branch (TRGB) stars in color-magnitude diagrams (CMDs) of stellar populations, are UGC 04483 (Dolphin et al., 2001), VII Zw 403 (Schulte-Ladbeck et al., 1999) and Mrk 0209 (I Zw 36) (Schulte-Ladbeck et al., 2001a). We present histograms showing the distributions of distances and heliocentric velocities for our BCD sample in Figure 1.
The ratios of the distances from the Virgocentric flow model to the TRGB distances for UGC 04483, VII Zw 403 and Mrk 0209 are 1.69, 0.23, and 1.2, respectively. This indicates a considerable misjudgment of the distances based on velocities and the Virgocentric flow model is possible. We believe that distance errors can potentially amount to up to a factor of a few, but probably do not exceed an order of magnitude. It is this difficulty in assessing distance errors that led us to omit errors on the SFRs derived below.
2.1.1 IRAS
The Infrared Astronomical Satellite has proved an immensely valuable resource in exploring the infrared properties of galaxies since its launch in 1983. IRAS products include 60 m flux densities for galaxies from the Point Source Catalog (brighter than about 0.5 Jy) and Faint Source Catalog (typically brighter than 0.2 Jy). These fluxes were obtained for the BCD sample, where available, from NED and from the IRSA222The NASA/IPAC Infrared Science Archive is operated by the Jet Propulsion Laboratory, California Institute of Technology, under contract with the National Aeronautics and Space Administration. See http://irsa.ipac.caltech.edu/ ISSA image server and catalog overlay service. The resolution of the IRAS images at 60 m is about with typical positional accuracies better than . Of the 50 BCDs in our sample 18 are detected at 60 m by IRAS. We have not made direct measurements for the flux density upper limits of the non-detections, but for most of these the 0.2 Jy limit of the Faint Source Catalog should be indicative.
2.1.2 NVSS
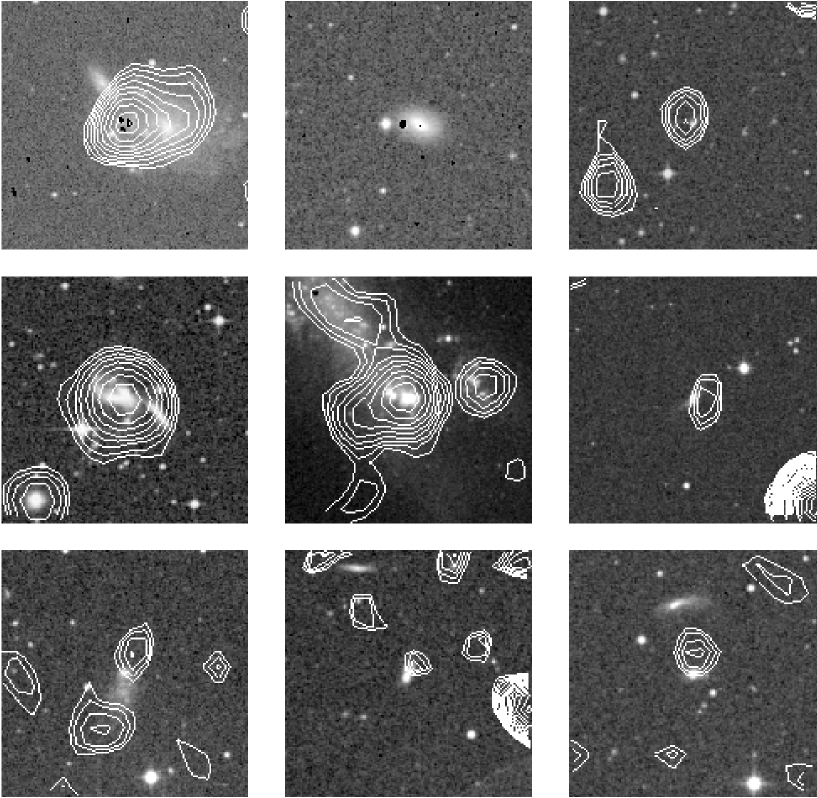
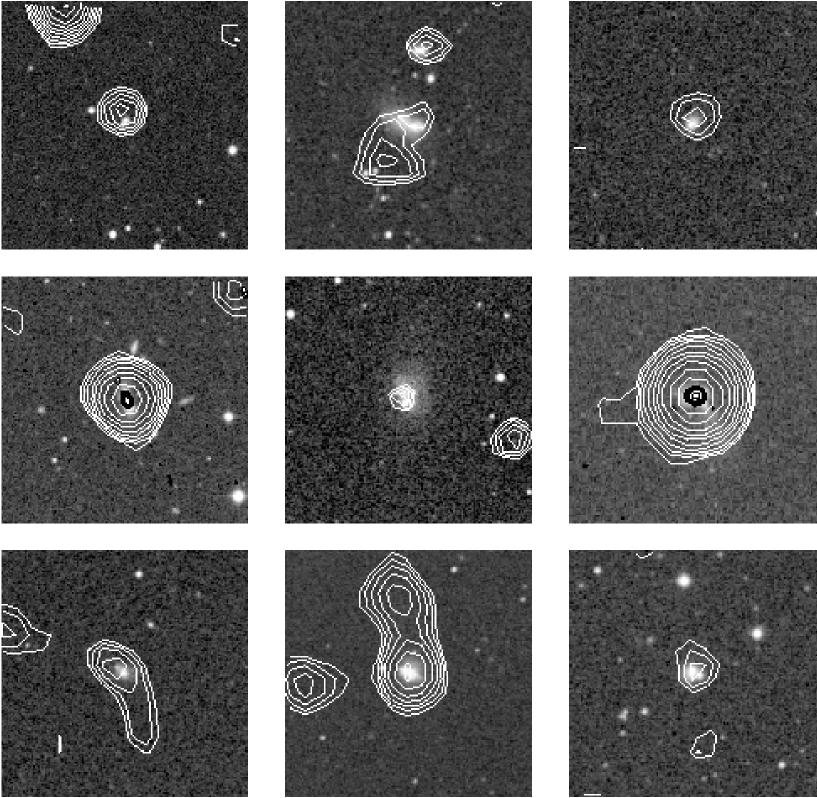
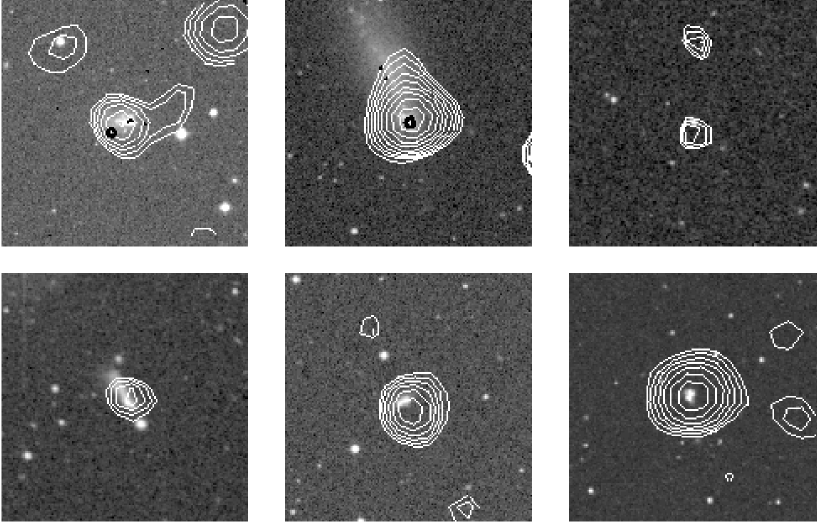
The NRAO VLA Sky Survey (Condon et al., 1998) is a 1.4 GHz radio continuum survey covering the sky north of declination, made using the Very Large Array (VLA) operated by the National Radio Astronomy Observatory (NRAO). The observations were made using the compact D and DnC configurations of the VLA. The resulting images have an rms noise level of about 0.5 mJy beam-1 and a FWHM resolution of . Positional accuracies (from the source measurements using a gaussian fitting algorithm) range from about for sources stronger than 15 mJy to at the survey limit. The catalog lists sources detected above a peak brightness of 2 mJy beam-1. For 13 of the galaxies in our BCD sample an NVSS catalog source is close enough () to be a probable identification, and the flux measurement from the catalog was taken. For another 10 of the sample galaxies, where the NVSS FITS image showed a local peak in intensity at the position of the galaxy, but no catalog source was present, we performed our own source measurements. We used the miriad (Multichannel Image Reconstruction, Image Analysis and Display) task sfind (Hopkins et al., 2002) to make these measurements, and the sources so detected are typically at the level. For non-detections, we measured the local rms noise level in the vicinity of the BCD galaxy and adopted 5 times this value as the upper limit on the NVSS flux density. Uncertainties in the flux density measurements of the NVSS catalogue have been described in detail (Condon et al., 1998, see also their Figure 31). In practice, these uncertainties rise from at flux densities of 10 mJy to close to the survey limit. These uncertainties translate to uncertainties in estimated star-formation rates (see Section 3). Digitized Sky Survey333The Digitized Sky Surveys were produced at the Space Telescope Science Institute under U.S. Government grant NAG W-2166. The images of these surveys are based on photographic data obtained using the Oschin Schmidt Telescope on Palomar Mountain and the UK Schmidt Telescope. The plates were processed into the present compressed digital form with the permission of these institutions. images have been overlayed with 1.4 GHz contours from NVSS for each of the 23 detected BCDs (Figure 2).
2.1.3 FIRST
FIRST, Faint Images of the Radio Sky at Twenty centimeters (Becker et al., 1995), is a 1.4 GHz radio continuum survey currently covering about 8500 square degrees of the North Galactic Cap. The observations were taken using the VLA in B configuration. The images have a typical rms noise level of 0.15 mJy with a FWHM resolution of . Source positional accuracies vary from at the 3 mJy level to about for the faintest sources. The source detection threshold of the survey is 1 mJy. Because of the much higher resolution of FIRST compared to NVSS, some unresolved NVSS objects are resolved by FIRST into more than one component (UM 311 is one example). In this case we have taken the sum of the FIRST flux densities for the individual components as the FIRST measurement for the whole source. From the FIRST catalog, 6 galaxies were matched with our BCD sample, and we obtained upper limits from the FITS images for another 14. The flux density upper limits are again taken to be 5 times the local rms value. The remaining 30 BCDs lie outside the area of the FIRST survey. 1.4 GHz contours from FIRST are shown on the images in Figure 2 for each of the 6 detected BCDs.
An important advantage from the higher resolution of FIRST images is being able to identify the positional origin of the radio emission with greater accuracy than allowed by NVSS. The different resolutions are similarly an important effect to account for if calculating SFR per unit area, and also allow for distinguishing between the object of interest and confusing background sources. In the case of Mrk 0209, for example, the FIRST emission appears to originate slightly to the SE of the region of brightest optical emission. This may initially suggest a background source for the radio emission, but the strong consistency between the radio-derived SFR and numerous other optically-derived values for this galaxy, (Schulte-Ladbeck et al., 2001a, see also discussion in Section 5.1), argue that in fact this radio source is likely to be a star-forming knot in the outskirts of Mrk 0209. Similarly, CG 0798 shows a double-peak in the NVSS emission, and a FIRST source about an arcminute to the south of the galaxy accounts for some of this emission. Lacking more detailed observations, it is certainly possible that this may be a coincidental background source and the radio flux-density and the derived SFR for CG 0798 should strictly be treated as upper limits. Given the good agreement between the radio and FIR SFRs for this galaxy, however, we have chosen to treat it as a detection for the current analysis.
3 Star-formation rates
To avoid the effects of both spectroscopic flux losses and uncertain obscuration corrections, we use 1.4 GHz and 60 m luminosities as estimators of the star-formation rate for galaxies in our BCD sample. Here we adopt the calibrations
| (1) |
(Cram et al., 1998; Condon, 1992) for the SFR derived from the m luminosity, and
| (2) |
(Haarsma et al., 2000; Condon, 1992) for the SFR from the 1.4 GHz luminosity. In both cases the factor of 5.5 converts from the mass range M⊙ to the mass range M⊙, assuming a Salpeter IMF (Haarsma et al., 2000, for example). Also, Haarsma et al. (2000) point out that starburst galaxies may have IMFs that differ from the one adopted in Equation 2. In the worst case a maximum decrease of the SFR by a factor around 5 is possible. Any changes to the slope of the IMF, however, should affect the radio and FIR luminosities equally. The SFRs calculated for our BCD sample are given in Table 2 along with the distances to the galaxies. The metallicities (oxygen abundance) also shown have been taken from IT. HI masses have been derived using HI flux densities from the literature with the distances given here, and are also shown in Table 2.
Distance uncertainties (possibly up to a factor of a few) are the dominant source of measurement uncertainty for the SFRs. For this reason, the Figures below do not include error bars on the SFRs. Histograms showing the distribution of the derived SFRs for our sample are presented in Figure 3. We also do not calculate SFR normalized to the optical area of the galaxy. This is firstly because of the complex optical morphologies for the objects in our sample (see Figure 2). Secondly, the galaxies in our sample are essentially point sources for the m and 1.4 GHz detections. Instead, we investigate below the properties not only of the total SFR, but also of the “specific SFR” by which we mean the SFR normalized by HI mass. This is a distance-independent quantity, and a probe of relative star formation that should be reasonably independent of galaxy size or mass. Details of the specific SFRs and HI masses are given in Section 4 below.
The above calibrations of SFR from luminosity are derived independently of metallicity, although it is worth noting that the 1.4 GHz calibration is based on the observed Galactic relation between supernova rate and nonthermal radio luminosity. An implicit assumption in the case of estimating SFR from the 1.4 GHz luminosity is that there is no contribution from an active nucleus (Seyfert or LINER activity) to the radio emission. This assumption seems to be justified for the sample of BCDs we are investigating, since all of them have HII-like spectra.
4 Results
The NVSS catalog yields flux densities for a significant fraction of our sample. Table 2 and Figure 3 show that the SFRs derived from NVSS fluxes cover almost five orders of magnitude. Clearly, there are real differences in BCD SFRs, since the range seen is much larger than the potential distance uncertainties. From the 23 NVSS-detected objects we calculate a median SFR of 0.27 M⊙ yr-1. This compares well with the median SFR, 0.36 M⊙ yr-1, of the 18 IRAS-detected BCDs. The IT sample of BCDs being examined, however, is likely closer to being a flux-limited than a volume-limited sample, favoring more luminous galaxies with higher SFRs, and the NVSS sensitivity limit strengthens this bias. Given that the radio and FIR detections are subject to such Malmquist bias, artificially raising the median value, the median SFR quoted above should not be over-interpreted. To provide some perspective, an approximate uncertainty for this median can be estimated by examining the range of SFRs spanned by the galaxies either side of Mrk 1416 (having the median SFR). This gives a range of an order of magnitude, from 0.13 to 1.3 M⊙ yr-1.
Figure 4 shows the comparison between SFRs derived from 1.4 GHz (FIRST and NVSS) and 60 m luminosities. A good agreement exists between the NVSS-based 1.4 GHz SFRs and the IRAS-based 60 m SFRs. It is evident from Table 1 and this Figure that the FIRST flux densities tend to be systematically lower than those from the NVSS for most of the galaxies detected by both surveys. This is also true for many of the FIRST upper limits where an NVSS detection exists. The probable reason for this is the difference between the two surveys in their sensitivity to extended emission. FIRST, made using the VLAs B-array, has much higher angular resolution than NVSS, made with the more compact D and DnC arrays, but at the expense of sensitivity to more extended emission. FIRST images are typically only sensitive to structure extended over less than about , while the NVSS images will detect emission from sources up to about across (Perley, 2000). As a result the NVSS flux density measurements tend to be somewhat larger than those from FIRST, since many of the galaxies in our sample are larger than the extent over which FIRST is most sensitive. In subsequent analysis where 1.4 GHz-derived SFRs are used we thus rely on SFRs derived from NVSS measurements, both for this reason and also since more of our sample galaxies have NVSS detections.
Figure 5 presents SFR1.4GHz as a function of distance. The NVSS detection threshold is marked. As may be expected from the tight relation in Figure 4, a diagram showing SFR60μm versus distance is very similar. An interesting point to note from this Figure is the absence of any moderate to high SFR objects closer than Mpc, that is, in the region where Hubble Space Telescope (HST) observations (with WFPC2 or NICMOS instruments) are judged able to resolve individual stars within the target galaxies. This is mainly a result of high SFR objects having lower space-densities than low SFR galaxies, combined with the small volume being probed at this distance. The implication here is that HST-based CMD investigations of nearby galaxies are restricted to lower-SFR objects, in good agreement with the low SFRs derived from CMD modeling.
The 1.4 GHz flux on which SFR1.4GHz is based is thought to measure the present-day SFR on a similar timescale as the lifetime of massive stars (Condon, 1992). We now explore the correlation between various chemical abundances from IT and absolute and specific SFR. The chemical elements that we emphasize are associated with progenitors of different masses, and this translates into different enrichment timescales. Specifically, oxygen is produced by massive stars and returned quickly to the interstellar medium (ISM) by way of supernova (SN) type II explosions, nitrogen is thought to be produced in intermediate-mass stars and returned to the ISM in the asymptotic giant branch (AGB) wind phase (but see IT for a contrary view), while iron is considered to reflect the ISM’s pollution by low mass stars through SN Ia events, and should lag the most behind the oxygen enrichment.
In the top panel of Figure 6 a weak positive trend of 12+log(O/H) (from IT) with absolute SFR1.4GHz can be seen. The Spearman rank test shows that the null hypothesis (no correlation between 12+log(O/H) and log(SFR)), using only the detections, has a probability of only about 0.6%. An unweighted linear regression yields 12+log(O/H) = 0.09log(SFR) + 7.90 (with the uncertainty of the slope being = 0.04 and the uncertainty of the intercept being = 0.05). The extremely metal-poor galaxies I Zw 18 and SBS 0335052 lie well away from the trend shown by the majority of the sample, effectively lowering the intercept. If we exclude I Zw 18 and SBS 0335052 from the sample, than the Spearman rank correlation coefficient increases slightly, and the probability of a chance correlation drops to just below 0.5%, while the linear regression gives 12+log(O/H) = 0.09log(SFR) + 7.96 (with = 0.03 and = 0.03). It is this linear fit that is shown in Figure 6 as a solid line, with the dashed lines reflecting the error in the intercept. (Notice the fit results reported here are slightly different from the preliminary results of Schulte-Ladbeck et al. (2001b) because here we use more up-to-date values for the Hubble constant and the Virgo distance.) We conclude that BCDs with high present-day total SFRs clearly also have high oxygen abundances.
If we replace absolute SFRs with specific SFRs (i.e. SFR/MHI) a weak positive trend seems to remain (HI masses are discussed below). The Spearman rank test, however, indicates the hypothesis that 12+log(O/H) and log(SFR/MHI) are correlated has a 15% probability of occuring by chance. As a result it seems there is little correlation, if any, between oxygen abundance and SFR/MHI.
In the middle panel of Figure 6 a weak positive trend of log(N/O) (from IT) with absolute SFR can be seen. The extremely metal-poor galaxies I Zw 18 and SBS 0335052 do not distinguish themselves on this plot, lying well within the distribution of values. The Spearman rank test shows that the probability for a chance correlation is about 0.7%. A linear regression yields log(N/O) = 0.09log(SFR) 1.42 (with = 0.02 and = 0.03). Conversely, the Spearman rank test for log(N/O) with the logarithm of the specific SFR, log(SFR/MHI), shows the probability for a chance correlation is 5%.
Lastly, we investigate the dependence bewteen [O/Fe] (from IT) and log(SFR) or log(SFR/MHI) (see bottom panel of Figure 6). The Spearman rank test gives such small correlation coefficients that the data are likely to be uncorrelated. The linear regression of [O/Fe] on log(SFR) results in a constant, [O/Fe] = 0.43 (with = 0.04 and = 0.04). Figure 6 shows that SBS 0335052 is quite removed from the rest of the sample BCDs, but I Zw 18 lies well within the distribution.
Figure 7 explores the dependence of various quantities on galaxy mass. The width of the HI emission line profile at 20% of peak, W20, is taken as an indicator of galaxy total mass. HI profile widths are often used to calculate galaxy total masses, but require radii and inclinations. As can be seen from Figure 2, radii and inclinations are difficult to judge for BCDs because the star-forming regions dominate their appearance. W20, on the other hand, also may not be a solid indicator for rotational velocity if turbulent motions are significant.
With these caveats in mind, we plot in the upper panel of Figure 7 the HI mass versus the W20 velocity. HI and W20 data were taken from Thuan et al. (1999a) (circles) or Thuan & Martin (1981) (triangles). The Spearman rank correlation coefficient of log(MHI) and log(W20) is high, indicating a less than 0.05% probability that this is a chance correlation. In other words, we can be confident that HI mass increases as total mass increases. A linear regression gives log(MHI) = 3.6log(W20) + 1.3 (with = 0.6 and = 1.3), and is shown in Figure 7.
The Spearman rank test for total SFR and total mass rejects the null hypothesis; correlation by chance has about a 0.5% probability (middle panel of Figure 7). The linear regression is log(SFR) = 4.8log(W20) 10.5 (with = 1.0 and = 2.0). The higher SFRs are clearly being hosted by higher mass galaxies, although there is a significant scatter in the trend (for a given rotational velocity or total mass, the SFR may vary over more than an order of magnitude).
Finally, we also investigate the correlation between metallicity and total mass. The lower panel of Figure 7 shows that the lowest metallicity objects, such as I Zw 18 or SBS 0335052, do not have the lowest rotational velocities. Indeed the Spearman rank test indicates that the probability of a chance correlation between 12+log(O/H) and log(W20) is quite high, almost 10%. A higher total mass does not necessitate a higher oxygen abundance.
Figure 8 shows the variation of SFR1.4GHz with HI mass. The data were taken from Thuan et al. (1999a) (circles) and from Thuan & Martin (1981) (triangles). Because of our interest in extremely low-metallicity objects, and because it is one of the BCDs with a TRGB distance, we added UGC 04483 to the Figure, using the HI flux from Huchtmeier & Richter (1986). This data point is shown as a square. The higher SFRs are clearly being hosted by galaxies with higher HI masses although there is a significant scatter in the trend (again, as with W20, for a given HI mass the SFR may vary over more than an order of magnitude). This scatter is reflected in the wide range of timescales for gas consumption, from 0.3 Gyr to more than 10 Gyr, indicated by the solid lines in Figure 8. I Zw 18 and SBS 0335052 do not stand out in any way from the rest of the sample in this picture.
The results can be summarized as follows:
-
1.
The median SFR in the IT sample is 0.3 M⊙ yr-1 (with an uncertainty up to a factor of three or so, and it may be an upper limit due to Malmquist bias).
-
2.
Total SFRs in the IT sample range over at least four orders of magnitude.
-
3.
SFRs calculated from IRAS and from NVSS data are consistent with SFR60μm = SFR1.4GHz, i.e., these galaxies obey the FIR/radio correlation valid for large spirals.
-
4.
While BCDs in this sample are close, z0.06, there is still a lack of high-SFR galaxies within the range of HST single-star photometry (about 10 Mpc). This is because such objects have space densities low enough that they are unlikely to appear in the small volume probed out to this distance.
-
5.
We find a high probability of a positive correlation between 12 + log(O/H) or log(N/O) and total SFR, but [O/Fe] and total SFR appear to be uncorrelated. For all three element abundances, the probability of a correlation with SFR/MHI (a distance-independent quantity) is low.
-
6.
Taking W20 as an indicator of total mass, we find a high probability for a positive correlation between HI mass and total mass, and between total SFR and total mass. The probability for a correlation of metallicity and total mass, on the other hand, is small.
-
7.
The “typical” timescale for gas consumption in the IT BCD sample is a few Gyrs. None of these galaxies is in danger of running out of gas in the very near future. However, these BCDs will die sooner than the typical dwarf Irregular galaxy.
5 Discussion
5.1 The Far-Infrared/Radio Correlation for BCDs
We find excellent agreement between SFR60μm and SFR1.4GHz using the calibration equations of Condon (1992), Cram et al. (1998), and Haarsma et al. (2000). Specifically, and as shown by Figure 4, the data are consistent with SFR60μm = SFR1.4GHz. This consistency, however, does not necessarily imply that the correct SFR has been determined. As an independent check of the SFRs from FIR and radio luminosities we compare them with results from modeling of color-magnitude diagrams. CMD studies have their own but different set of limitations, in terms of sensitivity, color biasing, and fractional galaxy area observed. We have only two cases in the IT sample for which there are both distances and present-day SFRs available from single-star photometry. For VII Zw 403, SFRM⊙ yr-1 and SFRM⊙ yr-1, while CMD modeling of HST/WFPC2 V and I photometry yields 0.0110.008 M⊙ yr-1 (Crone et al., 2002). For Mrk 209 (I Zw 36) the SFR1.4GHz is M⊙ yr-1, whereas HST/NICMOS J and H data were modeled to yield a SFR of M⊙ yr-1 (Schulte-Ladbeck et al., 2001a). We conclude that CMD modeling validates the FIR and radio SFRs to the extent that it is possible with the limited amount of data.
Astrophysical interpretations of the FIR/radio correlation suppose that both types of emission have their origin in newly forming massive stars. The FIR emission originates from the heating of dust by UV radiation, while the radio emission is produced by synchrotron radiation from cosmic ray electrons accelerated by shocks associated with supernova remnants (Xu, 1990). Both SFR60μm and SFR1.4GHz are considered to be measures of the present-day SFR. The synchrotron component of the radio emission is thought to dominate for a star-forming galaxy observed at 1.4 GHz, with a much smaller contribution from the thermal Bremsstrahlung of the HII regions. With a typical synchrotron spectrum for the nonthermal component (), less than of the total 1.4 GHz flux is thermal (Condon, 1992). Equation 2 above makes the assumption that supernovae generate similar amounts of radio luminosity to that observed in our own Galaxy, and the detection of any nonthermal radio luminosity in external star-forming galaxies implies the presence of magnetic fields.
The calibration above for SFR1.4GHz differs from the calibration given by Izotova et al. (2000). Izotova et al. studied SFRs in a sample of BCDs drawn from the Second Byurakan survey, but they find SFR SFR60μm. Their calibration for SFR1.4GHz from 1.4 GHz luminosity makes the assumption that the radio emission is purely thermal, although they acknowledge that a significant part of the 1.4 GHz radio emission should be nonthermal emission related to supernova events. This explains their overestimation of 1.4 GHz luminosity derived SFRs. The calibration for SFR60μm given by Izotova et al. also differs slightly from the one adopted above (but see discussion of SFRFIR calibrations given by Kennicutt 1998). It can easily be shown that the objects in the sample of Izotova et al. follow the FIR/radio correlation, and indeed the SFRs derived for their sample by using the calibrations of Equations 1 and 2 result in highly consistent SFRs from both m and 1.4 GHz luminosities.
There are suggestions that the thermal component of the radio luminosity in BCDs is larger than that typical for normal spirals. Klein et al. (1991) found the radio spectra of BCDs are generally flatter than those of spiral galaxies. They comment that they find it surprising that BCDs do follow the same FIR/radio correlation as do normal spirals, given the strongly varying SFRs in BCDs (further discussed below) and the lack of cosmic-ray confinement. They suggest that a lower ratio of nonthermal-to-thermal radio emission in BCDs could be offset by a similar deficiency in FIR emission. Deeg et al. (1993) re-observed a few of these BCDs and also found a variety of shapes for their radio spectra, but conclude that a nonthermal component is present in most. Clearly, these data suggest that the radio spectra of BCDs at 1.4 GHz have differing amounts of nonthermal-to-thermal emission, hence it is indeed surprising that our investigation yields identical FIR and 1.4 GHz SFRs when the calibrations of Equations 1 and 2 are applied. There are no linear radio polarization observations of BCDs in the literature, and therefore we have no direct measurements of their large-scale magnetic fields. The presence of a one-to-one FIR-radio correlation in our BCD sample suggests that magnetic fields in these systems need to be of at least sufficient strength to extract synchrotron radiation from relativistic electrons accelerated by supernova remnants.
The conversion of luminosity to SFR60μm rests on the assumption that dust absorbs well in the UV, and that it re-radiates effectively in the IR, so that the ultraviolet radiation of massive, young stars is absorbed and re-emitted as FIR luminosity. Clearly the conversion factor must depend on the amount of dust present. There has been a persistent notion in the literature that metal-poor dwarf galaxies are virtually dust free. This is not the case. We emphasize that although our Table 2 shows no FIR detections for I Zw 18 and SBS 0335052, it is now known that both contain appreciable amounts of dust (Thuan et al., 1999b; Dale et al., 2001; Cannon et al., 2001). In any event, for the SFR60μm/SFR1.4GHz ratio to be unity, it is not as much the total amount of dust in dwarfs that matters, but rather, that there is sufficient dust to produce a FIR luminosity that offsets the radio luminosity. This idea supports the suggestion that the local properties of individual star-forming regions are more important in generating the FIR/radio correlation than the global properties of the galaxies that host them.
Is metallicity likely to affect the calibrations of SFR to luminosity? Lisenfeld & Ferrara (1998) discuss dust-to-gas ratios as a function of metallicity in dwarf galaxies. Hirashita et al. (2001) incorporate metallicity into the conversion factor, and find it can vary by about a factor of 5 through differences in dust content (dust-to-gas ratios) between our Galaxy and others. In order to investigate whether there is any metallicity bias in the SFRs we derived for BCDs, we display in Figure 9 SFR1.4GHz/SFR60μm versus 12+log(O/H). This ratio spans a range of about 0.3 to 1.8 for metallicities of 12+log(O/H) = 7.7 to 8.3. As can be seen from this Figure we do not have measurements at both frequencies for a number of the extremely metal-poor objects. For three objects with a m detection but a 1.4 GHz upper limit, we see upper limits to this ratio between 0.8 and 1.5. For six objects with 1.4 GHz detections but m upper limits, this ratio shows lower limits ranging from 0.6 to 2.5. Both I Zw 18 and SBS 0335052 fall into the latter category and have lower limits of 1.5. The mean metallicity of the detected sample is 12+log(O/H) = 7.98. IT use the scale on which the Sun has 12+log(O/H) = 8.91, so we are effectively exploring the FIR/radio correlation at about 0.1 of the solar metallicity. In our sample, the mean SFR1.4GHz/SFR60μm is 1.020.40, identical to the expected value of 1. No trend with metallicity is seen.
In starburst galaxies with highly episodic star-formation histories (SFH), a time-delay between the maximum of the FIR and the nonthermal radio emission has been hypothesized (Lisenfeld et al., 1997). Thermal radiation and re-radiation respond instantaneously to the presence of newly born massive stars, whereas nonthermal radiation does not occur until the end of the life of massive stars, when they explode as SNe, some 107 yrs later. If time-delays were important we would expect a large scatter of SFR1.4GHz/SFR60μm about the mean, depending on exactly when we observe a galaxy in its changing SFH. Indeed, BCDs might be suspected of this effect if they experience highly episodic starbursts, whereby very short bursts (of about 3.5 Myr, Mas-Hesse & Kunth, 1999) are separated by very long quiescence periods of a Gyr or more (but see Schulte-Ladbeck et al., 2001a). Weilbacher & Fritze-v.Alvensleben (2001) recently modeled the size of the offset in the H luminosity to SFRHα calibration that would arise due to episodic starbursts. The conversion factor ranges over two orders of magnitude for the benchmark SFHs that they explore. We observe a 1 variation of 0.40 about the mean ratio for SFR1.4GHz/SFR60μm, a much smaller scatter, although we admittedly are investigating an incomplete sample. It is possible that time-delay effects contribute to this scatter about the mean, but they clearly do not dominate the conversion factor.
To summarize, our finding of a metallicity-independent FIR/radio ratio of unity implies that the conversion factors that are currently being used to turn FIR and radio luminosity to SFR seem to remain valid at 0.1 of the solar metallicity. (In Paper II, we shall explore the conversion factor that translates H luminosity to SFRHα for these objects.) We also infer that BCDs are required to have supernova rates, radio luminosities per SN, magnetic fields, and dust contents in some scaled proportion to those of the large spirals, to which the FIR and radio calibrations were originally tailored.
5.2 SFR, Metallicity, and Mass
A major difficulty for chemical evolution models of BCDs has been to explain their low oxygen abundances in spite of their active star formation. In this section we confront the data assembled here with current theoretical models for dwarf galaxy evolution.
We see a correlation of HI gas mass with total mass, and between total SFR and total mass, in the sense that galaxies with more total mass also have a higher gas mass, and support a higher present-day SFR. This comes as no surprise since the large range of SFRs among different galaxies is attributed in part to the large range in galaxy masses (Kennicutt, 1998). We see a broad trend of increasing SFR with increasing HI mass, but there is also a wide range of SFRs for a given HI mass. This is explained as being due to different gas-consumption timescales. Here we have a hint of some variation in the physical properties of BCDs. The gas depletion timescale of BCDs in the IT sample is typically a few Gyrs. This is an order of magnitude shorter than those in the dwarf Irregular sample studied by van Zee (2001). Our data also show a positive correlation between oxygen abundance and SFR, in the sense that galaxies with higher global SFRs also show higher oxygen abundance. This similarly comes as no surprise as the massive stars that are used to gauge the SFR are also the sites of oxygen nucleosynthesis. (However, there is some as yet unsettled discussion in the literature as to whether the oxygen so measured is related to the present generation of stars, or whether it stems from prior ones, e.g. Larsen et al. 2001 and references therein.)
While SFR correlates with total mass and oxygen abundance correlates with SFR, there is no correlation between oxygen abundance and total mass in our sample (see Figure 7). We further find that SFR/MHI versus HI mass shows little correlation, if any, and we also find no correlation between oxygen abundance and SFR/MHI. Lequeux et al. (1979) first presented a relationship between metallicity and total mass for a small sample of Irregular galaxies and two BCDs (I Zw 18 and II Zw 40). Skillman et al. (1989) later derived the well known metallicity-luminosity relation for Irregular galaxies. In Irregular galaxies, the oxygen abundance rises with absolute blue magnitude of the host galaxy (but see Hildago-Gámez & Olofsson, 1998; Hunter & Hoffmman, 1999, for the opposing view). Note that Skillman et al. (1989) excluded BCDs from their sample. The metallicity-luminosity relation is frequently interpreted as a metallicity-mass relation, to the extent that it is now being used to gauge galaxy assembly in the intermediate-redshift Universe (Kobulnicky & Zaritsky, 1999; Carollo & Lilly, 2001). Indeed, there is a general positive correlation across the Hubble sequence of oxygen abundance with MB, that holds for over 10 orders of magnitude in MB (Hunter & Hoffmman, 1999). It is not as yet clear that a metallicity-luminosity relation holds for BCDs alone (Hunter & Hoffmman, 1999, Figure 7). Similarly, our limited data do not support the existence of a mass-metallicity relation for BCDs.
Since the seminal work of Dekel & Silk (1986), the extent to which mass loss affects the evolution of low-mass galaxies has attracted much attention. Such work is particularly interesting since low-mass systems are galactic building blocks in hierarchical scenarios of galaxy formation, and could contribute to the pollution of the intergalactic medium at early epochs. Recent models for dwarf galaxies have addressed the role of dark matter halos for the evolution of low-mass systems. Mac Low & Ferrara (1999) find that mass loss occurs in all galaxies with gas masses below M⊙, but complete loss of gas (blowaway) is possible only for galaxies with very low HI masses, less than a few times 106 M⊙. The HI masses in the IT sample range from several times 106 M⊙, to several times 109 M⊙. They match extremely well the HI mass range to which the models by Mac Low & Ferrara apply. This suggests that some mass loss occurs in all of the BCDs observed here. Mac Low & Ferrara also point out that while the fraction of cool gas lost in dwarf galaxies is generally small, most of the metals mixed with hot gas are able to leave these galaxies. This helps to keep their metallicities low. Ferrara & Tolstoy (2000) re-iterate that even in the presence of a metal-enriched outflow, the predominant mechanism for gas consumption is the conversion of gas into stars, and not mass loss.
Figure 10 shows the relation between oxygen abundance and gas (HI) mass for the IT sample of BCDs. Three dashed lines approximate the models of Ferrara & Tolstoy (2000) for dark-to-visible (HI) mass ratios of 0, 10, and 300, respectively. Our Figure may be compared with the equivalent Figure for gas-rich Irregular galaxies in Ferrara & Tolstoy (2000, their Figure 4). The data for BCDs are generally found to overlap with the model parameters. The BCD sample also shows considerable overlap with the “nearby dwarfs” and “low-surface-brightness dwarfs” samples to which Ferrara & Tolstoy compared their models444A solar oxygen abundance of 12 + log(O/H) , consistent with that used by IT, is assumed for all three samples.. Our data thus lend additional support to the models of Mac Low & Ferrara and Ferrara & Tolstoy. This also means that most galaxies classed as BCDs are dark-matter dominated.
Ferrara & Tolstoy predict total SFRs for a limited choice of parameters. These SFRs are quite small, and allow a variation over a few orders of magnitude, owing to differences in dark-to-visible mass ratios and time evolution. The small global SFRs of BCDs that we measure here are broadly consistent with these predictions, although our median SFRs appear to be an order of magnitude higher than their model predictions, as is the fact that we observe a wide range of SFRs. The effect of Malmquist bias on our sample may partially explain this result, biasing our median SFRs to higher values. Ferrara & Tolstoy emphasize that there is a considerable spread in oxygen abundances for a given HI mass, and that this can be understood because higher dark-to-visible mass ratios cause a stronger gas compression, increase the SFRs, and in doing so, also increase the oxygen abundances. A large difference in dark-to-visible mass ratios among the BCDs can help us to reconcile the lack of correlation for oxygen abundance versus HI mass and oxygen abundance versus W20 while, at the same time, SFR correlates with oxygen abundance and also shows a general trend with HI mass, albeit with much scatter.
5.3 I Zw 18 and SBS 0335052
I Zw 18 and SBS 0335052 once again stand out from the rest of the BCDs in Figure 10. They actually fall in a “forbidden” area of the model parameter space. The fact that the two well-studied extremely metal poor systems lie outside these models (i.e., in the unphysical region below a dark-to-visible mass ratio of zero) reinforces their unusual properties. This discrepancy may be explainable through uncertainties in the HI masses, as, for I Zw 18 and SBS 0335052, these only need to be lowered by 1–2 orders of magnitude to move them close to dark-matter dominated terrain in this Figure. This may be feasible because both I Zw 18 and SBS 0335052 have complex optical and radio morphologies (van Zee et al., 1998; Lequeux & Viallefond, 1980; Pustilnik et al., 2001). If the applicable HI mass is that of the “main body”, then we can lower the HI flux by a factor of 2 or so. A smaller distance will also lower the HI mass (although in the case of I Zw 18 it could not be lowered by more than a factor of 2–3, since otherwise it should be resolved more effectively into individual stars with HST). Independent data on dark-to-visible mass ratios are also somewhat uncertain due to the many assumptions involved. While in the case of I Zw 18, radio observations support a dark-to-visible mass ratio of about 10 (van Zee et al., 1998; Lequeux & Viallefond, 1980), the dynamical mass of SBS 0335052 is only about 2–5 times that in gas and stars (Pustilnik et al., 2001). In any event, I Zw 18 and SBS 0335052, which are unlikely to be forming their first stars now (Schulte-Ladbeck et al., 2000) yet show oxygen abundances close to the “floor” of 12+log(O/H)7.2 allowed by the models of Ferrara & Tolstoy (2000), could be interpreted as galaxies that have a maximum time-averaged mass-loss rate (since their masses are a few times 108 M⊙) and are thus unable to retain metals effectively.
Figure 4 of Ferrara & Tolstoy contains two galaxies, UGC 04483 and Leo A, with apparently similar properties to I Zw 18 in terms of oxygen abundance, HI mass, and dark-to-visible mass ratio. UGC 04483 is also present in the BCD sample of IT used here. While Ferrara & Tolstoy show it in the “forbidden” region, the smaller distance derived in the meantime from single-star photometry (Dolphin et al., 2001), has resulted in a downward revision of its HI mass. This, combined with the 0.2 dex higher oxygen abundance of IT, has moved UGC 04483 well into the dark-matter dominated regime in our Figure 10.
Ferrara & Tolstoy (2000) present a case study of the SFH and the oxygen enrichment of Leo A. It will be interesting to see whether their model also agrees with the broad parameters of I Zw 18 (and SBS 0335052). One clear difference between Leo A and I Zw 18 (or SBS 0335052), is that the present-day SFR of the former is much smaller, by about 3 (4) orders of magnitude, than the latter.
It is worth recalling the location of I Zw 18 and SBS 0335052 on Figure 6. They appear to be too metal-poor for their SFR, or too intensely star-forming for their oxygen abundance, compared to the rest of the sample. Explaining this offset as an error in the measured SFR is unlikely, requiring the actual SFR of I Zw 18 (for example) to be more than 7 orders of magnitude less than estimated here. The metallicity of I Zw 18 has been the subject of many observations and extensive measurement, and explaining the offset as an error in the measured metallicity is similarly unlikely.
It will be interesting to see whether the models of Ferrara & Tolstoy can reproduce the high SFRs, high gas-mass fractions, and low chemical abundances of I Zw 18 and SBS 0335052. Considering the optical and HI morphologies of I Zw 18 and SBS 0335052, it is possible that these galaxies are involved in an interaction. The models of Ferrara & Tolstoy do not apply to merger situations.
6 Conclusions
We investigated the SFRs of a small (50 objects) but well-defined sample of BCDs, that of Izotov & Thuan (1999). One advantage of studying this sample is that ionized-gas abundances are readily available from the work of this team. In addition, HI fluxes and profiles are in hand for many of the BCDs from the work of Thuan and collaborators. This allows us to investigate correlations between SFR, ionized gas chemistry, HI mass, and total mass. The main results are summarized at the end of Section 4. Here, we draw some conclusions about some of the results that we think have a wider implication.
We find that SFR60μm agrees with SFR1.4GHz in BCDs. This agreement exists over a wide range of SFRs (nearly five orders of magnitude in the sample that we investigate), at low metallicity (on average 0.1 of solar), and at small galaxy masses compared to those of normal spirals. Unless several factors have conspired to yield SFR60μm = SFR1.4GHz in our sample, it is logical to conclude that the calibration relations and their underlying assumptions are valid for BCDs. Furthermore, the existence of this type of scaling relation for a wide range of galaxies with different masses and sizes (from spiral galaxies to late-type dwarfs), and with a wide range of interactions (from merging to isolated), suggests that in terms of the FIR/radio correlation, the local properties of individual star-forming regions are more important than the global properties of the galaxies that host them.
While BCD studies have benefitted greatly from recent advances in far-infrared astronomy, and there is now no doubt that even very metal-poor galaxies living in the present epoch contain dust, very little is known as yet about their radio properties. Radio polarization observations are non-existent but are needed to elucidate the nature of magnetic fields in BCDs. Magnetic field orientations, therefore are not well known. Because the FIR/radio correlation, valid for large spiral galaxies, extends to BCDs, the presence of magnetic fields at some level seems highly likely. The role of magnetic fields is still poorly understood, however, and may contribute to the observed scatter in the FIR/radio correlation.
Color-magnitude diagrams of nearby BCDs can serve as an external check on the validity of the SFRs derived from FIR or radio luminosities. The relevant data are difficult to obtain, since they require very high spatial resolution, and while the few existing data indicate encouraging agreement, additional CMD studies are required. Single-star photometry is, and in the near future will remain, biased toward nearby objects with small SFRs due to instrumental limitations. In Paper II, we shall therefore investigate the SFRs of BCDs in the IT sample using the H luminosities as SFR indicators.
The small scatter in SFRs about the mean FIR/radio ratio supports results of CMD models that show that BCDs do not have highly episodic SFHs (Schulte-Ladbeck et al., 2001a). Our results also indicate that the median SFRs of BCDs are somewhat smaller than has been deemed typical in the past. The gas consumption timescales are at a minimum a few hundred Myr, and more typically they are of the order of a few Gyrs. In this respect, BCDs appear closer to death than dwarf Irregulars (compare, for example, with the recent depletion time scales in van Zee, 2001).
We find that there is no mass-metallicity relation among the BCDs in the IT sample. The absence of a mass-metallicity relation for BCDs can be understood with the help of differential winds (Marconi et al., 1994). The more recent models of Mac Low & Ferrara (1999) and Ferrara & Tolstoy (2000), which incorporate dark matter and are applicable to the HI mass range that we observe in BCDs, appear to predict well the global properties of BCDs, at least to first order. An interesting prediction of these models is that all galaxies with HI masses below 109 M⊙ are prone to lose mass through the feedback of star formation. Interestingly, while there is not a lot of cool gas lost, the loss of metals becomes more and more important the lower the HI mass of the galaxy (with a peak in the metal-loss rate at an HI mass of a few times 108 M⊙). This indicates a progressively stronger violation of the assumption of a closed-box model for chemical evolution toward low galaxy masses. We surmise that the absence of a mass-metallicity relation in BCDs reflects just this metal-enriched mass-loss. The basis for the mass-metallicity relation breaks down below a gas mass of about 109 M⊙.
I Zw 18 and SBS 0335052 continue to stand out as extreme examples of BCDs whenever their chemical properties are being investigated. In terms of total SFR, HI mass, gas-consumption timescale and W20, they fit in well with other BCDs. But in terms of oxygen abundance versus SFR and HI mass, they are extremes compared to the rest of the sample. I Zw 18 and SBS 0335052 have gas masses of a few times 108 M⊙ where dwarf galaxies, according to the models of Ferrara & Tolstoy, are particularly vulnerable to the loss of heavy elements. A detailed prediction of the SFH and the chemical enrichment of I Zw 18 based on the work of Ferrara & Tolstoy would be particularly interesting as a precursor to the results of future deep single-star photometry. Chemo-dynamical models with “gasping,” rather than bursting, SFHs for I Zw 18 are already in work by Recchi et al. (2002). (“Gasping” in this sense means long episodes of moderate star-forming activity separated by short quiescent intervals, see e.g., Tosi et al. 2002.) It will be interesting to see what physical insights can be gained from their simulations.
Acknowledgments
AMH gratefully acknowledges support provided by NASA through Hubble Fellowship grant HST-HF-01140.01-A awarded by the Space Telescope Science Institute, which is operated by the Association of Universities for Research in Astronomy, Inc., for NASA, under contract NAS 5-26555.
References
- Becker et al. (1995) Becker, R. H., White, R. L., Helfand, D. J. 1995, ApJ, 450, 559
- Cannon et al. (2001) Cannon, J. M., Skillman, E. D., Garnett, D. R., Dufour, R. J. 2001, AAS, 198 #09.14
- Carollo & Lilly (2001) Carollo, C. M., Lilly, S. J. 2001, ApJ, 584, L153
- Condon (1992) Condon, J. J. 1992, ARA&A, 30, 575
- Condon et al. (1998) Condon, J. J., Cotton, W. D., Greisen, E. W., Yin, Q. F., Perley, R. A., Taylor, G. B., Broderick, J. J. 1998, AJ, 115, 1693
- Cram et al. (1998) Cram, L., Hopkins, A., Mobasher, B., Rowan-Robinson, M. 1998, ApJ, 507, 155
- Crone et al. (2002) Crone, M., Schulte-Ladbeck, R. E., Greggio, L., Hopp, U. 2002, ApJ, 567, 258
- Dale et al. (2001) Dale, D. A., Helou, G., Neugebauer, G., Soifer, B. T., Frayer, D. T., Condon, J. J. 2001, AJ, 122, 1736
- Deeg et al. (1993) Deeg, H.-J., Brinks, E., Duric, N., Klein, U., Skillman, E. 1993, ApJ, 410, 626
- Dekel & Silk (1986) Dekel, A., Silk, J. 1986, ApJ, 303, 39
- de Vaucouleurs et al. (1991) de Vaucouleurs, G., de Vaucouleurs, A., Corwin, J. R., Buta, R. J., Paturel, G., Fouque, P. 1991, “Third reference catalogue of Bright galaxies,” (New York: Springer-Verlag)
- Dolphin et al. (2001) Dolphin, A. E., Makarova, L., Karachentsev, I. D., Karachentseva, V. E., Geisler, D., Grebel, E. K., Guhathakurta, P., Hodge, P. W., Sarajedini, A., Seitzer, P. 2001, MNRAS, 324, 249
- Fanelli et al. (1988) Fanelli, M. N., O’Connell, R. W., Thuan, T. X. 1988, ApJ, 334, 665
- Ferrara & Tolstoy (2000) Ferrara, A., Tolstoy, E. 2000, MNRAS,313, 291
- Freedman et al. (2001) Freedman, W. L., Madore, B. F., Gibson, B. K., Ferrarese, L., Kelson, D. D., Sakai, S., Mould, J. R., Kennicutt, R. C., Jr., Ford, H. C., Graham, J. A.,Huchra, J. P., Hughes, S. M. G., Illingworth, G. D., Macri, L. M., Stetson, P. B. 2001, ApJ, 553, 47
- Haarsma et al. (2000) Haarsma, D. B., Partridge, R. B., Windhorst, R. A., Richards, E. A. 2000, ApJ, 544, 641
- Hildago-Gámez & Olofsson (1998) Hildago-Gámez, A. M., Olofsson K. 1998, A&A, 334, 45
- Hirashita et al. (2001) Hirashita, H., Inoue, A. K., Kamaya, H., Shibai, H. 2001, A&A, 366, 83
- Hopkins et al. (2002) Hopkins A. M., Miller C. J., Connolly A. J., Genovese C., Nichol R. C., Wasserman L. 2002, AJ, 123, 1086
- Huchtmeier & Richter (1986) Huchtmeier, W.K., Richter, O.G. 1986, A&AS, 63, 323
- Hunter & Hoffmman (1999) Hunter, D. A., Hoffmman, L. 1999, AJ, 117, 2789
- Izotova et al. (2000) Izotova, I., Parnovskya, S., Izotov, Y. 2000, NewAR, 44, 283
- Izotov et al. (1994) Izotov, Y. I., Thuan, T. X., Lipovetsky, V. A. 1994, ApJ, 435, 647
- Izotov et al. (1997) Izotov, Y. I., Thuan, T. X., Lipovetsky, V. A. 1997, ApJS, 108, 1
- Izotov & Thuan (1998) Izotov, Y. I., Thuan, T. X. 1998, ApJ, 500, 188
- Izotov & Thuan (1999) Izotov, Y. I., Thuan, T. X. 1999, ApJ, 511, 639 (IT)
- Kennicutt (1998) Kennicutt, R. C. 1998, ARA&A, 36, 189
- Klein et al. (1991) Klein, U., Weiland, H., Brinks, E. 1991, A&A 246, 323
- Kobulnicky & Zaritsky (1999) Kobulnicky, H. A., Zaritsky, D. 1999, ApJ, 511, 118
- Kraan-Korteweg (1986) Kraan-Korteweg, R. C. 1986, A&AS, 66, 255
- Kunth & Östlin (2000) Kunth, D., Östlin, G. 2000, A&AR, 10, 1
- Larsen et al. (2001) Larsen, T. I., Sommer-Larsen, J., Pagel, B. E. J. 2001, MNRAS, 323, 555
- Lequeux et al. (1979) Lequeux, J., Rayo, J. F., Serrano, A., Peimbert, M., Torres-Peimbert, S. 1979, A&A, 80, 155
- Lequeux & Viallefond (1980) Lequeux, J., Viallefond, F. 1980, A&A, 91, 269
- Lisenfeld et al. (1997) Lisenfeld, U., Völk, H.J., Xu, C. 1997, RevMexAA, 6, 81
- Lisenfeld & Ferrara (1998) Lisenfeld, U., Ferrara, A. 1998, ApJ, 496, 145
- Mac Low & Ferrara (1999) Mac Low, M.-M., Ferrara, A. 1999, ApJ, 513, 142
- Marconi et al. (1994) Marconi, G., Matteucci, F., Tosi, M. 1994, MNRAS, 270, 35
- Mas-Hesse & Kunth (1999) Mas-Hesse, M., Kunth, D. 1999, A&A, 349, 765
- Perley (2000) Perley, R. A. 2000, “The VLA Observational Status Summary,” (http://www.aoc.nrao.edu/vla/obstatus/vlas/vlas.html)
- Popescu et al. (1999) Popescu, C. C., Hopp, U., Rosa, M. R. 1999, A&AS, 350, 414
- Pustilnik et al. (2001) Pustilnik, S. A., Brinks, E., Thuan, T. X., Lipovetsky, V. A., Izotov, Y. I. 2001, AJ, 121, 1413
- Recchi et al. (2002) Recchi, S., Matteucci, F., D’Ercole, A., Tosi, M. 2002, A&A, in press (astro-ph/0112450)
- Sage et al. (1992) Sage, L. J., Salzer, J. J., Loose, H.-H., Henkel, C. 1992, A&A, 265, 19
- Sargent & Searle (1970) Sargent, W. L. W., Searle, L. 1970, ApJ, 162, L155
- Schulte-Ladbeck et al. (1999) Schulte-Ladbeck, R. E., Hopp, U., Crone, M. M., Greggio, L. 1999, ApJ, 525, 709
- Schulte-Ladbeck et al. (2000) Schulte-Ladbeck, R. E., Hopp, U., Crone, M. M., Greggio, L. 2000, in “The First Stars”, eds. A. Weiss, T. Abel, V. Hill, (Springer) p. 293
- Schulte-Ladbeck et al. (2001a) Schulte-Ladbeck, R. E., Hopp, U., Greggio, L., Crone, M. M., Drozdovsky, I.O. 2001a, AJ, 121, 3007
- Schulte-Ladbeck et al. (2001b) Schulte-Ladbeck, R.E., Hopp, U., Greggio, L., Crone, M.M., Drozdovsky, I.O., Hopkins, A.M. 2001b, in Proc. of the 40th meeting of the Bonn-Bochum Graduierten Kolleg “Dwarf Galaxies and their Environment”, eds. K. S. de Boer, R.-J. Dettmar, U. Klein, Shaker Verlag, p. 83
- Skillman et al. (1989) Skillman, E. D., Kennicutt, R. C., Hodge, P. W. 1989, ApJ, 347, 875
- Thuan & Martin (1981) Thuan, T. X., Martin, G. E. 1981, ApJ, 247, 823
- Thuan et al. (1999a) Thuan, T. X., Lipovetsky, V. A., Martin, J.-M., Pustilnik, S. A. 1999a, A&AS, 139, 1
- Thuan et al. (1999b) Thuan, T. X., Sauvage, M., Madden, S. 1999b, ApJ, 516, 783
- Tonry et al. (2001) Tonry, J. L., Dressler, A., Blakeslee, J. P., Ajhar, E. A., Fletcher, A. B., Luppino, G. A., Metzger, M. R., Moore, C. B. 2001, ApJ, 546, 681
- Tosi et al. (2002) Tosi, M., Greggio, L., Annibali, F., Aloisi, A. 2002, astro-ph/0112268
- van Zee (2001) van Zee, L. 2001, AJ, 121, 2003
- van Zee et al. (1998) van Zee, L., Westpfahl, D., Haynes, M. P. 1998, AJ, 115, 1000
- Weilbacher & Fritze-v.Alvensleben (2001) Weilbacher, P.M., Fritze-v.Alvensleben, U. 2001, A&AL, 373, 9
- Xu (1990) Xu, C. 1990, ApJ, 365, L47
| Name | RA | Dec | |||
|---|---|---|---|---|---|
| (J2000) | (J2000) | (Jy) | (mJy) | (km s-1) | |
| NVSS (FIRST) | |||||
| UM 311 | 01 15 33.89 | 51 31.9 | 2.50 | () | 1709 |
| UM 420 | 02 20 54.51 | 33 23.6 | () | 17514 | |
| MRK 0600 | 02 51 04.57 | 27 13.9 | 1008 | ||
| SBS 0335052 | 03 37 44.04 | 02 38.5 | 4043 | ||
| MRK 1089 | 05 01 37.80 | 15 27.7 | 4.06 | 4068 | |
| MRK 0005 | 06 42 15.53 | 37 32.6 | 0.21 | 792 | |
| MRK 0071 | 07 28 41.40 | 11 26.0 | 3.30 | 108 | |
| MRK 1409 | 07 45 29.72 | 25 37.6 | 5576 | ||
| SBS 0749+568 | 07 53 41.53 | 41 58.9 | 5471 | ||
| SBS 0749+582 | 07 53 50.93 | 08 10.4 | 9548 | ||
| UGC 04483 | 08 37 03.00 | 46 31.0 | 178 | ||
| SBS 0907+543 | 09 11 08.51 | 10 51.2 | () | 8124 | |
| MRK 1416 | 09 20 56.19 | 34 04.7 | () | 2326 | |
| SBS 0926+606 | 09 30 06.61 | 26 51.8 | 0.27 | 4122 | |
| I Zw 018 | 09 34 01.92 | 14 26.1 | 742 | ||
| SBS 0940+544 | 09 44 16.72 | 11 32.9 | 1638 | ||
| SBS 0943+561 | 09 46 46.59 | 57 06.4 | 8850 | ||
| MRK 0022 | 09 49 30.45 | 34 48.6 | 1551 | ||
| SBS 0948+532 | 09 51 31.81 | 59 36.3 | () | 13880 | |
| MRK 1434 | 10 34 10.15 | 03 49.1 | 2269 | ||
| MRK 1271 | 10 56 09.00 | 10 23.0 | () | 1013 | |
| CG 0798 | 10 57 47.45 | 15 39.3 | 0.53 | () | 634 |
| MRK 0036 | 11 04 58.47 | 08 22.1 | 0.23 | () | 646 |
| MRK 0162 | 11 05 08.13 | 44 50.1 | 1.29 | () | 6458 |
| SBS 1116+583B | 11 19 24.79 | 03 50.8 | 9905 | ||
| VII Zw 403 | 11 27 59.90 | 59 39.0 | 0.38 | 100 | |
| SBS 1128+573 | 11 31 16.33 | 03 58.7 | 1787 | ||
| MRK 1450 | 11 38 35.62 | 52 27.2 | 0.28 | 946 | |
| UM 448 | 11 42 12.30 | 20 03.0 | 4.14 | () | 5488 |
| MRK 0750 | 11 50 02.67 | 01 23.8 | 0.44 | () | 754 |
| UM 461 | 11 51 33.03 | 22 22.8 | 1039 | ||
| UM 462 | 11 52 37.15 | 28 08.5 | 0.94 | 1199 | |
| MRK 0193 | 11 55 28.35 | 39 52.4 | 5157 | ||
| SBS 1159+545 | 12 02 02.37 | 15 49.6 | () | 3537 | |
| SBS 1205+557 | 12 08 28.18 | 25 26.5 | 1740 | ||
| SBS 1211+540 | 12 14 02.50 | 45 18.0 | 907 | ||
| SBS 1222+614 | 12 25 05.55 | 09 08.5 | 0.29 | 706 | |
| MRK 0209 | 12 26 16.02 | 29 36.6 | () | 281 | |
| SBS 1249+493 | 12 51 52.37 | 03 25.5 | () | 7296 | |
| MRK 0059 | 12 59 00.35 | 50 42.8 | 1.97 | () | 1089 |
| SBS 1319+579 | 13 21 22.47 | 41 28.1 | 2060 | ||
| SBS 1331+493 | 13 33 22.93 | 06 06.3 | () | 599 | |
| MRK 1486 | 13 59 51.01 | 26 24.1 | 10136 | ||
| CG 0389 | 14 17 01.76 | 30 13.4 | () | 609 | |
| CG 0413 | 14 22 38.84 | 14 05.9 | () | 6176 | |
| MRK 0475 | 14 39 05.43 | 48 20.5 | () | 583 | |
| CG 1258 | 14 44 00.15 | 15 55.1 | () | 13605 | |
| SBS 1533+574 | 15 34 13.31 | 17 06.8 | 0.26 | 3310 | |
| MRK 0487 | 15 37 04.19 | 15 48.3 | 0.30 | 665 | |
| MRK 0930 | 23 31 58.29 | 56 49.9 | 1.25 | 5485 |
| Name | D | 12+log(O/H) | |||
|---|---|---|---|---|---|
| (Mpc) | (M⊙yr-1) | (M⊙yr-1) | (M⊙) | ||
| NVSS (FIRST) | |||||
| UM 311 | 21.3 | 1.5 | 1.1 (0.14) | ||
| UM 420 | 247.9 | 21.2 (9.23) | |||
| MRK 0600 | 14.5 | 0.077 | |||
| SBS 0335052 | 58.3 | 1.3 | |||
| MRK 1089 | 59.8 | 18.8 | 16.2 | ||
| MRK 0005 | 15.5 | 0.065 | 0.095 | ||
| MRK 0071 | 3.9 | 0.065 | 0.041 | ||
| MRK 1409 | 83.0 | 2.5 | |||
| SBS 0749+568 | 81.6 | 2.2 | |||
| SBS 0749+582 | 139.6 | 6.8 | |||
| UGC 04483 | 3.2 | 0.0016 | |||
| SBS 0907+543 | 119.9 | 5.1 (1.6) | |||
| MRK 1416 | 38.1 | 0.27 (0.15) | |||
| SBS 0926+606 | 63.4 | 1.4 | 1.6 | ||
| I Zw 018 | 15.0 | 0.087 | |||
| SBS 0940+544 | 28.7 | 0.27 | |||
| SBS 0943+561 | 130.4 | 5.6 | |||
| MRK 0022 | 27.5 | 0.24 | |||
| SBS 0948+532 | 202.2 | 13.4 (5.4) | |||
| MRK 1434 | 38.1 | 0.84 | |||
| MRK 1271 | 11.9 | 0.064 (0.021) | |||
| CG 0798 | 9.4 | 0.061 | 0.092 (0.012) | ||
| MRK 0036 | 7.7 | 0.017 | 0.020 (0.0079) | ||
| MRK 0162 | 96.6 | 15.5 | 21.4 (15.5) | ||
| SBS 1116+583B | 146.4 | 6.4 | |||
| VII Zw 403 | 4.4 | 0.0096 | 0.0040 | ||
| SBS 1128+573 | 32.1 | 0.34 | |||
| MRK 1450 | 19.7 | 0.14 | 0.11 | ||
| UM 448 | 78.5 | 32.9 | 29.5 (22.0) | ||
| MRK 0750 | 6.0 | 0.020 | 0.022 (0.0049) | ||
| UM 461 | 10.2 | 0.039 | |||
| UM 462 | 17.2 | 0.36 | 0.13 | ||
| MRK 0193 | 79.4 | 2.4 | |||
| SBS 1159+545 | 56.8 | 1.1 (0.47) | |||
| SBS 1205+557 | 32.0 | 0.36 | |||
| SBS 1211+540 | 20.1 | 0.17 | |||
| SBS 1222+614 | 16.5 | 0.10 | 0.14 | ||
| MRK 0209 | 5.8 | 0.022 (0.022) | |||
| SBS 1249+493 | 110.7 | 3.9 (1.7) | |||
| MRK 0059 | 25.2 | 1.6 | 1.3 (0.55) | ||
| SBS 1319+579 | 36.7 | 0.56 | |||
| SBS 1331+493 | 15.1 | 0.078 (0.030) | |||
| MRK 1486 | 150.6 | 6.2 | |||
| CG 0389 | 15.3 | 0.14 (0.032) | |||
| CG 0413 | 94.5 | 3.0 (1.2) | |||
| MRK 0475 | 13.6 | 0.072 (0.027) | |||
| CG 1258 | 199.4 | 12.5 (5.6) | |||
| SBS 1533+574 | 53.2 | 0.94 | 1.7 | ||
| MRK 0487 | 15.3 | 0.092 | 0.092 | ||
| MRK 0930 | 75.3 | 9.1 | 10.6 |