The Westerbork HI Survey of Spiral and Irregular Galaxies
II.
R-Band Surface Photometry of Late-type Dwarf Galaxies††thanks: Based on
observations made with INT operated on the island of La Palma by the
Isaac Newton Group in the Spanish Observatorio del Roque de los
Muchachos of the Instituto de Astrofisica de Canarias. The tables in
Appendix A are only available in electronic form at the CDS via
anonymous ftp to cdsarc.u-strasbg.fr (130.79.128.5) or via
http://cdsweb.u-strasbg.fr/cgi-bin/qcat?J/A+A/ The figures in
Appendix B are only available in electronic form
http://www.edpsciences.org
-band surface photometry is presented for 171 late-type dwarf and irregular galaxies. For a subsample of 46 galaxies -band photometry is presented as well. We present surface brightness profiles as well as isophotal and photometric parameters including magnitudes, diameters and central surface brightnesses. Absolute photometry is accurate to 0.1 mag or better for 77% of the sample. For over 85% of the galaxies the radial surface brightness profiles are consistent with published data within the measured photometric uncertainty. For most of the galaxies in the sample HI data have been obtained with the Westerbork Synthesis Radio Telescope. The galaxies in our sample are part of the WHISP project (Westerbork HI Survey of Spiral and Irregular Galaxies), which aims at mapping about 500 nearby spiral and irregular galaxies in HI. The availability of HI data makes this data set useful for a wide range of studies of the structure, dark matter content and kinematics of late-type dwarf galaxies.
Key Words.:
Surveys – Galaxies: dwarf – Galaxies: photometry1 Introduction
Over the years, a growing body of CCD-based data on the surface brightness distributions of spiral and dwarf galaxies has become available (e.g., de Jong & van der Kruit 1994; Courteau 1996; Frei et al 1996; Heraudeau & Simien 1996; Patterson & Thuan 1996; Tully et al 1996; Matthews & Gallagher 1997; Peletier & Balcells 1997; Jansen et al 2000). CCD imaging has been the impetus for many new studies of a range of aspects of disk galaxies, such as general scaling laws (de Jong 1996a; Courteau et al 1996; Graham & Prieto 1999; Jansen et al 2000), the vertical light distribution (de Grijs & van der Kruit 1996; de Grijs 1998), the presence of thick disks (Sackett et al 1994; van Dokkum et al 1994; de Grijs & Peletier 1996), the radial truncation of the light distribution (Pohlen et al 2000; de Grijs et al 2000), asymmetries and lopsidedness (Rix & Zaritsky 1995; Zaritsky & Rix 1997; Kornreich et al 1998; Conselice et al 2000), and the stellar populations of disk galaxies (de Jong 1996b; Peletier & Balcells 1996; Bell & de Jong 2000).
A combination of optical imaging data with HI observations, which provide information both on the distribution of HI and on the kinematics of these galaxies, is a powerful tool to further our understanding of the properties of disk galaxies, as has been demonstrated by numerous papers in the literature in which one or a few galaxies are discussed. To date, however, there does not exist in the literature a large sample of galaxies for which both photometry and HI imaging exists. The ongoing Westerbork HI survey of spiral and irregular galaxies (WHISP), which aims at mapping about 500 spiral and irregular galaxies in HI, is well suited for a more statistical study of the link between optical and kinematical properties of disk galaxies (for more details on the WHISP project and its goals, see Swaters et al 2000, hereafter Paper I).
The two main aspects of the WHISP survey are a study of the HI component of galaxies in itself, and a study of the kinematic properties, focussing on rotation curves and dark matter properties. As part of the WHISP survey, optical -band images have been obtained for the galaxies in the WHISP sample. These optical data provide the deep optical images and accurate optical global properties, such as disk surface brightnesses, disk scale lengths, integrated magnitudes and optical diameters that are needed for a detailed comparison of the optical, HI and dark matter properties. In addition to the two main aspects of WHISP, the combination of the HI distribution, the kinematics and the light distribution will allow detailed studies of the nature of for example scaling laws between HI and optical properties, warps, truncated disks, and lopsidedness.
In this paper, we present optical surface photometry data for the 171 late-type dwarf galaxies in the WHISP sample. The outline of the paper is as follows. Sect. 2 describes the selection of the sample. In Sect. 3 the distance uncertainties for the dwarf galaxies in our sample are discussed. Sect. 4 describes the observations and the data reduction steps. In Sect. 5 the ellipse fitting used to derive the surface brightness, ellipticity and position angle profiles is described. Sect. 6 presents the global photometric parameters obtained from the data, and Sect. 7 describes the internal checks on our surface photometry, the comparison of our profiles to those of other authors and the comparison of global parameters to catalog values. Sect. 8 gives a brief description of the optical properties of the galaxies in this sample. Finally, Sect. 9 gives a summary of the main results.
To facilitate the reading of text and tables, all long tables have been placed at the end of the paper. Appendix A presents the tables with the selected sample, the assumed distances for all galaxies, the list of observations and the derived optical properties. Grayscale representations of each galaxy, together with surface brightness profiles, are given in Appendix B.
2 Sample
The late-type dwarf galaxies presented here are part of the much larger WHISP sample. This sample has been selected from the Uppsala General Catalogue of Galaxies (UGC, Nilson 1973), and it consists of all UGC galaxies with a blue major-axis diameter larger than , , and an HI line flux density larger than 100 mJy (as calculated from the ratio of total HI fluxes and profile widths as listed in the Third Reference Catalogue of Bright Galaxies (hereafter RC3, de Vaucouleurs et al 1991)). These criteria ensure sufficient resolution and a high enough signal-to-noise ratio for observation with the Westerbork Synthesis Radio Telescope.
From the WHISP sample all late-type dwarf galaxies were selected for the present study. The sample consists of two subsamples. The first consists of galaxies with HI flux densities above 200 mJy, that either have morphological types later than Sd, or that have earlier morphological types and are fainter than . This subsample contains 113 late-type dwarfs and forms the basis of a study of HI and dark matter in late-type dwarf galaxies (see Swaters 1999). The second subsample comprises 80 galaxies with flux densities between 100 and 200 mJy that were classified as dwarf galaxies by Nilson (1973). The total sample constructed in this way contains 193 galaxies. No upper limit was set for the diameter of the selected galaxies. For the 200 mJy sample, no lower limit to the diameter was applied either, which resulted in the inclusion of four dwarf galaxies with blue major-axis diameters smaller than . Furthermore, there was no selection criterion based on the environments of these dwarfs. Isolated dwarfs as well as dwarf companions to larger galaxies have been included in the sample.
Besides the selection effects of the UGC, which are well studied (Thuan & Seitzer 1979; Paturel et al 1991; de Jong & van der Kruit 1994), the present sample has an additional selection effect as a result of the requirement that the galaxies have HI measurements listed in the RC3. Not all galaxies have been observed in HI (57% of the galaxies that meet all our criteria except the flux density criterion have a measured HI flux listed in the RC3), and those that have been observed come from studies with different scientific goals, different telescopes and different sensitivities. In addition, the selection based on the flux density may introduce a dependency on the inclination and the kinematic properties of the galaxies. Therefore the true selection function is difficult to quantify. With these caveats in mind, the sample is representative of this galaxy population as it spans the entire range of properties of late-type dwarfs.
Because morphological type was one of the main selection criteria for the sample selection, a few galaxies were included in the sample that were assigned late morphological types, but that proved not to be dwarf galaxies but large irregular galaxies, such as interacting systems and peculiar galaxies. Though these will be excluded in later studies of the properties of late-type dwarfs, their optical properties are presented here.
The sample of observed galaxies is listed in Table 4. Out of the total of 193 galaxies, 171 have been observed. The remaining 22 have been missed due to bad weather. The galaxies in the 200 mJy sample were given priority, as a result only 2 out of the 113 galaxies in that sample have not been observed.
3 Galaxy distances
An important source of uncertainty for mass models of our dwarf sample are the galaxy distances. Care has been given to using the best distance estimator available for each galaxy. Here we discuss the choice of distance estimators and the magnitude of the distance uncertainty associated to each.
The distances for the late-type dwarf galaxies in our sample have been obtained from a search of the literature up to and including 1998. Most of the literature distances have been derived from four distance indicators. In order of decreasing priority these are based on Cepheids, brightest stars, group membership and systemic velocity. A full list of the adopted distances for all of the galaxies in our sample, including the method used to determine the distance, is given in Table 5. Unfortunately, Cepheid distances are available for only three of the galaxies in our sample. Below the uncertainties for the three other methods are discussed.
3.1 Brightest stars
The accuracy of the brightest star method to determine the distance has been subject of many discussions. There are a number of possible problems, in particular if the brightest blue stars are used (e.g., Humphreys & Aaronson 1987). The brightest stars in a galaxy may not be individual stars, but star clusters or compact HII regions, or these stars may be variable. In addition, it is found that the luminosity of the brightest stars is dependent on the luminosity of their parent galaxy, thus introducing a degeneracy in the distance determination (e.g., Humphreys 1983). The brightest red stars suffer much less from these problems.
The reported accuracy of the brightest stars as distance indicators differs substantially between different studies. Rozanski & Rowan-Robinson (1994) found that the uncertainty in the distance modulus is 0.58 mag for the brightest red stars and 0.90 mag for the brightest blue stars. Karachentsev & Tikhonov (1994), on the other hand, find uncertainties of 0.37 mag and 0.46 mag, respectively. Lyo & Lee (1997) found, from a comparison of distance determinations based on Cepheids and brightest stars, that the uncertainties in the distance moduli are 0.37 mag for the brightest red stars, and 0.55 for the brightest blue stars, and they conclude that the brightest red stars are therefore useful distance indicators.
Most of the distance determinations from brightest stars, listed in Table 5, are based on brightest red stars. With an uncertainty in the distance modulus of 0.37 mag, the uncertainty in the distance is about 20%. If the uncertainty is as high as 0.58, as suggested by Rozanski & Rowan-Robinson (1994), the distance uncertainty will be about 30%.

3.2 Group membership
Distances from group membership are mostly based on the groups identified in de Vaucouleurs (1975) and de Vaucouleurs et al (1983). The published distance moduli for these groups were derived from several distance indicators: (a) from optical tertiary indicators (morphological type and luminosity class); (b) from the mean redshift of the group and a position-dependent Hubble constant (varying between 70 km s-1 Mpc-1 and 110 km s-1 Mpc-1), calibrated with spiral galaxies whose distances were determined from tertiary distance indicators; (c) from the Tully-Fisher relation. Unfortunately, de Vaucouleurs et al (1983) do not list which particular distance indicator or combination of distance indicators was used to obtain the distance modulus they list. For the details on these distance indicators, see de Vaucouleurs et al (1983) and references therein.
Given how the group membership distances have been determined, it is clear that these distance may suffer from substantial uncertainties. De Vaucouleurs (1979) claims that the uncertainty in the distance moduli obtained from tertiary distance indicators is less than 0.4 mag. The Hubble constant based on tertiary distance indicators has an average value of about 90 km s-1 Mpc-1, higher than the currently favored value of the Hubble constant, which may indicate that the tertiary distance indicators tend to underestimate the distance.
Adding to this uncertainty is the fact that at small distances the depth of the group may be a significant fraction of the group distance.
3.3 Systemic velocity
For all the galaxies in our sample a distance was calculated from the HI systemic velocity following the prescription given in Kraan-Korteweg (1986) to correct for Virgocentric flow, with an adopted Hubble constant of 75 km s-1 Mpc-1. Many of the dwarf galaxies have low systemic velocities, and these may well be dominated by peculiar motions. As a result, these distances derived from the systemic velocities may have large uncertainties, in particular for the closest galaxies.
3.4 Comparison of distances
In the top panels of Fig. 1 the comparison between the distances derived with the three different methods is shown. In Fig. 1a the distances derived from the HI systemic velocities and group memberships are compared. Two features stand out. Firstly, at small distances there are a number of points that are grouped along slanted lines. These arise because there are a number of large nearby groups to which a substantial number of dwarfs are assigned, such as the M81 group, the M101 group and the NGC 4736 group. Secondly, at larger distances there appears to be a systematic difference between the group distance and the distance derived from the systematic velocity, in the sense that the group distances are generally smaller. This may be the result of an underestimate of the distances determined from tertiary distance indicators, as mentioned above. On the other hand, almost all of these galaxies are in the same region of the sky as the Virgo cluster. In this direction, the relation between the systemic velocity and the distance is less certain. This may also contribute to the differences between the two distance estimates compared in Fig. 1a.
Fig. 1b shows a comparison of the distance from the HI systemic velocity and the brightest star distance. There appears to be a weak correlation between these two distance estimates. Towards smaller HI distances, the ratio of HI distance over brightest star distance decreases. All of the galaxies for which brightest star distances are available are, because of the nature of the method, at small distances. At such small distances, the distances as derived from the HI systemic velocities are uncertain.
In Fig. 1c the group distances are compared with the brightest star distances. There is a slight indication that the average ratio plotted in Fig. 1c is below unity, indicating that distances based on group membership are smaller than those based on brightest stars, similar to what was concluded from Fig. 1a.
Another concern is that the distance estimates may depend on the surface brightness of the galaxies. Although this is unlikely for the distances derived from the HI systemic velocities, it may play a role for the group membership distances, which are partially based on tertiary distance indicators, and for the brightest star distances. In Fig. 1d-f the different distance estimates are plotted against central disk surface brightness . There does not appear to be a correlation between surface brightness and the HI distance (Fig. 1d), nor is such a correlation evident in (Fig. 1e, in which the group distance is plotted versus surface brightness.
Finally, at best a weak trend is seen between the brightest star distance and the surface brightness. The variations from low to high surface brightness are about 25%, comparable to the random errors. For low surface brightness galaxies smaller distances are found. Because of the lack of a precise distance indicator, it is unclear what causes this trend. It may be a result of selection effects. On the other hand, it may also be that the magnitudes of the brightest stars depend on surface brightness.
In summary, there are some indications that the group membership distances may underestimate the true distances. This systematic difference appears to be no larger than about 20%. In addition, the distance estimates based on brightest stars may depend on surface brightness, but these effects are probably smaller than 25%. This possible systematic error is likely to be dominated by the random errors in the distance estimates. Based on Figs. 1a-c, we estimate that the largest uncertainty in distance is about 60%, and that the typical distance uncertainty is about 30%.
4 Observations and data reduction
As mentioned in the introduction, one of the usages of the optical data is to provide the stellar distribution for mass modeling. For the light distribution to be close to the stellar mass distribution, observations at red wavelengths are necessary to minimize the effects of extinction and young populations. -band observations were not suitable because of the brighter sky in , making longer exposures necessary, and because of fringing making accurate flatfielding difficult. Even longer wavelengths, such as the -band, were not practical because the available infrared arrays had too small a field of view for the galaxies in the sample. This would make mosaicking necessary and therefore require a lot of observing time. The -band offered the best compromise. A possible problem in using -band is that the H emission line is included in the wavelength range covered by this filter. Jansen (2000) has found that the median contribution of H to the -band flux is 2.0% for late-type dwarf galaxies, with a maximum of 8%. Gallagher & Hunter (1989) show that radial H profiles and the -band radial surface brightness profiles have similar shapes. Hence, we expect that the H emission may introduce a systematic offset from the true radial surface brightness profile of 0.02 mag on average, but the shape of the profile will hardly be affected.
We used the f/3.29 prime focus camera at the 2.54m Isaac Newton Telescope at La Palma, during six observing runs between May 1994 and May 1996. A list of the observing dates is given in Table 1. In all runs, we used Harris filters. In the May 1994 run, we used an EEV CCD, in all other runs we used a thinned Tektronix CCD (TEK3). Specific details on the CCDs used are given in Table 2, which lists the readout noise, gain, pixel size, chip size and field of view for each chip. The EEV chip was always used in standard readout mode, the TEK CCD was mostly used in quick readout mode, saving time on readout of the chip. The increased readout noise was not important because the exposures are limited by photon noise. The emphasis was to reach faint surface brightness levels. For this reason, most galaxies were observed only in the -band. However, for 46 galaxies we have obtained -band data, which are presented here as well.
Most galaxies were observed only once. Galaxies for which the center was found to be saturated were observed a second time with a shorter exposure. A list of all observations is given in Tables 6 and 7. Some galaxies were observed in different observing runs, and these data were used for internal comparison of the photometric accuracy. Only the data with the best photometric conditions are listed. All of the data processing was done in iraf.
| May 1 – May 6, 1994 (m94) |
| November 29 – December 4, 1994 (d94) |
| February 2 – February 6, 1995 (f95) |
| May 27 – May 28, 1995 (m95) |
| December 23 – December 28, 1995 (d95) |
| May 10 – May 15, 1996 (m96) |
| CCD | Readout | Gain | Noise (e) | Pixel size (″) | CCD size | Field of view |
|---|---|---|---|---|---|---|
| EEV | standard | 0.69 | 3.9 | 0.55 | 1280x1180 | |
| TEK | standard | 0.73 | 4.7 | 0.59 | 1124x1124 | |
| TEK | quick | 1.47 | 6.2 | 0.59 | 1124x1124 |
4.1 Bias subtraction
Both the EEV and the TEK3 had flat bias levels and low dark currents, but the bias level did tend to vary slightly during the night. Therefore, the bias level was determined from the overscan regions. The May 1995 and the December 1995 run showed random bands in the bias levels, which were visible throughout the image. The amplitude of these bands was about 1 to 2 counts. For these images, the bias level was removed by subtracting from each image row the average of the corresponding bias row.
4.2 Flat fields
The instrument was known to have light leaks at the filter wheel, causing some excess light at the edges of the images. By wrapping the prime focus cone unit in a dark cloth, this effect was almost entirely removed, allowing accurate flat fielding.
During all the runs, twilight flats were taken at the beginning and the end of the nights, typically with 10000 to 30000 counts. Additionally, for increased accuracy night sky flats of blank fields were taken, typically seven per filter (each exposure 180 seconds in R and 300 in B).
For each night and filter we constructed a set of flat fields, by combining in different ways the twilight flats or the night sky flats. When more than two flat fields were combined, a rejection algorithm was used to remove stellar images and cosmic-ray events. Otherwise, stars and cosmic-ray events events were edited out by hand and replaced by the local average. Night sky flats were offset from one exposure to the other, so that stars could be filtered out. This filtering proved to be satisfactory under good seeing conditions () with 6 or 7 exposures. When the seeing was worse, or when fewer exposures had been obtained, stellar residuals remained in the constructed flat field. In the latter case, flat fields were constructed by fitting a low order two-dimensional polynomial to the night sky flat and to the twilight flat; next, the twilight flat was divided by its fit, thus obtaining the high signal-to-noise small scale variations, and these were multiplied into the fit to the night sky flat.
After constructing these flat fields, a number of exposures of each night was flat fielded by each of the constructed flatfields in order to test which provided the most accurate results. This was done by checking the flatness of the empty regions. In more than half of the cases the night sky flat fields allowed more accurate flat fielding than the twilight flats.
Because of this careful construction and testing of the flatfields, high flatfield accuracy was obtained. For each exposure the sky values at four places around each galaxy were measured, carefully avoiding the outer parts of the galaxy and the halos of bright stars. The background flatness was taken to be half the difference between the minimum and maximum values. The flatness defined in this way has a median value of 0.22% for the sample in , and 0.32% in .
4.3 Calibration
| Run | night | ||||
|---|---|---|---|---|---|
| May 94 | 1 | -0.480 | 0.196 | 0.697 | 0.223 |
| 2 | -0.489 | 0.160 | — | — | |
| 3 | -0.510 | 0.184 | — | — | |
| 4 | -0.462 | 0.149 | 0.564 | 0.287 | |
| 5 | -0.448 | 0.145 | — | — | |
| 6 | -0.591 | 0.285 | — | — | |
| Dec 94 | 1 | -0.238 | 0.104 | — | — |
| 4 | -0.106 | 0.090 | — | — | |
| 5 | -0.163 | 0.080 | — | — | |
| 6 | -0.171 | 0.092 | 0.020 | 0.221 | |
| Feb 95 | 1–5 | -0.16 | 0.09 | -0.19 | 0.37 |
| May 95 | 1 | 0.116 | 0.035 | 0.361 | 0.175 |
| 2 | 0.102 | 0.064 | 0.389 | 0.175 | |
| Dec 95 | 1 | -0.172 | 0.086 | 0.004 | 0.227 |
| 2 | -0.237 | 0.155 | 0.125 | 0.196 | |
| 3–6 | -0.151 | 0.155 | 0.109 | 0.220 | |
| May 96 | 1 | -0.061 | 0.104 | -0.076 | 0.316 |
| 2 | -0.094 | 0.101 | -0.056 | 0.263 | |
| 4 | -0.091 | 0.123 | -0.104 | 0.322 |
At regular intervals during each night, standard star fields from Landolt (1992) were observed. The fields we used were RU 149, PG0231+051, PG0942-029, PG1323-086, PG1525-071, PG1528+062 and PG 2213-006. With these stars and the magnitudes given in Landolt (1992), the observations were calibrated to Johnson and Kron-Cousins . The standard stars were observed over a range of airmasses for both bands, both on photometric and non-photometric nights. For all these stars we determined the instrumental aperture magnitudes and spurious values were deleted. These data were combined to fit zero-point magnitudes and color and extinction coefficients of the form:
| (1) |
where and are the standard star magnitudes, and are the instrumental magnitudes, is the airmass, is the zero-point offset, is the airmass term, and is the color term. The color terms were found to be small, and can be neglected. For most galaxies only -band data are available, but the missing color information does not significantly affect the accuracy of the calibration.
The calibration was done for each night independently, except for a few nights with poor photometric conditions, for which a combined calibration was done. The derived calibration coefficients are listed in Table 3. The residuals of the fit given by Eq. (1) give the uncertainty on the calibration, and are listed in Tables 6 and 7 for the and -band, respectively. This uncertainty also includes the uncertainty introduced by ignoring the color term. During nights with cirrus, standard stars were observed as well and obviously, the resulting photometric uncertainties are large. For those galaxies for which more than one observation was available, we used the one with the best photometry. If the seeing of the non-photometric observations was better, or if that image had a higher signal-to-noise ratio than the photometric one, we used the latter to calibrate the non-photometric observation.
The majority of the sample has good photometric accuracy. The zero point uncertainty is less than 0.1 mag for 77% of the sample, and below 0.2 mag for 89% of the sample.
4.4 Image combination
All exposures of the same galaxy observed in the same run were aligned using stars common in the frames. If more than two exposures were available, the images were combined using a rejection algorithm to remove cosmic-ray events. Otherwise, the cosmic-ray events were removed using the figaro bclean algorithm privately ported to iraf and replaced with the local average. If the central parts of a galaxy were saturated in a long exposure, the saturated pixels were rejected during the image combination and replaced with scaled values from the short exposure images.
A few galaxies were too large to fit in the field of view. These galaxies were mosaicked. All galaxies to be mosaicked were observed in the December 1995 run, under poor photometric conditions. The sky for all the images was subtracted and the images were aligned using stars in overlapping regions. Next, the images were scaled to the same exposure time, and scaled photometrically to the frame with the lowest sky and the highest counts per second, and the images were combined.
4.5 Final steps
In each frame the mean value of the sky was determined in four areas near the galaxy that were free of objects, stellar halos and scattered light. The sky value for each frame was the average of these four mean values. For the estimate of the uncertainty in the sky determination we used half the difference between the minimum and the maximum of the four mean values. This estimate of the uncertainty in the sky includes large scale variations in the flat fielding and also the uncertainty in the sky determination itself.
For each exposure the seeing was estimated by fitting two-dimensional Gaussians to all objects in the field that had been masked by hand (see Sect. 5). Only objects with ellipticities smaller than 0.15 and central peaks more than five times the noise were used, to avoid contamination by background galaxies and inaccurate measurements. On average, about 40 objects were used to obtain the seeing estimate. The seeing estimates listed in Tables 6 and 7 are the median values of the individual fits. Given the pixel size of about , the observations with the best seeing are undersampled. This affects approximately 15% of the data presented here.
The last step was to add the coordinate system to the frames. The coordinate system was transferred from the Digitized Sky Survey (DSS), by determining coordinates from the plate solution for stars visible in both the DSS and the CCD image. Using these coordinates, a coordinate system was fitted to the CCD frame, using about ten stars. We used a four term matrix to describe the coordinate system in a gnomonic projection. The errors on the coordinate system determined in this way are about . This is comparable to the typical error of found by Veron-Cetty & Veron (1996). The -band images of all galaxies, including the coordinate system, are presented in Appendix B.
5 Isophotal fits
Fitting ellipses to late type dwarf galaxies is not straightforward. Often, the light distribution is irregular, and sometimes a well defined center is missing, or the centers for the inner and outer parts are different. Nonetheless, the radial surface brightness profile gives a useful representation of the light distribution.
Before fitting ellipses to the galaxy images, we masked out all the stars and the scattered light in the frames by hand. Special care was taken to mask out low intensity halos of stars as well. In some cases this proved impossible, due to the proximity of a bright star to the galaxy image. In these cases, the foreground light was masked out to where the galaxy light started to be dominant and the contribution of the stellar halo was incorporated in the uncertainty in the sky determination.
The ellipse fitting itself was done using the galphot package (Franx et al 1989; Jørgensen, Franx & Kjægaard 1992). The ellipse parameters were determined at logarithmic intervals, each next ellipse having a radius 1.2 times bigger than the previous ellipse, with the innermost radius at . The radius of each ellipse is defined as , where is the major axis and the minor axis. The ellipticity is defined as . Determining the ellipse parameters was done in several steps. To make sure that the ellipse fits were not affected by substructure, HII regions, bars or other luminous components, all fits were individually inspected at each step in the process, and adjusted as described below when necessary.
First, we ran the fitting program leaving all the parameters (center, position angle and ellipticity) free. From these results we determined the center. If the galaxy had a well determined center, e.g. a nuclear peak or a clear central condensation, this was adopted to be its center. In most other cases, we determined the center from the average of the outer ellipses where the solution was more stable. In those cases where the outer parts were highly irregular, the center was determined from the average of the inner parts. The adopted center for each galaxy is indicated in Appendix B with a cross.
In the second step, the center was fixed. From these results we determined the position angle. This was done by averaging over the outer ellipses, over the region where the results were converging. The outermost points were discarded if these gave erratic results. If the position angle varied systematically with radius, the average position angle was used. For galaxies with a pronounced bar, we tried to determine the position angle of the surrounding disk.
In the third iteration, the center and position angle were fixed, in order to determine the ellipticity. We determined the value for the ellipticity in the same way as we determined the position angle. The ellipticities were set to zero if equal to zero within the uncertainties of the measurements.
After fixing the orientation parameters, we extracted the calibrated radial surface brightness profiles from all the images. The orientation parameters as found for the -band were also used to extract the -band radial surface brightness profiles. In Appendix B we show the radial surface brightness profiles and the exponential fits (see Sect. 6) for all galaxies. Also, the run of orientation parameters (center, ellipticity and position angle) with radius are presented. Note that these have been derived from the free fits and may therefore, in some cases, deviate substantially from the values chosen from subsequent fits with more parameters fixed.
6 Structural parameters
6.1 Profile fitting
Most of the radial surface brightness profiles are smooth and regular, despite the often irregular optical appearance of the galaxies. Some show a central excess of light, while others have a central flattening. In this paper, we have not attempted to make decompositions into disk and central components. Instead, we focused on the disk component in these galaxies. An exponential intensity law was fitted to the outer parts of the profiles, which becomes a linear relation when expressed in magnitudes:
| (2) |
where is the extrapolated central disk surface brightness, and is the disk scale length. The photometric errors were used as weights. Combined with the logarithmic spacing of the points in the profile, this leads to higher weights to the central parts. Most of the profiles are well described by an exponential. The profiles and their fits are shown in Appendix B. In a later paper, we will study the properties of the galaxies with central light concentrations with the use of the Sersic profile (Sersic 1968).
6.2 Observed central surface brightness
Beside the extrapolated central disk surface brightness derived from the fit, we also determined the observed central surface brightness, . This value differs from if the profile shows a central peak or flattening. The observed central surface brightness was determined from a linear extrapolation of the surface brightness profile in the inner few arcseconds to . This is justified given the exponential shape of the inner profile in most cases, also for profiles with a central concentration of light.
6.3 Diameters
For each galaxy two sets of diameters have been determined. Isophotal diameters in both the and the -band have been determined at and 26.5 mag arcsec-2. Additionally, effective radii within which 20%, 50% and 80% of the light is contained have been calculated.
6.4 Extinction and inclination corrections
The observed surface brightnesses and magnitudes suffer from extinction, both from dust in our Galaxy and from that internal to the observed galaxy. The data were corrected for Galactic extinction using the values for from Burstein & Heiles (1984). The values for have been obtained assuming an of 1.77 (Rieke & Lebofsky 1985).

The correction for internal extinction is less certain. A relationship is expected between the axis ratio and the observed surface brightness of approximately:
| (3) |
where is the surface brightness corrected for inclination, and where is a constant related to the extinction. For the transparent case, is equal to unity, for the opaque case it is zero.
The dependence of on is shown in Fig. 2. Note the relative paucity of high inclination, low surface brightness galaxies. This might indicate that the galaxies in this sample are transparent, and it would imply a lower cutoff in the true surface brightness distribution of dwarf galaxies at mag arcsec-2. However, the lack of such galaxies may well be the result of selection, e.g. as a result of the selection on flux density. In addition, given the selection on morphological type, some galaxies may drop out of our sample if they may have been misclassified as earlier morphological types when seen edge-on. The latter could contribute to the lack of high surface brightness edge-on galaxies that are expected in the optically thin case. In any case, any expected trend is weak because of the wide range in surface brightnesses at each . Also, the correction is uncertain in the cases where the ellipticity varies with radius. In conclusion, Eq. (3) does not provide a useful way to determine the transparency for this sample of galaxies.

Because dwarf galaxies generally have low metalicities (e.g., Skillman et al 1989), the dust content is likely to be low, and therefore these galaxies are expected to have small internal extinction. Therefore, was adopted, and in the remainder of this paper the surface brightnesses were corrected accordingly. In the optically thin case, the integrated magnitudes do not need to be corrected. Note that the surface brightnesses and diameters listed in Tables 8 and 9 have only been corrected for Galactic extinction, not for inclination.
6.5 Integrated magnitudes


Three magnitudes have been determined for each galaxy, two isophotal ( and ) and one total magnitude (). The isophotal magnitudes are calculated at two different levels. One at the 25 mag arcsec-2, and one at the limiting surface brightness level, which corresponds to the above sky level. The total magnitude has been calculated by extrapolating an exponential fitted to the outer parts of the surface brightness profile out to infinity. In particular for galaxies with low surfaces brightnesses, such as the dwarfs in this sample, this extrapolation can be significant. To first order, the extrapolation can be determined by assuming that the entire profile follows an exponential decay, as was done by Tully et al. (1996). However, applying such a correction overestimates the total magnitude when a central condensation is present, and underestimates it when the light profile flattens towards the center, as Tully et al (1996) already noted. To avoid this problem, we used the more general method to determine the total magnitude (Han 1992). This method assumes that the light falls exponentially outside the last point in the profile, but it makes no assumptions on the shape of the inner profile:
| (4) | |||||
where the function reflects the luminosity-radius relationship for such an exponential disk,
| (5) |
is the radius where is reached, and
| (6) |
is the total magnitude of a pure exponential disk characterized by and , as determined from fitting to the outer parts of the profile.
The top panel of Fig. 3 shows the extrapolation from to versus the total magnitude . The corrections become larger for less luminous galaxies, and may reach up to one magnitude. The bottom panel of Fig. 3 shows the extrapolation versus . The correction becomes larger for fainter surface brightnesses. The solid line shows the extrapolation for a purely exponential disk. The corrections generally follow this line closely. However, some points deviate up to about 0.5 mag from this line. This plot shows that just applying an extrapolation based on the assumption that the light profile is exponential may give total magnitudes that are significantly too bright, in particular for low surface brightness galaxies.
7 Comparison of radial surface brightness profiles
In order to assess the photometric quality of our data and to check the reliability of our estimate of the photometric uncertainty, radial surface brightness profiles of identical galaxies obtained during different runs have been compared. Our data have been compared to data available in the literature as well.
7.1 Internal comparison


Some galaxies were observed on more than one night. Although for each galaxy only one observation is given in this paper, these multiple observations have been used to assess the quality of our calibration. Figs. 4 and 5 show the internal comparison for the and the -band respectively. The dotted lines indicate the range based on the uncertainties on the photometric solution. The majority of the profiles are equal within the uncertainties of the measurements. Five cases, UGC~2800, UGC~3475, UGC~7199, UGC~7853 and UGC~7861 deviate more than expected from our estimates of the uncertainty in the photometry. These galaxies were all observed on nights during which there was some cirrus present. The uncertainty caused by cirrus is in principle included in the photometric uncertainty. The deviant cases are probably the result of somewhat thicker cirrus clouds passing overhead occasionally. Because in 83% of the internal comparisons the photometric uncertainty is accurately known, including nights with some cirrus, we conclude that the photometric uncertainty we have derived is a reliable estimate of the real photometric uncertainty. The comparison for the -band profiles, though available for only three galaxies, is consistent with this conclusion. Nights with cirrus have been marked in Tables 8 and 9. The fact that the difference profiles in Figs. 4 and 5 are quite flat indicates that, for 80% of the sample, uncertainties due to flatfielding, sky brightness determination and contamination by halos of foreground stars together are below 0.1 mag arcsec-2 over the entire radial range.
7.2 External comparison
Comparing surface brightness profiles with those obtained by other authors is not straightforward. For the comparison with published data, we restricted ourselves to CCD data. We have used data by McGaugh & Bothun (1994), de Jong & van de Kruit (1994), Heraudeau & Simien (1996), Patterson & Thuan (1996) and Jansen et al (2000). Where the authors have derived surface brightness profiles with fixed position angle and ellipticity, our profiles were rederived with the same orientation parameters. McGaugh & Bothun (1994) and Patterson & Thuan (1996) used free fits, making comparison of the profiles difficult. To get a substantial sample for comparison with other data, not only the data for the dwarf galaxies were used, but also the data for other galaxies that were observed in this program.
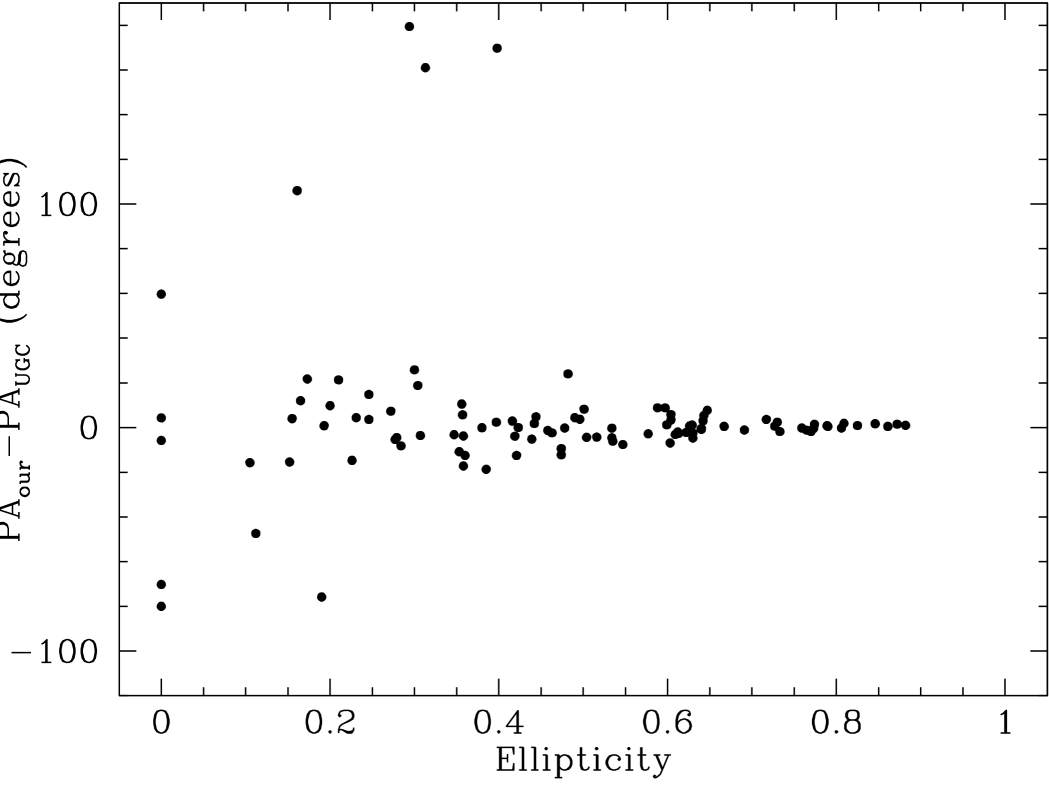
Fig. 6 shows the comparison for the -band profiles. Most profiles are consistent within the errors, as indicated by the dotted lines. For three galaxies, our results deviate significantly from the profiles obtained by others: UGC~1551, UGC~6446 and UGC~12754. For UGC~1551 there are two independent measurements available in the literature, by Jansen et al (2000) and de Jong & van der Kruit (1994), which are in agreement with each other. The quality of those data for these galaxies is high, as judged by the authors. The three deviating galaxies were observed during nights that suffered from occasionally thicker cirrus. Based on the external comparison, we conclude that for 87% of our observations the quoted photometric uncertainty is an accurate estimate of the photometric quality, similar to the number found from the internal comparison.

The comparison with the published surface brightness profiles for the -band is presented in Fig. 7. The comparison with the data by Jansen et al (2000) shows that our data is consistent within the uncertainties with his. However, the comparison with the data by McGaugh & Bothun (1994) and Patterson & Thuan (1996) shows clear inconsistencies. Both groups of authors have used free fits rather than fixed fits as we did. This explains the large difference found for UGC~3384, because this galaxy is highly asymmetric. Neither of the authors give uncertainties for their data. Except for UGC~3860, the profiles are fairly consistent, in particular in the inner parts.
In conclusion, based on both the internal and external comparison, we find that our quoted photometric uncertainties are accurate estimates of the real photometric uncertainties. In about 13% of the cases the real photometric uncertainties are underestimated. However, these poor nights are overrepresented in this comparison because many of the galaxies observed in non-photometric nights were deliberately reobserved in order to obtain better photometry. It is therefore likely that for a larger fraction than the 87% quoted above the photometric is uncertainty is accurate.
7.3 Comparison to UGC

An additional source to check our data against is the UGC. Fig. 8 shows the differences between our position angle and those listed in the UGC. For highly inclined galaxies the agreement is excellent. Towards more face-on galaxies the scatter increases and some large differences occur. The outcome of this comparison in no doubt affected by the fact that we have determined the position angles at fainter surface brightness levels.


Fig. 9 shows the comparison of our ellipticities with those from the UGC. The UGC ellipticities have been determined from the major and minor-axis diameters listed in the UGC. There is good general agreement, but with a large scatter, as was to be expected because our ellipticities have been determined at fainter surface brightness levels, and because the UGC ellipticities are based on eye estimates.

In Fig. 10 the is compared with the -band magnitude given in the UGC catalog. Generally, the agreement is good for . For fainter galaxies, the UGC magnitudes are systematically too faint. This effect was already noted by Thuan & Seitzer (1979). The difference becomes even more pronounced if the UGC magnitudes are compared with the total magnitude , where the difference may be as high as two magnitudes.
A comparison of the UGC -band diameters with the diameters as determined from our -band radial surface brightness profiles shows good agreement, as can be seen in Fig. 12. This indicates that the limiting surface brightness at which the UGC diameter is measured is about 25 -band mag arcsec-2. A similar comparison of the -band diameters shows that the limiting surface brightness there is about 26.5 -band mag arcsec-2, in close agreement with the value of 26.53 found by Fouqué & Paturel (1985).
8 Discussion
As described in Sect. 2, this sample contains a range in galaxy types and properties. Here we briefly characterize the sample by showing the distribution of several parameters.
The distribution of ellipticities and position angles PA are given in Fig. 12. The ellipticities have been derived as described in Sect. 5. The peak at is artificial and occurs because the ellipticities were set to zero for galaxies in which the ellipticities were equal to zero within the uncertainties. The true values of the ellipticities for these galaxies probably spread over a range in ellipticities, up to , filling in the depression near . This makes the distribution of ellipticities more or less uniform for small . Ellipticities near are missing because of the finite thickness of the galaxies. The distribution of position angles is consistent with being flat, as is expected if the galaxy orientations are random.

Fig. 13 shows the distribution over absolute -band magnitude for the galaxies in our sample. The absolute magnitudes have been calculated from the total magnitude and the distances listed in Table 4, and range from to . Most of the galaxies in our sample have low luminosities, as expected for dwarf galaxies, but about 30% have . These galaxies are not true dwarf galaxies, but form a mixed bag of large low surface brightness galaxies (similar to the galaxies studied by e.g., de Blok et al 1995 and Sprayberry et al 1995) and bright interacting galaxies. These galaxies were included in the sample because our selection is largely based on morphological type.
Fig. 14 shows this point more clearly. In this figure, for each galaxy the inclination corrected central disk surface brightness is plotted against the scale length. About 30% of the galaxies have scale lengths larger than 2 kpc. These are the galaxies that are more typical of the large low surface brightness galaxies. De Blok et al (1995) find that these galaxies typically have scale lengths between 2 and 6 kpc, and surface brightnesses fainter than mag arcsec-2. Note that the selection on late type has not included galaxies with both large scale length and high central surface brightness.
Finally, Fig. 15 shows the distribution of scale lengths and of inclination corrected central disk surface brightnesses. The galaxies in our sample generally have small scale lengths. The range in surface brightnesses is large, spanning from to 25 mag arcsec-2.
9 Summary

We provide -band surface photometry for 171 late-type galaxies. We have obtained magnitudes, diameters, central surface brightnesses, extrapolated central surface brightnesses and scale lengths. For all galaxies we have presented elliptically-averaged surface brightness profiles, and profiles showing the run of ellipticity, position angle profiles and isophote center with radius. Flatfielding achieved a median accuracy of 0.22%, making the surface brightness and structural profiles reliable to about 26 mag arcsec-2 in most cases. The zero point uncertainty is less than 0.1 mag for 77% of the sample, and less than 0.2 mag for 89% of the sample. The photometric accuracy is reliably quantified for each galaxy by the errors in the photometric calibration. Comparison of our surface brightness profiles and photometric zero points with data from other authors shows that, for at least 85% of the sample, we obtain agreement consistent with the quoted photometric uncertainties.
Acknowledgements.
We are grateful to Tjeerd van Albada for valuable comments. We thank Rolf Jansen for making available his data before publication. Travel grant support for this work was provided by the E.U. ANTARES Astrophysics Network, under contract CHRX-CT.93.0359, and by the Leids Kerkhoven-Bosscha Fonds. This research has made use of the NASA/IPAC Extragalactic Database (NED) which is operated by the Jet Propulsion Laboratory, California Institute of Technology, under contract with the National Aeronautics and Space Administration. IRAF is distributed by the National Optical Astronomy Observatories, which are operated by the Association of Universities for Research in Astronomy, Inc., under cooperative agreement with the National Science Foundation. The Digitized Sky Survey (DSS) was produced at the Space Telescope Science Institute under U.S. Government grant NAG W-2166.References
- (1) Aparicio, A., García-Pelayo, J. M., & Moles, M. 1988, A&AS, 74, 367
- (2) Arp, H. 1966, ApJS, 14, 1
- (3) Bell, E. F., & de Jong, R. S. 2000, MNRAS, 312, 497
- (4) Bottinelli, L., Gouguenheim, L., Paturel, G., & de Vaucouleurs, G. 1985, ApJS, 59, 293
- (5) Burstein, D., & Heiles, C. 1984, ApJS, 54, 33
- (6) Conselice, C. J., Bershady, M. A., & Jangren, A. 2000, ApJ, 529, 886
- (7) Courteau, S. 1996, ApJS, 103, 363
- (8) Courteau, S., de Jong, R. S., & Broeils, A. H. 1996, ApJ, 457, L73
- (9) de Blok, W. J. G., van der Hulst, J. M., & Bothun, G. D. 1995, MNRAS, 274, 235
- (10) de Grijs, R. 1998, MNRAS, 299, 595
- (11) de Grijs, R., & Peletier, R. F. 1997, A&A, 320, L21
- (12) de Grijs, R., & van der Kruit, P. C. 1996, A&AS, 117, 19
- (13) de Grijs, R., Kregel, M., & Wesson, K. H. 2000, MNRAS, 324, 1074
- (14) de Jong, R.S. 1996a, A&A, 313, 45
- (15) de Jong, R.S. 1996b, A&A, 313, 377
- (16) de Jong, R., & van der Kruit, P. C. 1994, A&AS, 107, 419
- (17) de Vaucouleurs, G. 1975, in Galaxies and the Universe, Vol. IX of Stars and Stellar Systems, eds. A. Sandage, M. Sandage, J. Christian (University of Chicago, Chicago), p. 557
- (18) de Vaucouleurs, G. 1979, ApJ, 227, 729
- (19) de Vaucouleurs, G., de Vaucouleurs, A., & Buta, R. 1983, AJ, 88, 764
- (20) de Vaucouleurs, G., de Vaucouleurs, A., Corwin, H. G., et al. 1991, Third Reference Catalogue of Bright Galaxies (New York:Springer)
- (21) Fouqué, P., & Paturel, G. 1985, A&A, 150, 192
- (22) Franx, M., Illingworth, G., & Heckman, T. 1989, AJ, 98, 538
- (23) Frei, Z., Guhathakurta, P., Gunn, J. E., & Tyson, J. A. 1996, AJ, 111, 174
- (24) Gallagher, J. S., & Hunter, D. A. 1989, AJ, 98, 806
- (25) Georgiev, T. B., Bilkina, B. I., Tikhonov, N. A., & Karachentsev, I. D. 1991, A&AS, 89, 529
- (26) Graham, A. W., & Prieto, M. 1999, ApJ, 524, L23
- (27) Han, M. 1992, ApJS, 81, 35
- (28) Heraudeau, P.,& Simien, F. 1996, A&AS, 118, 111
- (29) Hoessel, J. G., Saha, A., Krist, J., & Danielson, G. E. 1994, AJ, 108, 645
- (30) Humphreys, R. M. 1983, ApJ, 269, 335
- (31) Humphreys, & R. M, Aaronson, M. 1987, ApJ, 318, L69
- (32) Israel, F. P. 1988, A&A, 194, 24
- (33) Jansen, R. A. 2000, PhD thesis, Rijksuniversiteit Groningen
- (34) Jansen, R. A., Franx, M., Fabricant, D., & Caldwell, N. 2000, ApJS, 126, 271
- (35) Jørgensen, I., Franx, M., & Kjærgaard, P. 1992, A&AS, 95, 489
- (36) Karachentsev, I. D., & Tikhonov, N. A. 1993, A&AS, 100, 227
- (37) Karachentsev, I. D., & Tikhonov, N. A. 1994, A&A, 286, 718
- (38) Karachentsev, I. D., Musella, I., & Grimaldi, A. 1996, A&A, 310, 722
- (39) Karachentsev, I. D., Tikhonov, N. A., & Sazonova, L. N. 1994a, Sov. Astro. J. Lett., 20 84
- (40) Karachentsev, I. D., Tikhonov, N. A., & Sazonova, L. N. 1994b, A&AS, 106, 555
- (41) Karachentsev, I. D., Tikhonov, N. A., Sharina, M. E., Georgiev, T. B., & Bilkina, B. I. 1991, A&AS, 91, 503
- (42) Kornreich, D. A., Haynes, M. P., & Lovelace, R. V. E. 1998, AJ, 116, 2154
- (43) Kraan-Korteweg, R. C. 1986, A&AS, 66, 255
- (44) Krismer, M, Tully, R. B., & Gioia, I. M. 1995, AJ, 110, 1584
- (45) Landolt, A. U. 1992, AJ, 104, 340
- (46) Lyo, A.-R., & Lee, M. G. 1997, JKAS, 30, 27
- (47) Matthews, L. D. & Gallagher, J. S. 1997, AJ, 114, 1899
- (48) McGaugh, S. S., & Bothun, G. D. 1994, AJ, 107, 530
- (49) Nilson, P. 1973, Uppsala General Catalogue of Galaxies, Uppsala Astr. Obs. Ann., Vol. 6 (UGC)
- (50) Patterson, R. J., & Thuan, T. X. 1996, ApJS, 107, 103
- (51) Paturel, G., García, A. M., Fouqué, P, & Buta, R. 1991, A&A, 243, 319
- (52) Peletier, R. F., & Balcells, M. 1996, AJ, 111, 2238
- (53) Peletier, R. F., & Balcells, M. 1997, NewAst, 1, 349
- (54) Pierce, M. J., Ressler, M. E., & Shure, M. S. 1992, ApJ, 390, L45
- (55) Pohlen, M., Dettmar, R.-.J, & Lütticke, R. 2000, A&A, 357, L1
- (56) Rieke, G. H., & Lebofksy, M. J. 1985, ApJ, 288, 618
- (57) Rix, H., & Zaritsky, D. 1995, ApJ, 447, 82
- (58) Rozanski, R., & Rowan-Robinson, M. 1994, MNRAS, 271, 530
- (59) Sackett, P. D., Morrison, H. L., Harding, P., & Boroson, T.A. 1994, Nature, 370, 441
- (60) Saha, A., Labhardt, L, Schwengeler, H., et al., 1994, ApJ, 425, 14
- (61) Schmidt, K.-H., & Boller, T. 1992, AN, 313, 189
- (62) Schmidt, K.-H., & Karachentsev, I. D. 1996, AN, 317, 197
- (63) Sersic, J. L., 1968, Atlas de galaxias australes, Observatorio Astronomico, Cordoba
- (64) Sharina, M. E. 1991, Sov. Astro. J. Lett., 17, 383
- (65) Skillman, E. D., Kennicutt, R. C., & Hodge, P. W. 1989, ApJ, 347, 875
- (66) Sprayberry, D., Impey, C. D., Bothun, G. D., & Irwin, M. J. 1995, AJ, 109, 558
- (67) Swaters, R. A. 1999, PhD thesis, Rijksuniversiteit Groningen
- (68) Swaters, R. A., van Albada, T. S., van der Hulst, J. M., & Sancisi, R. 2000, A&AS, accepted (Paper I)
- (69) Thuan, T. X., & Seitzer, P. O. 1979, ApJ, 231, 680
- (70) Tikhonov, N. A., Bilkina, B. I., Karachentsev, I. D., & Georgiev, T. B. 1991, A&A, 89, 1
- (71) Tikhonov, N. A., Karachentsev, I. D., Bilkina, B. I., & Sharina, M. E. 1992, A&Ap Trans, 1, 269
- (72) Tolstoy, E., Saha, A., Hoessel, J. G., & McQuade, K. 1995, AJ, 110, 1640
- (73) Tully, R. B. 1980, ApJ, 237, 390
- (74) Tully, R. B., Verheijen, M. A. W., Pierce, M. J., Huang, J.-S., & Wainscoat, R. J. 1996, AJ, 112, 2471
- (75) van den Bergh, S. 1959, Publ David Dunlop Obs. II, No. 5.
- (76) van den Bergh, S., 1966, AJ, 71, 922
- (77) van Dokkum, P. G., Peletier, R. F., & de Grijs, R., Balcells, M. 1994, A&A, 286, 415
- (78) Veron-Cetty, M. P., & Veron, P. 1996, ApJS, 115, 97
- (79) Zaritsky, D., & Rix, H. 1997, ApJ, 477, 118
Appendix A Tables
A.1 Table 4 – Global properties
Column (1) gives the UGC number.
Column (2) provides other common names, in this order: NGC, DDO (van den Bergh 1959, 1966), IC, Arp (Arp 1966), CGCG. At most two other names are given.
Columns (3) and (4) give the equatorial coordinates (2000) derived from the optical images, as described in Sect. 4.
Column (5) gives the morphological type according to the RC3, using the same coding.
Column (6) gives the absolute -band magnitude, calculated from the apparent photographic magnitude as given in the RC3, and the distance as given in column 7.
Column (7) provides the adopted distance. Where possible stellar distance indicators have been used, mostly Cepheids and brightest stars. If these were not available, a distance based on group membership was used. If these were not available either, the distance was calculated from the HI systemic velocity following the prescription given in Kraan-Korteweg (1986), with an adopted Hubble constant of km s-1 Mpc-1. A full list of published distances for the galaxies in this sample, updated to the beginning of 1998, is given in Table 5. For a discussion of the distance uncertainties, see Sect. 3.
Column (8), (9) and (10) give the heliocentric velocity, the HI line width at the 50% level and the HI mass in units of M⊙, respectively, all as given in the RC3.
Column (11) gives the Galactic extinction in the -band, derived from the value according to Burstein & Heiles (1984) assuming of 1.77 (Rieke & Lebofsky 1985).
A.2 Table 5 – Adopted distances
Column (1) gives the UGC number
Column (2) gives the distance as derived from the HI systemic velocity, assuming a Hubble constant km s-1Mpc-1 and following the prescription given in Kraan-Korteweg (1986) to correct for the Virgocentric inflow.
Column (3) gives the distance(s) found in the literature.
Column (4) gives the reference for each distance.
Column (5) gives a brief description of the method used in the original paper to derive the distance.
Column (6) gives the distance we have adopted. The distance uncertainties are discussed in Sect. 3.
A.3 Table 6 and 7 – List of observations
Column (1) lists the UGC number.
Column (2) gives the observing date.
Column (3) gives the exposure time.
Column (4) gives an estimate of the seeing, as described in Sect. 4.
Column (5) gives the photometric accuracy . This is the residual obtained in the photometric solution, as described in Sect. 4.
A.4 Table 8 and 9 – isophotal and photometric parameters
Column (1) lists the UGC number.
Column (2) and (3) give the ellipticity and the position angle P.A.
Column (4) gives the apparent magnitude within the 25 mag arcsec-2 isophote.
Column (5) gives the apparent limiting magnitude . This is the apparent magnitude within the limiting surface brightness given in column (7).
Column (6) gives the extrapolated apparent magnitude . The extrapolation is described in Sect. 6.
Column (7) gives the limiting surface brightness , which corresponds to above sky. is our estimate of the error in the sky, as described see Sect. 4.
Column (8) gives the central surface brightness , as determined from the luminosity profile (see Sect. 5). has been corrected for Galactic foreground extinction, but not for inclination.
Column (9) gives the extrapolated disk central surface brightness as obtained from an exponential fit to the surface brightness profile. has been corrected for Galactic foreground extinction, but not for inclination.
Column (10) gives the absolute magnitude MR or MB. The absolute magnitude has been calculated from and the distance as listed in 5. These values are corrected for Galactic foreground extinction.
Column (11) gives the uncertainty in the photometry, , which is the residual obtained in the photometric solution, as described in Sect. 4. For galaxies with mag the photometric parameters are only given to the nearest tenth of a magnitude.
Column (12) gives the scale length in arcsec, measured along the major axis, as determined from an exponential fit to surface brightness profile.
Column (13) and (14) give the isophotal diameters, and at the 25 and 26.5 mag arcsec-2 isophote. These diameters have been corrected for Galactic foreground extinction and are measured along the major axis. The diameters are given in units of arcsec.
Column (15), (16) and (17) give the radii , and within which 20%, 50% and 80% of the light is contained. These radii have been measured along the major axis, and are given in units of arcsec.
— Notes —
a These galaxies are at very low Galactic latitude and therefore Burstein & Heiles (1984) do not give Galactic foreground extinctions. The galaxies concerned are: UGC 192, UGC 3272 and UGC 3390. For these galaxies the magnitudes and surface brightnesses are not corrected for Galactic extinction.
b These galaxies have been observed during nights with occasional thin cirrus clouds. Therefore, in some cases the photometric error may be an underestimate of the true photometric error, as was found in Sect. 7.
| UGC | Other names | R.A. (2000) | Dec. (2000) | Type | D | MHI | ||||||||
|---|---|---|---|---|---|---|---|---|---|---|---|---|---|---|
| h m s | ∘ ′ ′′ | mag | Mpc | km/s | km/s | M⊙ | mag | |||||||
| (1) | (2) | (3) | (4) | (5) | (6) | (7) | (8) | (9) | (10) | (11) | ||||
| 192 | IC 10 | 0 | 20 | 20.0 | 59 | 17 | 56 | .IB.9$. | – | 1.0 | -343 | 63 | 1.33 | – |
| 731 | DDO 9 | 1 | 10 | 43.6 | 49 | 36 | 4 | .I..9*. | – | 8.0 | 639 | 130 | 5.99 | 0.41 |
| 1249 | IC 1727 | 1 | 47 | 29.9 | 27 | 19 | 56 | .SBS9.. | -17.59 | 7.5 | 338 | 121 | 8.2 | 0.14 |
| 1281 | 1 | 49 | 31.9 | 32 | 35 | 24 | .S..8.. | -15.82 | 5.5 | 157 | 116 | 2.83 | 0.08 | |
| 1438 | NGC 746 | 1 | 57 | 51.1 | 44 | 55 | 6 | .I..9.. | -17.11 | 13.3 | 712 | 105 | 8.38 | 0.31 |
| 1501 | NGC 784 | 2 | 01 | 16.9 | 28 | 50 | 10 | .SB.8*/ | -16.86 | 5.7 | 198 | 96 | 5.05 | 0.12 |
| 1547 | DDO 17 | 2 | 03 | 20.4 | 22 | 02 | 31 | .IB.9.. | -17.22 | 20.2 | 2644 | 138 | 25.9 | 0.15 |
| 1551 | 2 | 03 | 37.6 | 24 | 04 | 32 | .SB?… | -18.02 | 20.2 | 2671 | 118 | 14.1 | 0.19 | |
| 1865 | DDO 19 | 2 | 24 | 59.9 | 36 | 02 | 15 | .S..9*. | – | 10.1 | 580 | 76 | 3.22 | 0.12 |
| 2014 | DDO 22 | 2 | 32 | 54.0 | 38 | 40 | 35 | .I..9*. | – | 10.1 | 565 | 49 | 1.94 | 0.1 |
| 2017 | 2 | 32 | 45.4 | 28 | 50 | 29 | .I..9.. | – | 16.2 | 1014 | 84 | 9.09 | 0.16 | |
| 2023 | DDO 25 | 2 | 33 | 18.2 | 33 | 29 | 28 | .I..9*. | -15.61 | 10.1 | 606 | 39 | 4.06 | 0.19 |
| 2034 | DDO 24 | 2 | 33 | 43.1 | 40 | 31 | 43 | .I..9.. | -15.71 | 10.1 | 579 | 45 | 8.17 | 0.1 |
| 2053 | DDO 26 | 2 | 34 | 29.2 | 29 | 45 | 4 | .I..9.. | -15.35 | 11.8 | 1029 | 59 | 5.59 | 0.2 |
| 2455 | NGC 1156 | 2 | 59 | 42.2 | 25 | 14 | 15 | .IBS9.. | -17.45 | 7.8 | 382 | 67 | 10.7 | 0.37 |
| 2603 | 3 | 19 | 14.6 | 81 | 20 | 47 | .I..9.. | – | 38.5 | 2519 | 121 | 43.1 | 0.39 | |
| 2800 | 3 | 40 | 03.8 | 71 | 24 | 20 | .I..9?. | – | 20.6 | 1176 | 208 | 29.3 | 0.77 | |
| 3056 | NGC 1569, Arp 210 | 4 | 30 | 49.6 | 64 | 50 | 53 | .IB.9.. | -14.8 | 2.2 | -88 | 74 | 1.12 | 1.15 |
| 3060 | NGC 1560 | 4 | 32 | 48.3 | 71 | 52 | 50 | .SAS7./ | -16.15 | 3.9 | -35 | 125 | 10.3 | 0.35 |
| 3137 | 4 | 46 | 15.0 | 76 | 25 | 6 | .S?…. | -16.22 | 18.4 | 993 | 222 | 35.4 | 0.31 | |
| 3144 | DDO 33 | 4 | 47 | 54.5 | 74 | 55 | 46 | .IB.9.. | -16.24 | 19.5 | 1636 | 142 | 22.8 | 0.32 |
| 3273 | 5 | 17 | 44.9 | 53 | 33 | 1 | .S..9.. | -15.62 | 12.2 | 616 | 185 | 19 | – | |
| 3317 | DDO 38 | 5 | 33 | 37.7 | 73 | 43 | 30 | .I..9.. | – | 19.5 | 1239 | 107 | 14.3 | 0.26 |
| 3371 | DDO 39 | 5 | 56 | 37.5 | 75 | 19 | 0 | .I..9*. | – | 12.8 | 816 | 129 | 12.6 | 0.27 |
| 3384 | 6 | 01 | 37.3 | 73 | 07 | 1 | .S..9*. | – | 19.5 | 1086 | 78 | 17.5 | 0.3 | |
| 3390 | 6 | 02 | 05.3 | 36 | 06 | 17 | .SX.8.. | – | 23.2 | 1517 | 202 | 27.2 | – | |
| 3475 | 6 | 30 | 28.9 | 39 | 30 | 15 | .S..9*. | -15.33 | 9.3 | 486 | 167 | 4.88 | 0.66 | |
| 3647 | DDO 40 | 7 | 04 | 50.2 | 56 | 31 | 9 | .IB.9.. | – | 18.4 | 1384 | 50 | 10.2 | 0.08 |
| 3698 | 7 | 09 | 18.8 | 44 | 22 | 49 | .I..9*. | – | 8.5 | 426 | 50 | 1.76 | 0.23 | |
| 3711 | NGC 2337 | 7 | 10 | 13.6 | 44 | 27 | 27 | .IB.9.. | -16.71 | 8.6 | 434 | 144 | 6.86 | 0.21 |
| 3817 | 7 | 22 | 44.6 | 45 | 06 | 31 | .I..9*. | – | 8.7 | 438 | 43 | 1.88 | 0.19 | |
| 3851 | NGC 2366, DDO 42 | 7 | 28 | 52.9 | 69 | 12 | 45 | .IBS9.. | -15.98 | 3.4 | 100 | 96 | 7.92 | 0.1 |
| 3860 | DDO 43 | 7 | 28 | 17.5 | 40 | 46 | 11 | .I..9.. | -14.05 | 6.8 | 354 | 38 | 1.3 | 0.12 |
| 3966 | DDO 46 | 7 | 41 | 26.1 | 40 | 06 | 39 | .I..9.. | – | 6.0 | 361 | 71 | 1.69 | 0.12 |
| 4173 | 8 | 07 | 10.5 | 80 | 07 | 38 | .I..9*. | -15.82 | 16.8 | 862 | 0 | 20.2 | 0.06 | |
| 4274 | NGC 2537, Arp 6 | 8 | 13 | 14.7 | 45 | 59 | 24 | .SBS9P. | -16.98 | 6.6 | 447 | 96 | 2.06 | 0.08 |
| 4278 | IC 2233 | 8 | 13 | 58.8 | 45 | 44 | 36 | .SBS7*/ | -16.62 | 10.5 | 563 | 180 | 13.3 | 0.08 |
| 4305 | Arp 268 | 8 | 19 | 07.4 | 70 | 43 | 24 | .I..9.. | -16.75 | 3.4 | 158 | 66 | 8.21 | 0.05 |
| 4325 | NGC 2552 | 8 | 19 | 19.7 | 50 | 00 | 32 | .SAS9$. | -17.42 | 10.1 | 519 | 134 | 7.52 | 0.1 |
| 4426 | DDO 52 | 8 | 28 | 28.3 | 41 | 51 | 22 | .I..9*. | – | 6.4 | 393 | 83 | 1 | 0.07 |
| 4483 | 8 | 37 | 03.5 | 69 | 46 | 32 | .I..9*. | -12.77 | 3.6 | 156 | 49 | 0.41 | 0.08 | |
| 4499 | 8 | 37 | 41.4 | 51 | 39 | 9 | .SX.8.. | -17.06 | 13.0 | 692 | 126 | 12 | 0.07 | |
| 4543 | 8 | 43 | 21.7 | 45 | 44 | 10 | .SA.8.. | -18.1 | 30.3 | 1960 | 108 | 60 | 0.06 | |
| 4660 | 8 | 54 | 24.2 | 34 | 33 | 22 | .S..9*. | – | 32.9 | 2203 | 61 | 18.6 | 0.03 | |
| 4704 | 8 | 59 | 00.3 | 39 | 12 | 39 | .S..8*. | -15.03 | 10.2 | 596 | 129 | 5.56 | 0.03 | |
| 4945 | 9 | 22 | 25.8 | 75 | 46 | 2 | .I..9.. | – | 6.7 | 659 | 34 | 0.38 | 0 | |
| 5040 | 9 | 27 | 36.4 | 28 | 47 | 58 | .I..9?. | -19.81 | 58.0 | 4149 | 63 | 70.2 | 0 | |
| 5139 | DDO 63 | 9 | 40 | 28.8 | 71 | 10 | 57 | .IXS9.. | -14.65 | 6.8 | 136 | 26 | 4.88 | 0.03 |
| 5221 | NGC 2976 | 9 | 47 | 14.9 | 67 | 55 | 2 | .SA.5P. | -17.3 | 4.5 | 3 | 97 | 2.57 | 0.06 |
| 5272 | DDO 64 | 9 | 50 | 22.7 | 31 | 29 | 14 | .I..9.. | -14.82 | 6.1 | 520 | 82 | 1.52 | 0.02 |
| 5322 | NGC 3034 | 9 | 55 | 52.7 | 69 | 40 | 52 | .I.0../ | -19.61 | 5.9 | 203 | 146 | 18.2 | 0.07 |
| 5336 | DDO 66 | 9 | 57 | 31.7 | 69 | 02 | 48 | .I..9.. | – | 3.6 | 46 | 69 | 3.28 | 0.08 |
| 5340 | DDO 68 | 9 | 56 | 45.7 | 28 | 49 | 34 | .I..9P* | -14.82 | 6.1 | 503 | 78 | 2.6 | 0.02 |
| 5364 | DDO 69 | 9 | 59 | 25.2 | 30 | 44 | 48 | .IB.9.. | -13.9 | 2.2 | 20 | 33 | 0.74 | 0.04 |
| 5398 | NGC 3077 | 10 | 03 | 19.1 | 68 | 44 | 5 | .I.0.P. | -16.98 | 3.6 | 14 | 65 | 10.5 | 0.12 |
| 5414 | NGC 3104, Arp 264 | 10 | 03 | 58.4 | 40 | 45 | 24 | .IXS9.. | -16.39 | 10.0 | 612 | 100 | 5.75 | 0.02 |
| 5455 | 10 | 08 | 50.3 | 70 | 38 | 3 | .I..9.. | – | 22.6 | 1290 | 57 | 9.55 | 0.1 | |
| UGC | Other names | R.A. (2000) | Dec. (2000) | Type | D | MHI | ||||||||
|---|---|---|---|---|---|---|---|---|---|---|---|---|---|---|
| h m s | ∘ ′ ′′ | mag | Mpc | km/s | km/s | M⊙ | mag | |||||||
| (1) | (2) | (3) | (4) | (5) | (6) | (7) | (8) | (9) | (10) | (11) | ||||
| 5478 | DDO 73 | 10 | 09 | 31.5 | 30 | 09 | 2 | .I..9.. | -17.03 | 18.5 | 1378 | 55 | 5.83 | 0.03 |
| 5612 | DDO 77 | 10 | 24 | 07.2 | 70 | 52 | 55 | .SBS8.. | -16.56 | 13.6 | 1011 | 146 | 10 | 0.11 |
| 5666 | IC 2574 | 10 | 28 | 23.0 | 68 | 24 | 56 | .SXS9.. | -17.03 | 3.7 | 47 | 115 | 13.3 | 0.03 |
| 5688 | DDO 80 | 10 | 30 | 25.0 | 70 | 03 | 3 | .SB.9*. | – | 30.2 | 1921 | 54 | 32.7 | 0 |
| 5706 | 10 | 31 | 10.8 | 34 | 30 | 13 | .I..9.. | – | 24.5 | 1494 | 36 | 5.78 | 0.01 | |
| 5721 | NGC 3274 | 10 | 32 | 17.3 | 27 | 40 | 8 | .SX.7?. | -15.95 | 6.7 | 537 | 157 | 6.85 | 0.03 |
| 5740 | 10 | 34 | 47.0 | 50 | 46 | 11 | .SX.9.. | -15.27 | 11.9 | 651 | 117 | 4.52 | 0 | |
| 5764 | DDO 83 | 10 | 36 | 43.5 | 31 | 32 | 50 | .IBS9*. | -15.36 | 9.0 | 586 | 101 | 2.56 | 0.02 |
| 5829 | DDO 84 | 10 | 42 | 43.2 | 34 | 27 | 1 | .I..9.. | -15.76 | 9.0 | 630 | 75 | 12.7 | 0.02 |
| 5846 | DDO 86 | 10 | 44 | 29.9 | 60 | 22 | 6 | .I..9.. | -15.69 | 13.2 | 1019 | 44 | 7.06 | 0 |
| 5860 | NGC 3353 | 10 | 45 | 22.4 | 55 | 57 | 37 | .S..3$P | -17.93 | 17.4 | 944 | 96 | 8.25 | 0 |
| 5918 | VII Zw 347 | 10 | 49 | 37.0 | 65 | 31 | 48 | .I..9*. | – | 7.7 | 338 | 62 | 2.45 | 0 |
| 5935 | NGC 3396, Arp 270 | 10 | 49 | 55.4 | 32 | 59 | 27 | .IB.9P. | -19.49 | 26.4 | 1625 | 160 | 56.3 | 0 |
| 5986 | NGC 3432, Arp 206 | 10 | 52 | 31.3 | 36 | 37 | 9 | .SBS9./ | -17.92 | 8.7 | 616 | 232 | 22.8 | 0 |
| 6016 | 10 | 54 | 13.0 | 54 | 17 | 14 | .I..9.. | – | 25.2 | 1493 | 136 | 25 | 0 | |
| 6021 | NGC 3445 | 10 | 54 | 35.6 | 56 | 59 | 27 | .SXS9.. | -19.66 | 32.1 | 2023 | 102 | 43.3 | 0 |
| 6024 | NGC 3448 | 10 | 54 | 38.9 | 54 | 18 | 21 | .I.0… | -19.78 | 23.2 | 1350 | 239 | 79.9 | 0 |
| 6126 | NGC 3510 | 11 | 03 | 43.4 | 28 | 53 | 11 | .SBS9./ | -16.75 | 8.9 | 705 | 186 | 9.17 | 0 |
| 6151 | DDO 91 | 11 | 05 | 56.4 | 19 | 49 | 35 | .S..9*. | -16.87 | 17.2 | 1331 | 26 | 4.39 | 0 |
| 6161 | 11 | 06 | 49.2 | 43 | 43 | 23 | .SB.8.. | -16.54 | 12.9 | 758 | 108 | 9.57 | 0 | |
| 6251 | DDO 92 | 11 | 13 | 26.8 | 53 | 35 | 44 | .SX.9*. | -15.59 | 13.2 | 927 | 44 | 4.79 | 0 |
| 6406 | NGC 3657 | 11 | 23 | 55.6 | 52 | 55 | 16 | .SXT5P. | -18.53 | 21.5 | 1215 | 196 | 39.1 | 0 |
| 6446 | 11 | 26 | 40.4 | 53 | 44 | 50 | .SA.7.. | -16.59 | 12.0 | 645 | 135 | 14.1 | 0 | |
| 6456 | VII Zw 403 | 11 | 27 | 58.7 | 78 | 59 | 38 | .P….. | -12.88 | 3.0 | -92 | 49 | 0.33 | 0.05 |
| 6565 | NGC 3738, Arp 234 | 11 | 35 | 48.6 | 54 | 31 | 28 | .I..9.. | -15.71 | 3.2 | 229 | 78 | 0.73 | 0 |
| 6628 | 11 | 40 | 05.8 | 45 | 56 | 32 | .SA.9.. | -17.01 | 15.3 | 850 | 40 | 13.3 | 0.01 | |
| 6682 | DDO 96 | 11 | 43 | 09.0 | 59 | 06 | 24 | .S..9*. | – | 16.1 | 1326 | 73 | 7.33 | 0 |
| 6817 | DDO 99 | 11 | 50 | 54.1 | 38 | 52 | 54 | .I..9.. | -13.71 | 4.02 | 245 | 37 | 1.49 | 0 |
| 6840 | DDO 100 | 11 | 52 | 07.0 | 52 | 06 | 29 | .SBT9.. | -15.77 | 15.7 | 1046 | 143 | 8.86 | 0.01 |
| 6912 | VII Zw 430 | 11 | 56 | 13.9 | 58 | 11 | 60 | .S?…. | -17.26 | 23.6 | 1357 | 96 | 22.1 | 0 |
| 6917 | 11 | 56 | 28.7 | 50 | 25 | 42 | .SB.9.. | -17.63 | 16.9 | 910 | 183 | 19.3 | 0.02 | |
| 6944 | NGC 3995, Arp 313 | 11 | 57 | 44.1 | 32 | 17 | 38 | .SA.9P. | -20.52 | 47.4 | 3254 | 133 | 148 | 0.01 |
| 6955 | DDO 105 | 11 | 58 | 29.1 | 38 | 04 | 33 | .IBS9*. | -16.11 | 11.6 | 909 | 144 | 10.5 | 0 |
| 6956 | DDO 102 | 11 | 58 | 26.1 | 50 | 55 | 6 | .SBS9.. | – | 15.7 | 917 | 52 | 6.3 | 0.02 |
| 6995 | NGC 4032 | 12 | 00 | 32.9 | 20 | 04 | 25 | .I..9*. | -19.08 | 22.6 | 1269 | 103 | 22.4 | 0.03 |
| 7047 | NGC 4068 | 12 | 04 | 02.2 | 52 | 35 | 25 | .IA.9.. | -14.71 | 3.5 | 211 | 51 | 1.04 | 0 |
| 7125 | 12 | 08 | 42.1 | 36 | 48 | 10 | .S..9.. | -17.24 | 19.5 | 1071 | 132 | 46.9 | 0.01 | |
| 7151 | NGC 4144 | 12 | 09 | 58.2 | 46 | 27 | 28 | .SXS6$/ | -15.58 | 3.5 | 267 | 150 | 1.58 | 0 |
| 7199 | NGC 4163 | 12 | 12 | 09.0 | 36 | 10 | 6 | .IA.9.. | -14.25 | 3.5 | 164 | 30 | 0.24 | 0 |
| 7204 | NGC 4173 | 12 | 12 | 21.2 | 29 | 12 | 29 | .SB.7*. | -18.33 | 20.3 | 1104 | 117 | 40 | 0.01 |
| 7232 | NGC 4190 | 12 | 13 | 44.6 | 36 | 38 | 9 | .I..9P. | -14.47 | 3.5 | 230 | 46 | 0.59 | 0 |
| 7261 | NGC 4204 | 12 | 15 | 14.2 | 20 | 39 | 34 | .SBS8.. | -16.89 | 9.1 | 861 | 85 | 6.63 | 0.04 |
| 7278 | NGC 4214 | 12 | 15 | 39.2 | 36 | 19 | 37 | .IXS9.. | -17.53 | 3.5 | 291 | 62 | 8.09 | 0 |
| 7306 | NGC 4236 | 12 | 16 | 42.8 | 69 | 27 | 46 | .SBS8.. | -17.05 | 3.0 | 0 | 162 | 13 | 0.03 |
| 7323 | NGC 4242 | 12 | 17 | 30.1 | 45 | 37 | 10 | .SXS8.. | -18.02 | 8.1 | 517 | 115 | 7.06 | 0 |
| 7356 | 12 | 19 | 09.1 | 47 | 05 | 25 | .I..9?. | – | 3.5 | 272 | 86 | 1.15 | 0 | |
| 7399 | NGC 4288, DDO 119 | 12 | 20 | 38.1 | 46 | 17 | 31 | .SBS8.. | -16.25 | 8.4 | 535 | 173 | 6.37 | 0 |
| 7408 | DDO 120 | 12 | 21 | 15.4 | 45 | 48 | 47 | .IA.9.. | -15.31 | 8.4 | 462 | 26 | 1.63 | 0 |
| 7490 | DDO 122 | 12 | 24 | 25.0 | 70 | 20 | 2 | .SA.9.. | -15.84 | 8.5 | 467 | 69 | 2.85 | 0 |
| 7524 | NGC 4395 | 12 | 25 | 48.8 | 33 | 32 | 50 | .SAS9*. | -17.01 | 3.5 | 320 | 109 | 9.54 | 0.01 |
| 7534 | DDO 123 | 12 | 26 | 08.1 | 58 | 19 | 20 | .IB.9.. | -15.14 | 8.5 | 723 | 55 | 5.13 | 0 |
| 7559 | DDO 126 | 12 | 27 | 05.5 | 37 | 08 | 34 | .IB.9.. | -12.82 | 3.2 | 218 | 59 | 0.61 | 0 |
| 7577 | DDO 125 | 12 | 27 | 42.0 | 43 | 29 | 37 | .I..9.. | -13.81 | 3.5 | 196 | 28 | 0.71 | 0 |
| 7592 | NGC 4449 | 12 | 28 | 11.3 | 44 | 05 | 36 | .IB.9.. | -17.61 | 3.5 | 201 | 136 | 12.4 | 0 |
| 7599 | DDO 127 | 12 | 28 | 27.9 | 37 | 14 | 2 | .S..9.. | -12.71 | 3.5 | 278 | 66 | 0.31 | 0 |
| 7603 | NGC 4455 | 12 | 28 | 44.1 | 22 | 49 | 18 | .SBS7?/ | -16.06 | 6.8 | 644 | 132 | 3.64 | 0.03 |
| 7608 | DDO 129 | 12 | 28 | 44.8 | 43 | 13 | 33 | .I..9.. | – | 8.4 | 538 | 60 | 4.88 | 0 |
| UGC | Other names | R.A. (2000) | Dec. (2000) | Type | D | MHI | ||||||||
|---|---|---|---|---|---|---|---|---|---|---|---|---|---|---|
| h m s | ∘ ′ ′′ | mag | Mpc | km/s | km/s | M⊙ | mag | |||||||
| (1) | (2) | (3) | (4) | (5) | (6) | (7) | (8) | (9) | (10) | (11) | ||||
| 7648 | NGC 4485, Arp 269 | 12 | 30 | 31.4 | 41 | 42 | 0 | .IBS9P. | -16.74 | 7.1 | 493 | 139 | 3.48 | 0 |
| 7651 | NGC 4490 | 12 | 30 | 36.3 | 41 | 38 | 36 | .IBS9P. | -19.29 | 8.4 | 578 | 173 | 52.9 | 0 |
| 7673 | DDO 131 | 12 | 31 | 58.7 | 29 | 42 | 34 | .I..9.. | – | 8.4 | 642 | 55 | 1.56 | 0.02 |
| 7690 | 12 | 32 | 26.9 | 42 | 42 | 17 | .I..9*. | -15.99 | 7.9 | 537 | 88 | 3.07 | 0 | |
| 7698 | DDO 133 | 12 | 32 | 54.5 | 31 | 32 | 21 | .I..9.. | -14.71 | 3.5 | 333 | 53 | 1.2 | 0.02 |
| 7723 | NGC 4534 | 12 | 34 | 05.4 | 35 | 31 | 7 | .SAS8*. | -17.36 | 11.3 | 802 | 123 | 19.4 | 0 |
| 7831 | NGC 4605 | 12 | 40 | 00.6 | 61 | 36 | 31 | .SBS5P. | -17.64 | 5.2 | 143 | 133 | 3.69 | 0 |
| 7853 | NGC 4618, Arp 23 | 12 | 41 | 32.5 | 41 | 09 | 2 | .SBT9.. | -18.11 | 7.8 | 543 | 97 | 12.3 | 0 |
| 7861 | NGC 4625, IC 3675 | 12 | 41 | 52.5 | 41 | 16 | 20 | .SXT9P. | -16.91 | 9.0 | 611 | 66 | 5.86 | 0 |
| 7866 | IC 3687 | 12 | 42 | 15.0 | 38 | 30 | 13 | .IXS9.. | -13.9 | 4.8 | 359 | 46 | 1.16 | 0 |
| 7872 | 12 | 41 | 54.1 | 75 | 18 | 27 | .I..9.. | – | 30.7 | 1887 | 69 | 18.6 | 0.02 | |
| 7907 | NGC 4656 | 12 | 43 | 58.3 | 32 | 10 | 18 | .SBS9P. | -18.93 | 7.9 | 640 | 139 | 49.5 | 0 |
| 7916 | I Zw 42 | 12 | 44 | 25.0 | 34 | 23 | 13 | .I..9.. | – | 8.4 | 607 | 57 | 3.6 | 0.01 |
| 7949 | DDO 147 | 12 | 47 | 00.1 | 36 | 28 | 41 | .I..9*. | – | 4.8 | 333 | 30 | 1 | 0.02 |
| 7971 | NGC 4707, DDO 150 | 12 | 48 | 22.5 | 51 | 09 | 55 | .S..9*. | -15.11 | 8.4 | 467 | 64 | 2.49 | 0.01 |
| 8005 | NGC 4747 | 12 | 51 | 46.0 | 25 | 46 | 35 | .SB6$/P | -18.91 | 21.8 | 1188 | 127 | 31 | 0.02 |
| 8024 | NGC 4789A, DDO 154 | 12 | 54 | 05.4 | 27 | 08 | 56 | .IBS9.. | -14.9 | 4.8 | 376 | 85 | 4.47 | 0.01 |
| 8098 | NGC 4861, IC 3961 | 12 | 59 | 02.0 | 34 | 51 | 41 | .SBS9*. | – | 12.8 | 846 | 86 | 16.6 | 0 |
| 8188 | IC 4182 | 13 | 05 | 49.5 | 37 | 36 | 24 | .SAS9.. | -15.35 | 4.7 | 321 | 40 | 3.25 | 0 |
| 8201 | VII Zw 499 | 13 | 06 | 25.6 | 67 | 42 | 19 | .I..9.. | -14.84 | 4.9 | 37 | 44 | 1.66 | 0.02 |
| 8286 | NGC 5023 | 13 | 12 | 11.9 | 44 | 02 | 16 | .S..6*/ | -15.43 | 4.8 | 407 | 179 | 3.24 | 0 |
| 8303 | 13 | 13 | 17.6 | 36 | 12 | 58 | .IXS9.. | -17.07 | 17.2 | 946 | 89 | 9.97 | 0 | |
| 8320 | IC 859 | 13 | 14 | 26.4 | 45 | 55 | 34 | .IB.9.. | -15.35 | 5.9 | 195 | 60 | 5.93 | 0 |
| 8331 | DDO 169 | 13 | 15 | 30.1 | 47 | 29 | 60 | .IA.9.. | -13.95 | 5.9 | 260 | 50 | 1.21 | 0 |
| 8441 | DDO 175 | 13 | 25 | 29.1 | 57 | 49 | 20 | .I..9.. | -16.7 | 20.0 | 1519 | 103 | 15 | 0 |
| 8489 | DDO 176 | 13 | 29 | 38.8 | 45 | 23 | 17 | .SX.8.. | -16.7 | 20.0 | 1303 | 130 | 12.5 | 0 |
| 8490 | NGC 5204 | 13 | 29 | 36.4 | 58 | 25 | 12 | .SAS9.. | -16.8 | 4.9 | 204 | 110 | 5.97 | 0.01 |
| 8508 | I Zw 60 | 13 | 30 | 44.5 | 54 | 54 | 39 | .IA.9.. | -13.43 | 3.7 | 62 | 49 | 0.5 | 0 |
| 8550 | NGC 5229 | 13 | 34 | 03.0 | 47 | 54 | 53 | .SBS7?/ | -14.31 | 5.3 | 364 | 127 | 1.79 | 0 |
| 8565 | NGC 5238, I Zw 64 | 13 | 34 | 42.8 | 51 | 36 | 52 | .SXS8.. | -14.67 | 5.2 | 232 | 36 | 0.42 | 0 |
| 8651 | DDO 181 | 13 | 39 | 53.9 | 40 | 44 | 21 | .I..9.. | -14.15 | 5.9 | 203 | 41 | 1.06 | 0 |
| 8683 | DDO 182 | 13 | 42 | 33.1 | 39 | 39 | 28 | .I..9.. | -15.29 | 12.6 | 661 | 35 | 2.68 | 0 |
| 8760 | DDO 183 | 13 | 50 | 50.5 | 38 | 01 | 5 | .I..9.. | -13.95 | 5.9 | 193 | 32 | 0.83 | 0 |
| 8837 | DDO 185 | 13 | 54 | 45.8 | 53 | 54 | 10 | .IBS9./ | -14.83 | 5.1 | 144 | 77 | 1.24 | 0 |
| 8892 | 13 | 57 | 41.1 | 57 | 00 | 6 | .I..9.. | -17.3 | 29.0 | 1748 | 95 | 24 | 0 | |
| 9018 | NGC 5477, DDO 186 | 14 | 05 | 32.6 | 54 | 27 | 39 | .SAS9.. | -15.22 | 7.7 | 304 | 52 | 1.84 | 0 |
| 9128 | DDO 187 | 14 | 15 | 56.7 | 23 | 03 | 18 | .I..9.. | -13.91 | 4.4 | 154 | 33 | 0.58 | 0 |
| 9211 | DDO 189 | 14 | 22 | 32.3 | 45 | 22 | 60 | .I..9*. | -15.49 | 12.6 | 690 | 99 | 9.21 | 0 |
| 9219 | NGC 5608 | 14 | 23 | 17.6 | 41 | 46 | 31 | .I..9*. | -16.49 | 12.0 | 663 | 109 | 4.19 | 0 |
| 9240 | I Zw 87 | 14 | 24 | 43.6 | 44 | 31 | 37 | .IA.9.. | -14.66 | 4.5 | 153 | 45 | 1.14 | 0 |
| 9405 | DDO 194 | 14 | 35 | 24.2 | 57 | 15 | 19 | .I..9.. | – | 7.6 | 222 | 85 | 1.38 | 0 |
| 9426 | 14 | 37 | 29.1 | 48 | 37 | 26 | .I..9.. | – | 36.2 | 2311 | 44 | 14.2 | 0.08 | |
| 9769 | 15 | 12 | 07.2 | 55 | 47 | 6 | .SXT8*. | -16.29 | 16.6 | 844 | 129 | 14.7 | 0.01 | |
| 9906 | NGC 5963 | 15 | 33 | 27.8 | 56 | 33 | 36 | .S…P. | -17.97 | 13.7 | 656 | 214 | 20.7 | 0 |
| 9992 | 15 | 41 | 48.0 | 67 | 15 | 15 | .I..9.. | -14.88 | 10.4 | 427 | 48 | 2.62 | 0.05 | |
| 10736 | 17 | 08 | 04.6 | 69 | 27 | 53 | .SX.8.. | -15.83 | 11.7 | 490 | 144 | 7.31 | 0.1 | |
| 10792 | 17 | 14 | 02.3 | 75 | 12 | 13 | .I..9.. | – | 22.2 | 1233 | 62 | 9.13 | 0.09 | |
| 10806 | 17 | 18 | 51.1 | 49 | 53 | 2 | .SBS8.. | -17.5 | 17.7 | 930 | 152 | 16.7 | 0.04 | |
| 11283 | IC 1291 | 18 | 33 | 52.6 | 49 | 16 | 44 | .SBS8?. | -18.57 | 31.3 | 1962 | 173 | 48.1 | 0.15 |
| 11557 | 20 | 24 | 00.7 | 60 | 11 | 41 | .SXS8.. | -18.17 | 23.8 | 1389 | 87 | 26.5 | 0.65 | |
| 11707 | 21 | 14 | 31.7 | 26 | 44 | 5 | .SA.8.. | -16.5 | 15.9 | 906 | 185 | 34.2 | 0.36 | |
| 12048 | NGC 7292 | 22 | 28 | 25.8 | 30 | 17 | 34 | .IB.9.. | -18.18 | 16.8 | 986 | 77 | 13.3 | 0.14 |
| 12060 | 22 | 30 | 33.9 | 33 | 49 | 14 | .IB.9.. | -16.07 | 15.7 | 884 | 113 | 14.9 | 0.2 | |
| 12212 | 22 | 50 | 30.2 | 29 | 08 | 20 | .S..9*. | – | 15.5 | 894 | 105 | 8.88 | 0.14 | |
| 12554 | NGC 7640 | 23 | 22 | 06.7 | 40 | 50 | 43 | .SBS5.. | -18.35 | 9.2 | 369 | 234 | 65.9 | 0.24 |
| 12632 | DDO 217 | 23 | 29 | 58.8 | 40 | 59 | 27 | .S..9*. | -14.69 | 6.9 | 422 | 114 | 8.19 | 0.28 |
| 12732 | 23 | 40 | 39.8 | 26 | 14 | 11 | .S..9*. | -16.79 | 13.2 | 748 | 112 | 28.1 | 0.1 | |
![[Uncaptioned image]](/html/astro-ph/0204526/assets/x16.png)
![[Uncaptioned image]](/html/astro-ph/0204526/assets/x17.png)
![[Uncaptioned image]](/html/astro-ph/0204526/assets/x18.png)
![[Uncaptioned image]](/html/astro-ph/0204526/assets/x19.png)
| UGC | date | seeing | ||
| sec | ′′ | mag | ||
| (1) | (2) | (3) | (4) | (5) |
| 192 | 1994 Nov 29 | 60 | 2.2 | 0.05 |
| 731 | 1995 Dec 23 | 600 | 1.0 | 0.02 |
| 1249 | 1994 Dec 2 | 600 | 1.6 | 0.22 |
| 1281 | 1995 Dec 24 | 300 | 0.9 | 0.02 |
| 1438 | 1994 Dec 2 | 600 | 1.1 | 0.22 |
| 1501 | 1995 Dec 24 | 300 | 1.0 | 0.02 |
| 1547 | 1994 Nov 29 | 300 | 1.8 | 0.05 |
| 1551 | 1994 Nov 29 | 600 | 1.8 | 0.05 |
| 1865 | 1995 Dec 25 | 600 | 1.6 | 0.02 |
| 2014 | 1994 Dec 2 | 1200 | 1.5 | 0.22 |
| 2017 | 1995 Dec 25 | 1800 | 1.5 | 0.05 |
| 2023 | 1995 Dec 25 | 600 | 1.6 | 0.02 |
| 2034 | 1995 Dec 25 | 600 | 1.5 | 0.05 |
| 2053 | 1994 Nov 29 | 420 | 3.2 | 0.05 |
| 2455 | 1994 Nov 29 | 180 | 2.5 | 0.05 |
| 2603 | 1995 Dec 27 | 900 | 1.6 | 0.19 |
| 2800 | 1995 Dec 23 | 600 | 1.0 | 0.02 |
| 3056 | 1994 Dec 3 | 420 | 1.3 | 0.22 |
| 3060 | 1995 Dec 24 | 600 | 1.3 | 0.07 |
| 3137 | 1995 Feb 4 | 1200 | 1.6 | 0.51 |
| 3144 | 1995 Dec 23 | 600 | 1.1 | 0.02 |
| 3273 | 1995 Feb 4 | 600 | 1.6 | 0.51 |
| 3317 | 1995 Dec 24 | 600 | 1.2 | 0.02 |
| 3371 | 1995 Dec 24 | 900 | 1.4 | 0.07 |
| 3384 | 1995 Dec 26 | 900 | 1.6 | 0.19 |
| 3390 | 1995 Dec 26 | 480 | 1.6 | 0.19 |
| 3475 | 1995 Dec 27 | 900 | 0.9 | 0.05 |
| 3647 | 1995 Dec 26 | 900 | 1.6 | 0.19 |
| 3698 | 1995 Dec 27 | 900 | 1.1 | 0.19 |
| 3711 | 1994 May 2 | 120 | 1.9 | 0.01 |
| 3817 | 1994 Dec 3 | 1200 | 2.2 | 0.22 |
| 3851 | 1995 Dec 28 | 300 | 2.6 | 0.02 |
| 3860 | 1995 Dec 26 | 600 | 1.5 | 0.19 |
| 3966 | 1995 Dec 24 | 600 | 1.7 | 0.02 |
| 4173 | 1995 Dec 24 | 600 | 1.4 | 0.02 |
| 4274 | 1995 Dec 26 | 300 | 1.4 | 0.19 |
| 4278 | 1994 Dec 4 | 180 | 2.0 | 0.02 |
| 4305 | 1995 Dec 28 | 180 | 1.7 | 0.01 |
| 4325 | 1995 Dec 24 | 300 | 1.7 | 0.02 |
| 4426 | 1994 Dec 3 | 1800 | 1.6 | 0.22 |
| 4483 | 1995 Dec 26 | 900 | 2.3 | 0.19 |
| 4499 | 1994 Dec 4 | 300 | 2.1 | 0.02 |
| 4543 | 1994 Nov 30 | 360 | 2.3 | 0.05 |
| 4660 | 1995 Dec 24 | 600 | 1.9 | 0.02 |
| 4704 | 1995 Dec 27 | 600 | 1.3 | 0.02 |
| 4945 | 1995 Dec 24 | 600 | 1.3 | 0.02 |
| 5040 | 1995 Dec 26 | 600 | 1.7 | 0.05 |
| 5139 | 1994 May 5 | 600 | 1.8 | 0.01 |
| 5221 | 1994 May 1 | 300 | 2.3 | 0.02 |
| 5272 | 1994 May 4 | 780 | 2.1 | 0.01 |
| 5322 | 1995 Dec 27 | 300 | 1.4 | 0.19 |
| 5336 | 1995 Dec 24 | 600 | 1.2 | 0.02 |
| 5340 | 1994 May 2 | 1200 | 1.9 | 0.01 |
| 5364 | 1994 May 4 | 1320 | 2.4 | 0.01 |
| 5398 | 1994 May 3 | 360 | 1.7 | 0.01 |
| 5414 | 1994 May 1 | 1320 | 2.4 | 0.02 |
| 5455 | 1994 Nov 30 | 1200 | 3.4 | 0.05 |
| UGC | date | seeing | ||
| sec | ′′ | mag | ||
| (1) | (2) | (3) | (4) | (5) |
| 5478 | 1995 Dec 25 | 600 | 1.7 | 0.07 |
| 5612 | 1995 Feb 7 | 600 | 1.4 | 0.51 |
| 5666 | 1995 Dec 28 | 360 | 1.8 | 0.19 |
| 5688 | 1994 May 6 | 600 | 2.2 | 0.06 |
| 5706 | 1995 Dec 25 | 900 | 1.7 | 0.07 |
| 5721 | 1994 May 1 | 600 | 1.9 | 0.02 |
| 5740 | 1995 Feb 5 | 600 | 1.3 | 0.51 |
| 5764 | 1995 Feb 5 | 600 | 1.4 | 0.51 |
| 5829 | 1994 May 5 | 1200 | 2.3 | 0.01 |
| 5846 | 1994 May 1 | 600 | 1.8 | 0.02 |
| 5860 | 1995 Dec 27 | 360 | 1.2 | 0.19 |
| 5918 | 1994 May 5 | 1200 | 2.4 | 0.01 |
| 5935 | 1994 May 6 | 300 | 1.8 | 0.06 |
| 5986 | 1994 May 2 | 300 | 1.8 | 0.02 |
| 6016 | 1995 Feb 7 | 900 | 1.5 | 0.51 |
| 6021 | 1995 Dec 27 | 300 | 1.2 | 0.19 |
| 6024 | 1994 May 3 | 240 | 2.2 | 0.01 |
| 6126 | 1994 May 6 | 300 | 1.9 | 0.06 |
| 6151 | 1995 Dec 26 | 600 | 1.6 | 0.19 |
| 6161 | 1994 May 6 | 1200 | 1.6 | 0.06 |
| 6251 | 1995 Dec 28 | 600 | 1.5 | 0.19 |
| 6406 | 1994 Dec 4 | 300 | 2.7 | 0.02 |
| 6446 | 1994 Dec 4 | 1200 | 2.7 | 0.02 |
| 6456 | 1995 Dec 27 | 600 | 1.3 | 0.19 |
| 6565 | 1994 May 3 | 250 | 2.3 | 0.01 |
| 6628 | 1994 May 5 | 600 | 2.7 | 0.01 |
| 6682 | 1995 Dec 27 | 600 | 1.3 | 0.19 |
| 6817 | 1994 May 3 | 600 | 1.7 | 0.01 |
| 6840 | 1994 Dec 4 | 600 | 2.3 | 0.02 |
| 6912 | 1995 Feb 3 | 600 | 1.8 | 0.51 |
| 6917 | 1995 Feb 3 | 300 | 2.1 | 0.51 |
| 6944 | 1994 May 2 | 240 | 2.2 | 0.02 |
| 6955 | 1994 May 3 | 600 | 1.8 | 0.01 |
| 6956 | 1994 May 3 | 1200 | 1.6 | 0.01 |
| 6995 | 1995 Dec 26 | 300 | 1.7 | 0.19 |
| 7047 | 1994 May 2 | 195 | 1.6 | 0.02 |
| 7125 | 1994 May 6 | 600 | 2.5 | 0.01 |
| 7151 | 1994 May 6 | 1015 | 2.0 | 0.06 |
| 7199 | 1995 May 27 | 400 | 1.3 | 0.07 |
| 7204 | 1995 Feb 3 | 300 | 2.3 | 0.51 |
| 7232 | 1995 May 27 | 400 | 1.2 | 0.07 |
| 7261 | 1994 May 4 | 600 | 2.2 | 0.01 |
| 7278 | 1995 Dec 29 | 300 | 1.5 | 0.19 |
| 7306 | 1995 Dec 28 | 600 | 1.5 | 0.19 |
| 7323 | 1994 May 5 | 600 | 2.2 | 0.01 |
| 7356 | 1995 May 27 | 900 | 1.4 | 0.07 |
| 7399 | 1994 May 6 | 600 | 2.4 | 0.01 |
| 7408 | 1994 May 3 | 600 | 1.9 | 0.01 |
| 7490 | 1994 May 4 | 300 | 2.2 | 0.01 |
| 7524 | 1995 Dec 29 | 300 | 1.6 | 0.19 |
| 7534 | 1994 May 5 | 670 | 2.5 | 0.01 |
| 7559 | 1994 May 7 | 600 | 1.7 | 0.06 |
| 7577 | 1994 May 2 | 1200 | 1.9 | 0.02 |
| 7592 | 1994 May 4 | 45 | 2.6 | 0.01 |
| 7599 | 1996 May 11 | 600 | 1.0 | 0.02 |
| 7603 | 1994 May 5 | 420 | 2.2 | 0.01 |
| 7608 | 1994 May 6 | 1200 | 2.0 | 0.01 |
| UGC | date | seeing | ||
| sec | ′′ | mag | ||
| (1) | (2) | (3) | (4) | (5) |
| 7648 | 1994 May 7 | 60 | 2.0 | 0.06 |
| 7651 | 1994 May 7 | 60 | 2.0 | 0.06 |
| 7673 | 1996 May 11 | 600 | 1.5 | 0.02 |
| 7690 | 1994 May 3 | 600 | 1.9 | 0.01 |
| 7698 | 1994 May 5 | 1200 | 2.0 | 0.01 |
| 7723 | 1995 Feb 3 | 300 | 2.0 | 0.51 |
| 7831 | 1994 May 2 | 120 | 2.1 | 0.02 |
| 7853 | 1995 Dec 27 | 900 | 1.3 | 0.06 |
| 7861 | 1995 Dec 27 | 1800 | 1.2 | 0.07 |
| 7866 | 1994 May 3 | 600 | 2.1 | 0.01 |
| 7872 | 1995 May 28 | 600 | 2.0 | 0.04 |
| 7907 | 1995 Dec 29 | 300 | 1.6 | 0.19 |
| 7916 | 1994 May 4 | 1500 | 2.1 | 0.01 |
| 7949 | 1994 May 5 | 1200 | 1.9 | 0.01 |
| 7971 | 1995 Feb 3 | 600 | 2.2 | 0.51 |
| 8005 | 1994 May 6 | 600 | 1.8 | 0.01 |
| 8024 | 1994 May 7 | 600 | 1.8 | 0.06 |
| 8098 | 1994 May 3 | 660 | 1.9 | 0.01 |
| 8188 | 1994 May 4 | 600 | 2.2 | 0.01 |
| 8201 | 1994 May 7 | 600 | 2.4 | 0.06 |
| 8286 | 1995 Feb 3 | 300 | 1.8 | 0.51 |
| 8303 | 1995 May 28 | 600 | 1.3 | 0.07 |
| 8320 | 1994 May 3 | 600 | 2.0 | 0.01 |
| 8331 | 1994 May 5 | 600 | 1.7 | 0.01 |
| 8441 | 1995 May 29 | 600 | 1.7 | 0.04 |
| 8489 | 1995 May 29 | 600 | 2.0 | 0.04 |
| 8490 | 1994 May 2 | 360 | 2.2 | 0.02 |
| 8508 | 1995 May 28 | 600 | 1.6 | 0.07 |
| 8550 | 1994 May 3 | 600 | 1.8 | 0.01 |
| 8565 | 1995 May 29 | 600 | 3.0 | 0.04 |
| 8651 | 1994 May 4 | 600 | 1.7 | 0.01 |
| 8683 | 1994 May 5 | 1200 | 1.9 | 0.01 |
| 8760 | 1994 May 6 | 900 | 2.0 | 0.01 |
| 8837 | 1994 May 4 | 600 | 1.9 | 0.01 |
| 8892 | 1996 May 12 | 600 | 1.4 | 0.02 |
| 9018 | 1996 May 11 | 600 | 1.6 | 0.02 |
| 9128 | 1995 May 28 | 600 | 1.3 | 0.07 |
| 9211 | 1994 May 5 | 1200 | 2.2 | 0.01 |
| 9219 | 1995 May 28 | 600 | 1.5 | 0.07 |
| 9240 | 1994 May 5 | 1800 | 2.1 | 0.01 |
| 9405 | 1995 May 29 | 600 | 2.4 | 0.04 |
| 9426 | 1995 May 28 | 900 | 1.5 | 0.07 |
| 9769 | 1996 May 14 | 600 | 1.9 | 0.01 |
| 9906 | 1994 May 5 | 1380 | 2.3 | 0.01 |
| 9992 | 1995 May 29 | 600 | 2.1 | 0.04 |
| 10736 | 1996 May 12 | 600 | 1.4 | 0.02 |
| 10792 | 1996 May 12 | 1200 | 1.4 | 0.02 |
| 10806 | 1996 May 11 | 600 | 1.8 | 0.02 |
| 11283 | 1996 May 12 | 720 | 1.3 | 0.02 |
| 11557 | 1994 May 6 | 420 | 1.5 | 0.01 |
| 11707 | 1996 May 14 | 600 | 1.8 | 0.01 |
| 12048 | 1994 Dec 3 | 300 | 2.6 | 0.02 |
| 12060 | 1994 Dec 3 | 600 | 2.4 | 0.02 |
| 12212 | 1994 Dec 3 | 480 | 2.8 | 0.02 |
| 12554 | 1995 Dec 23 | 300 | 0.9 | 0.02 |
| 12632 | 1995 Dec 23 | 600 | 0.9 | 0.02 |
| 12732 | 1994 Dec 3 | 600 | 2.6 | 0.02 |
| UGC | date | seeing | ||
| s | ′′ | mag | ||
| (1) | (2) | (3) | (4) | (5) |
| 731 | 23 Dec 1995 | 600 | 1.0 | 0.03 |
| 1281 | 24 Dec 1995 | 900 | 1.1 | 0.09 |
| 1501 | 24 Dec 1995 | 600 | 1.1 | 0.09 |
| 2800 | 23 Dec 1995 | 600 | 1.1 | 0.03 |
| 3060 | 24 Dec 1995 | 600 | 1.3 | 0.09 |
| 3137 | 5 Feb 1995 | 600 | 1.6 | 0.45 |
| 3144 | 24 Dec 1995 | 600 | 1.2 | 0.03 |
| 3273 | 25 Dec 1995 | 600 | 1.3 | 0.12 |
| 3317 | 24 Dec 1995 | 600 | 1.2 | 0.03 |
| 3371 | 24 Dec 1995 | 900 | 1.4 | 0.09 |
| 3384 | 26 Dec 1995 | 900 | 1.7 | 0.12 |
| 3390 | 26 Dec 1995 | 600 | 1.1 | 0.12 |
| 3475 | 27 Dec 1995 | 900 | 1.0 | 0.12 |
| 3647 | 26 Dec 1995 | 900 | 1.8 | 0.12 |
| 3698 | 27 Dec 1995 | 900 | 1.0 | 0.12 |
| 3851 | 28 Dec 1995 | 180 | 1.6 | 0.12 |
| 3860 | 26 Dec 1995 | 600 | 1.4 | 0.12 |
| 4274 | 26 Dec 1995 | 300 | 1.7 | 0.12 |
| 4278 | 28 Dec 1995 | 300 | 1.5 | 0.02 |
| 4305 | 28 Dec 1995 | 180 | 1.7 | 0.04 |
| 4325 | 24 Dec 1995 | 300 | 1.2 | 0.03 |
| 4660 | 24 Dec 1995 | 600 | 1.6 | 0.03 |
| 5040 | 26 Dec 1995 | 600 | 1.5 | 0.12 |
| 5336 | 24 Dec 1995 | 900 | 1.2 | 0.03 |
| 5829 | 3 Feb 1995 | 600 | 2.6 | 0.45 |
| 6151 | 26 Dec 1995 | 600 | 1.3 | 0.12 |
| 6713 | 3 Feb 1995 | 600 | 2.4 | 0.45 |
| 6912 | 3 Feb 1995 | 600 | 1.7 | 0.45 |
| 7199 | 27 May 1995 | 600 | 2.5 | 0.09 |
| 7232 | 27 May 1995 | 800 | 2.8 | 0.09 |
| 7356 | 27 May 1995 | 900 | 1.7 | 0.09 |
| 7399 | 28 May 1995 | 600 | 2.5 | 0.05 |
| 7534 | 5 May 1994 | 60 | 1.9 | 0.01 |
| 7577 | 2 May 1994 | 1200 | 2.2 | 0.02 |
| 7861 | 24 Dec 1995 | 1800 | 1.1 | 0.03 |
| 7872 | 28 May 1995 | 600 | 2.8 | 0.05 |
| 8303 | 28 May 1995 | 600 | 6.8 | 0.09 |
| 8441 | 29 May 1995 | 600 | 1.9 | 0.05 |
| 8489 | 29 May 1995 | 900 | 2.5 | 0.05 |
| 8508 | 28 May 1995 | 600 | 3.4 | 0.09 |
| 8565 | 29 May 1995 | 600 | 2.9 | 0.05 |
| 9128 | 28 May 1995 | 900 | 3.8 | 0.09 |
| 9219 | 29 May 1995 | 600 | 2.8 | 0.05 |
| 9992 | 29 May 1995 | 600 | 3.4 | 0.05 |
| 12554 | 23 Dec 1995 | 300 | 1.0 | 0.03 |
| 12632 | 23 Dec 1995 | 600 | 1.0 | 0.03 |
| UGC | PA | MR | ||||||||||||||
|---|---|---|---|---|---|---|---|---|---|---|---|---|---|---|---|---|
| (1) | (2) | (3) | (4) | (5) | (6) | (7) | (8) | (9) | (10) | (11) | (12) | (13) | (14) | (15) | (16) | (17) |
| 192a | 0.474 | 133 | 9.75 | 9.93 | 9.79 | 24.08 | 21.35 | 20.76 | -15.21 | 0.05 | 92.7 | 1015 | – | 74 | 145 | 239 |
| 731 | 0.506 | 73 | 13.50 | 13.52 | 13.29 | 24.95 | 21.86 | 22.24 | -16.63 | 0.02 | 45.8 | 249 | – | 29 | 63 | 104 |
| 1249b | 0.629 | 151 | 11.63 | 11.60 | 11.58 | 25.78 | 22.13 | 21.05 | -17.94 | 0.22 | 56.4 | 396 | 463 | 42 | 91 | 144 |
| 1281 | 0.872 | 40 | 12.72 | 12.61 | 12.61 | 26.64 | 21.00 | 20.51 | -16.17 | 0.02 | 45.9 | 359 | 582 | 41 | 79 | 133 |
| 1438b | 0.347 | 87 | 12.70 | 12.65 | 12.65 | 27.62 | 19.59 | 19.52 | -18.27 | 0.22 | 13.6 | 140 | 184 | 11 | 22 | 41 |
| 1501 | 0.774 | 1 | 11.70 | 11.65 | 11.63 | 26.10 | 21.28 | 20.65 | -17.27 | 0.02 | 58.5 | 448 | 592 | 47 | 93 | 158 |
| 1547 | 0.000 | 90 | 14.02 | 13.74 | 13.70 | 26.50 | 21.30 | 21.63 | -17.98 | 0.05 | 15.6 | 98 | 162 | 12 | 27 | 54 |
| 1551 | 0.105 | 119 | 13.63 | 13.49 | 13.45 | 27.37 | 21.25 | 21.74 | -18.26 | 0.05 | 22.1 | 132 | 169 | 18 | 35 | 57 |
| 1865 | 0.152 | 65 | 14.03 | 13.90 | 13.58 | 25.46 | 22.39 | 22.59 | -16.56 | 0.02 | 29.3 | 130 | 196 | 21 | 45 | 82 |
| 2014b | 0.604 | 176 | 14.49 | 14.33 | 14.26 | 26.28 | 22.38 | 22.12 | -15.86 | 0.22 | 26.2 | 136 | 196 | 20 | 40 | 64 |
| 2017 | 0.500 | 45 | 15.62 | 15.37 | 15.19 | 25.69 | 23.11 | 22.73 | -16.02 | 0.05 | 21.1 | 90 | 169 | 16 | 32 | 51 |
| 2023 | 0.000 | 89 | 13.31 | 13.16 | 13.01 | 25.85 | 22.07 | 21.79 | -17.20 | 0.02 | 25.3 | 152 | 214 | 20 | 42 | 77 |
| 2034 | 0.000 | 90 | 12.93 | 12.85 | 12.67 | 25.46 | 21.76 | 21.56 | -17.45 | 0.05 | 25.5 | 155 | 220 | 21 | 42 | 77 |
| 2053 | 0.630 | 38 | 14.73 | 14.57 | 14.54 | 26.75 | 22.66 | 21.46 | -16.02 | 0.05 | 19.3 | 124 | 169 | 19 | 34 | 54 |
| 2455 | 0.165 | 37 | 11.42 | 11.38 | 11.36 | 26.36 | 19.70 | 19.64 | -18.47 | 0.05 | 23.2 | 231 | 298 | 18 | 38 | 69 |
| 2603b | 0.588 | 64 | 14.68 | 14.54 | 14.44 | 25.97 | 21.85 | 21.99 | -18.88 | 0.18 | 25.1 | 142 | 257 | 20 | 40 | 61 |
| 2800 | 0.604 | 106 | 13.46 | 13.31 | 13.28 | 26.26 | 20.14 | 20.69 | -19.06 | 0.02 | 28.5 | 210 | 319 | 22 | 44 | 77 |
| 3056b | 0.534 | 120 | 10.55 | 10.56 | 10.52 | 24.90 | 16.19 | 20.33 | -17.34 | 0.22 | 57.9 | 500 | – | 16 | 35 | 83 |
| 3060 | 0.789 | 24 | 10.97 | 10.93 | 10.92 | 25.88 | 20.61 | 20.31 | -17.39 | 0.07 | 77.8 | 708 | 907 | 63 | 129 | 227 |
| 3137b | 0.765 | 74 | 13.2 | 12.9 | 12.9 | 27.1 | 20.9 | 22.7 | -18.7 | 0.51 | 64.7 | 283 | 457 | 27 | 58 | 127 |
| 3144 | 0.516 | 113 | 13.84 | 13.73 | 13.69 | 26.49 | 21.28 | 21.27 | -18.08 | 0.02 | 22.3 | 161 | 203 | 18 | 35 | 64 |
| 3273a,b | 0.603 | 38 | 13.4 | 13.3 | 13.3 | 25.8 | 21.0 | 21.3 | -17.1 | 0.51 | 25.1 | 178 | 249 | 17 | 38 | 69 |
| 3317 | 0.355 | 18 | 14.84 | 14.57 | 14.47 | 27.08 | 22.51 | 22.37 | -17.24 | 0.02 | 21.8 | 111 | 150 | 17 | 36 | 58 |
| 3371 | 0.378 | 130 | 13.64 | 13.28 | 13.07 | 26.01 | 22.43 | 22.78 | -17.74 | 0.07 | 52.6 | 213 | 339 | 38 | 79 | 134 |
| 3384b | 0.000 | 135 | 14.51 | 14.49 | 14.44 | 25.17 | 21.21 | 21.25 | -17.31 | 0.18 | 9.7 | 96 | – | 9 | 21 | 38 |
| 3390a,b | 0.357 | 41 | 13.31 | 13.24 | 13.16 | 26.05 | 19.93 | 21.39 | -18.67 | 0.18 | 22.5 | 140 | 182 | 15 | 33 | 58 |
| 3475 | 0.421 | 73 | 13.51 | 13.55 | 13.44 | 24.68 | 20.15 | 20.49 | -17.06 | 0.05 | 18.4 | 158 | – | 15 | 30 | 49 |
| 3647b | 0.000 | 34 | 14.06 | 13.83 | 13.69 | 26.05 | 22.12 | 22.18 | -17.71 | 0.18 | 20.4 | 104 | 228 | 16 | 33 | 61 |
| 3698b | 0.294 | 179 | 14.66 | 14.47 | 14.46 | 26.44 | 21.85 | 20.85 | -15.42 | 0.18 | 10.3 | 80 | 133 | 11 | 19 | 35 |
| 3711 | 0.385 | 101 | 12.18 | 12.18 | 12.13 | 25.05 | 18.86 | 20.38 | -17.76 | 0.01 | 21.9 | 183 | – | 12 | 26 | 53 |
| 3817b | 0.000 | 90 | 15.34 | 14.94 | 14.76 | 26.15 | 23.15 | 22.54 | -15.13 | 0.22 | 15.9 | 72 | 129 | 14 | 28 | 49 |
| 3851 | 0.642 | 28 | 11.02 | 10.92 | 10.89 | 25.76 | 21.82 | 21.44 | -16.86 | 0.02 | 87.9 | 594 | 1034 | 77 | 135 | 246 |
| 3860b | 0.482 | 24 | 14.48 | 14.33 | 14.29 | 26.57 | 23.23 | 21.60 | -15.00 | 0.18 | 17.9 | 115 | 159 | 15 | 29 | 51 |
| 3966 | 0.000 | 90 | 14.56 | 14.40 | 14.14 | 25.88 | 23.14 | 22.24 | -14.87 | 0.02 | 18.6 | 94 | 143 | 19 | 34 | 59 |
| 4173 | 0.397 | 138 | 14.30 | 13.58 | 13.37 | 26.56 | 22.37 | 23.77 | -17.81 | 0.02 | 61.4 | 133 | 294 | 28 | 78 | 139 |
| 4274b | 0.075 | 158 | 11.29 | 11.27 | 11.23 | 25.37 | 19.77 | 20.66 | -17.95 | 0.18 | 23.2 | 185 | 257 | 15 | 23 | 46 |
| 4278 | 0.882 | 173 | 12.47 | 12.45 | 12.45 | 25.78 | 20.29 | 20.20 | -17.73 | 0.02 | 45.4 | 348 | 454 | 34 | 68 | 112 |
| 4305 | 0.246 | 30 | 11.11 | 10.98 | 10.93 | 26.44 | 22.21 | 21.38 | -16.78 | 0.01 | 59.7 | 389 | 565 | 56 | 105 | 175 |
| 4325 | 0.356 | 56 | 12.10 | 12.04 | 12.02 | 26.73 | 21.18 | 21.13 | -18.10 | 0.02 | 35.9 | 241 | 304 | 28 | 55 | 91 |
| 4426b | 0.303 | 3 | 14.62 | 14.32 | 14.23 | 27.13 | 22.73 | 22.64 | -14.87 | 0.22 | 24.2 | 113 | 161 | 19 | 40 | 65 |
| 4483b | 0.444 | 167 | 14.48 | 14.51 | 14.27 | 24.84 | 21.96 | 21.79 | -13.59 | 0.18 | 19.2 | 101 | – | 15 | 25 | 46 |
| 4499 | 0.173 | 162 | 13.01 | 12.90 | 12.86 | 26.63 | 20.50 | 21.29 | -17.78 | 0.02 | 21.5 | 149 | 203 | 15 | 36 | 62 |
| 4543 | 0.000 | 90 | 13.56 | 13.28 | 13.22 | 26.69 | 20.61 | 22.02 | -19.24 | 0.05 | 23.0 | 123 | 205 | 15 | 36 | 71 |
| 4660 | 0.000 | 90 | 14.75 | 14.48 | 14.40 | 26.69 | 21.31 | 22.25 | -18.21 | 0.02 | 13.9 | 71 | 113 | 9 | 21 | 41 |
| 4704 | 0.861 | 116 | 13.94 | 13.87 | 13.84 | 25.63 | 21.32 | 21.68 | -16.23 | 0.02 | 43.3 | 246 | 345 | 32 | 63 | 100 |
| 4945 | 0.000 | 90 | 15.02 | 14.89 | 14.46 | 25.48 | 23.00 | 22.77 | -14.67 | 0.02 | 18.4 | 73 | 143 | 15 | 30 | 57 |
| 5040 | 0.000 | 90 | 13.70 | 13.55 | 13.51 | 27.10 | 20.61 | 22.19 | -20.31 | 0.05 | 23.0 | 115 | 151 | 15 | 32 | 53 |
| 5139 | 0.000 | 90 | 13.33 | 13.17 | 12.72 | 25.47 | 24.00 | 22.68 | -16.47 | 0.01 | 42.4 | 182 | 291 | 46 | 81 | 140 |
| 5221 | 0.423 | 143 | 9.72 | 9.72 | 9.71 | 24.96 | 19.36 | 18.69 | -18.61 | 0.02 | 36.1 | 451 | – | 38 | 69 | 114 |
| 5272 | 0.640 | 114 | 13.95 | 13.86 | 13.83 | 26.28 | 22.05 | 21.24 | -15.11 | 0.01 | 21.5 | 142 | 201 | 19 | 36 | 57 |
| 5322b | 0.612 | 63 | 7.70 | 7.70 | 7.69 | 25.24 | -0.07 | 17.33 | -21.23 | 0.18 | 54.5 | 956 | – | 43 | 89 | 166 |
| 5336 | 0.399 | 60 | 14.11 | 13.36 | 13.07 | 25.83 | 23.72 | 23.55 | -14.79 | 0.02 | 70.6 | 184 | 416 | 54 | 108 | 167 |
| UGC | PA | MR | ||||||||||||||
|---|---|---|---|---|---|---|---|---|---|---|---|---|---|---|---|---|
| (1) | (2) | (3) | (4) | (5) | (6) | (7) | (8) | (9) | (10) | (11) | (12) | (13) | (14) | (15) | (16) | (17) |
| 5340 | 0.501 | 8 | 14.57 | 14.44 | 14.37 | 26.07 | 21.85 | 21.99 | -14.57 | 0.01 | 18.9 | 103 | 169 | 13 | 27 | 48 |
| 5364 | 0.497 | 102 | 13.02 | 12.84 | 12.60 | 25.51 | 23.71 | 22.78 | -14.15 | 0.01 | 69.3 | 276 | 455 | 57 | 102 | 165 |
| 5398 | 0.231 | 49 | 9.51 | 9.51 | 9.47 | 25.19 | 17.96 | 19.89 | -18.43 | 0.01 | 51.8 | 478 | – | 25 | 65 | 132 |
| 5414 | 0.416 | 38 | 12.59 | 12.48 | 12.47 | 27.82 | 21.85 | 21.18 | -17.55 | 0.02 | 30.4 | 210 | 270 | 27 | 53 | 85 |
| 5455 | 0.440 | 147 | 15.85 | 15.37 | 15.33 | 27.22 | 23.02 | 22.47 | -16.54 | 0.05 | 15.1 | 68 | 119 | 13 | 26 | 47 |
| 5478 | 0.000 | 42 | 15.19 | 15.04 | 14.57 | 25.42 | 22.62 | 22.91 | -16.80 | 0.07 | 18.7 | 70 | 115 | 15 | 30 | 58 |
| 5612b | 0.193 | 166 | 12.4 | 12.3 | 12.2 | 25.7 | 20.9 | 21.4 | -18.6 | 0.51 | 32.0 | 205 | 251 | 24 | 51 | 86 |
| 5666b | 0.630 | 48 | 10.70 | 10.78 | 10.65 | 24.69 | 22.12 | 22.14 | -17.23 | 0.18 | 137.8 | 779 | – | 111 | 217 | 315 |
| 5688b | 0.360 | 133 | 13.42 | 13.33 | 13.22 | 25.89 | 21.32 | 22.00 | -19.18 | 0.06 | 28.7 | 162 | 214 | 21 | 46 | 76 |
| 5706 | 0.573 | 100 | 16.38 | 15.84 | 15.72 | 26.45 | 23.23 | 23.35 | -16.24 | 0.07 | 21.7 | 71 | 129 | 17 | 33 | 53 |
| 5721 | 0.504 | 96 | 12.60 | 12.59 | 12.58 | 25.40 | 19.15 | 19.47 | -16.58 | 0.02 | 13.6 | 143 | 179 | 11 | 23 | 40 |
| 5740b | 0.358 | 123 | 13.9 | 13.8 | 13.8 | 26.5 | 21.4 | 21.7 | -16.6 | 0.51 | 19.3 | 122 | 166 | 15 | 32 | 55 |
| 5764b | 0.474 | 48 | 15.2 | 14.9 | 14.9 | 27.0 | 22.2 | 21.9 | -14.9 | 0.51 | 14.0 | 81 | 123 | 12 | 24 | 43 |
| 5829 | 0.000 | 81 | 12.86 | 12.59 | 12.46 | 26.39 | 22.60 | 22.43 | -17.33 | 0.01 | 38.8 | 188 | 296 | 33 | 65 | 115 |
| 5846 | 0.142 | 90 | 15.05 | 14.65 | 14.52 | 26.90 | 23.32 | 22.69 | -16.08 | 0.02 | 18.9 | 78 | 126 | 16 | 32 | 54 |
| 5860b | 0.462 | 92 | 12.60 | 12.58 | 12.57 | 26.00 | 17.96 | 19.62 | -18.63 | 0.18 | 11.6 | 119 | 165 | 5 | 13 | 30 |
| 5918 | 0.508 | 83 | 14.91 | 14.22 | 14.05 | 26.15 | 23.28 | 23.43 | -15.38 | 0.01 | 46.2 | 120 | 310 | 31 | 66 | 114 |
| 5935b | 0.609 | 97 | 12.05 | 11.98 | 11.97 | 27.06 | 17.78 | 20.79 | -20.14 | 0.06 | 31.0 | 244 | 326 | 11 | 33 | 77 |
| 5986 | 0.730 | 40 | 11.13 | 11.07 | 11.07 | 26.59 | 19.17 | 20.00 | -18.63 | 0.02 | 45.8 | 419 | 567 | 34 | 72 | 127 |
| 6016b | 0.300 | 56 | 14.8 | 14.6 | 14.5 | 26.2 | 21.7 | 22.6 | -17.6 | 0.51 | 19.4 | 89 | 144 | 13 | 29 | 51 |
| 6021b | 0.000 | 116 | 12.42 | 12.41 | 12.39 | 25.69 | 18.92 | 19.30 | -20.14 | 0.18 | 10.1 | 106 | 132 | 9 | 19 | 32 |
| 6024 | 0.626 | 66 | 11.76 | 11.73 | 11.73 | 26.00 | 19.04 | 19.12 | -20.10 | 0.01 | 19.3 | 207 | 353 | 15 | 32 | 56 |
| 6126b | 0.825 | 164 | 12.52 | 12.50 | 12.49 | 25.32 | 19.73 | 20.16 | -17.26 | 0.06 | 32.1 | 307 | – | 23 | 52 | 94 |
| 6151b | 0.000 | 90 | 14.24 | 13.99 | 13.91 | 27.02 | 22.00 | 22.24 | -17.27 | 0.18 | 18.2 | 98 | 142 | 15 | 32 | 54 |
| 6161b | 0.597 | 49 | 13.53 | 13.44 | 13.41 | 26.31 | 20.59 | 21.41 | -17.14 | 0.06 | 24.0 | 160 | 217 | 15 | 36 | 64 |
| 6251b | 0.112 | 13 | 14.85 | 14.66 | 14.52 | 25.97 | 22.07 | 22.37 | -16.08 | 0.18 | 14.7 | 70 | 106 | 9 | 21 | 40 |
| 6406 | 0.150 | 167 | 12.50 | 12.38 | 12.31 | 26.40 | 17.38 | 23.28 | -19.35 | 0.02 | 39.1 | 124 | 231 | 4 | 11 | 49 |
| 6446 | 0.161 | 26 | 12.17 | 12.10 | 12.05 | 26.23 | 20.30 | 21.17 | -18.35 | 0.02 | 28.5 | 201 | 273 | 19 | 43 | 80 |
| 6456b | 0.547 | 166 | 14.73 | 14.43 | 14.39 | 26.79 | 21.69 | 22.41 | -13.05 | 0.18 | 22.5 | 106 | 177 | 14 | 30 | 61 |
| 6565 | 0.272 | 162 | 11.26 | 11.21 | 11.19 | 26.00 | 19.71 | 20.75 | -16.34 | 0.01 | 32.3 | 253 | 364 | 16 | 36 | 78 |
| 6628 | 0.000 | 90 | 12.34 | 12.17 | 12.08 | 26.62 | 20.95 | 21.79 | -18.85 | 0.01 | 35.8 | 200 | 294 | 28 | 56 | 102 |
| 6682b | 0.190 | 24 | 13.97 | 13.70 | 13.56 | 26.18 | 22.08 | 22.42 | -17.47 | 0.18 | 27.0 | 126 | 200 | 21 | 46 | 78 |
| 6817 | 0.478 | 65 | 13.10 | 13.03 | 12.84 | 25.36 | 22.64 | 22.38 | -15.18 | 0.01 | 48.5 | 230 | 346 | 37 | 70 | 118 |
| 6840 | 0.194 | 72 | 13.52 | 13.30 | 13.22 | 26.59 | 20.88 | 21.83 | -17.77 | 0.02 | 26.3 | 152 | 223 | 16 | 46 | 83 |
| 6912b | 0.315 | 143 | 13.1 | 13.1 | 13.1 | 24.9 | 21.0 | 20.8 | -18.8 | 0.51 | 16.4 | 164 | – | 14 | 30 | 56 |
| 6917b | 0.439 | 125 | 11.6 | 11.6 | 11.6 | 25.5 | 20.0 | 20.7 | -19.6 | 0.51 | 38.6 | 262 | 302 | 28 | 56 | 92 |
| 6944 | 0.547 | 25 | 12.21 | 12.21 | 12.20 | 25.32 | 18.00 | 19.52 | -21.19 | 0.02 | 17.0 | 179 | 213 | 12 | 27 | 52 |
| 6955 | 0.613 | 67 | 13.06 | 12.93 | 12.90 | 26.12 | 22.40 | 22.13 | -17.42 | 0.01 | 50.1 | 252 | 342 | 37 | 69 | 112 |
| 6956 | 0.169 | 142 | 14.42 | 14.00 | 13.81 | 26.89 | 22.09 | 23.24 | -17.19 | 0.01 | 33.4 | 114 | 186 | 21 | 49 | 89 |
| 6995b | 0.100 | 1 | 12.20 | 12.15 | 12.15 | 27.70 | 18.86 | 19.72 | -19.65 | 0.18 | 13.0 | 126 | 170 | 9 | 19 | 37 |
| 7047 | 0.155 | 34 | 12.67 | 12.56 | 12.50 | 26.24 | 21.61 | 21.40 | -15.22 | 0.02 | 27.0 | 171 | 235 | 23 | 43 | 75 |
| 7125 | 0.773 | 85 | 13.21 | 13.13 | 13.12 | 26.23 | 21.04 | 21.19 | -18.34 | 0.01 | 34.2 | 252 | 335 | 25 | 52 | 97 |
| 7151b | 0.770 | 102 | 12.10 | 12.07 | 12.05 | 25.56 | 20.50 | 20.70 | -15.67 | 0.06 | 43.7 | 372 | 508 | 34 | 74 | 135 |
| 7199 | 0.345 | 12 | 12.69 | 12.60 | 12.58 | 26.43 | 20.66 | 20.92 | -15.14 | 0.07 | 21.8 | 165 | 233 | 16 | 33 | 62 |
| 7204b | 0.806 | 134 | 12.3 | 12.3 | 12.3 | 26.5 | 20.6 | 19.8 | -19.3 | 0.51 | 30.4 | 286 | 398 | 29 | 54 | 92 |
| 7232 | 0.178 | 65 | 12.48 | 12.43 | 12.41 | 25.73 | 20.81 | 19.96 | -15.31 | 0.07 | 14.8 | 142 | 206 | 15 | 28 | 47 |
| 7261 | 0.000 | 121 | 12.29 | 12.18 | 12.13 | 26.78 | 20.35 | 21.85 | -17.71 | 0.01 | 35.1 | 204 | 265 | 21 | 50 | 88 |
| 7278b | 0.063 | 20 | 9.45 | 9.41 | 9.39 | 26.51 | 18.90 | 20.15 | -18.33 | 0.18 | 53.3 | 481 | 631 | 32 | 74 | 153 |
| 7306b | 0.733 | 160 | 9.65 | 9.57 | 9.55 | 26.08 | 21.28 | 21.26 | -17.87 | 0.18 | 174.6 | 1212 | 1793 | 139 | 282 | 478 |
| 7323 | 0.246 | 29 | 10.77 | 10.69 | 10.64 | 25.96 | 20.68 | 20.91 | -18.90 | 0.01 | 53.7 | 382 | 527 | 42 | 86 | 145 |
| 7356 | 0.330 | 159 | 14.79 | 14.59 | 14.52 | 26.37 | 22.50 | 21.82 | -13.20 | 0.07 | 15.1 | 88 | 130 | 15 | 28 | 45 |
| 7399 | 0.358 | 126 | 12.57 | 12.52 | 12.50 | 26.18 | 19.62 | 20.25 | -17.12 | 0.01 | 17.8 | 155 | 206 | 14 | 30 | 52 |
| UGC | PA | MR | ||||||||||||||
|---|---|---|---|---|---|---|---|---|---|---|---|---|---|---|---|---|
| (1) | (2) | (3) | (4) | (5) | (6) | (7) | (8) | (9) | (10) | (11) | (12) | (13) | (14) | (15) | (16) | (17) |
| 7408 | 0.279 | 96 | 13.22 | 13.08 | 13.02 | 25.99 | 21.60 | 21.56 | -16.60 | 0.01 | 24.2 | 155 | 234 | 20 | 40 | 71 |
| 7490 | 0.000 | 90 | 12.44 | 12.31 | 12.25 | 26.54 | 21.31 | 21.33 | -17.40 | 0.01 | 27.3 | 180 | 257 | 24 | 47 | 81 |
| 7524b | 0.368 | 131 | 9.76 | 9.65 | 9.58 | 26.04 | 20.97 | 21.70 | -18.14 | 0.18 | 135.1 | 867 | 1111 | 116 | 225 | 395 |
| 7534 | 0.000 | 36 | 13.84 | 13.75 | 13.46 | 25.59 | 0.00 | 22.45 | -16.19 | 0.01 | 24.8 | 120 | 167 | 25 | 42 | 76 |
| 7559b | 0.476 | 157 | 14.14 | 13.87 | 13.87 | 25.69 | 22.80 | 23.08 | -13.66 | 0.06 | 44.6 | 157 | 283 | 26 | 51 | 81 |
| 7577 | 0.577 | 127 | 12.25 | 12.14 | 12.10 | 26.08 | 22.28 | 21.56 | -15.62 | 0.02 | 50.8 | 318 | 451 | 43 | 82 | 137 |
| 7592 | 0.210 | 66 | 9.27 | 9.26 | 9.24 | 25.25 | 18.38 | 20.09 | -18.48 | 0.01 | 50.5 | 454 | – | 26 | 57 | 112 |
| 7599 | 0.474 | 126 | 14.51 | 14.39 | 14.34 | 27.01 | 22.04 | 21.66 | -13.38 | 0.02 | 16.9 | 97 | 128 | 14 | 27 | 43 |
| 7603 | 0.667 | 17 | 12.36 | 12.32 | 12.31 | 26.38 | 20.09 | 19.61 | -16.88 | 0.01 | 20.8 | 204 | 272 | 20 | 37 | 63 |
| 7608 | 0.000 | 90 | 13.63 | 13.29 | 13.19 | 27.15 | 22.26 | 22.63 | -16.43 | 0.01 | 30.4 | 135 | 217 | 22 | 49 | 87 |
| 7648b | 0.313 | 176 | 11.66 | 11.64 | 11.62 | 25.36 | 19.70 | 19.71 | -17.64 | 0.06 | 18.8 | 192 | 264 | 14 | 29 | 55 |
| 7651b | 0.534 | 120 | 9.42 | 9.41 | 9.40 | 25.88 | 18.30 | 18.68 | -20.22 | 0.06 | 40.9 | 447 | 562 | 30 | 67 | 114 |
| 7673 | 0.300 | 35 | 14.92 | 14.54 | 14.48 | 27.15 | 22.73 | 22.42 | -15.16 | 0.02 | 19.2 | 89 | 145 | 17 | 33 | 57 |
| 7690 | 0.000 | 24 | 12.56 | 12.53 | 12.51 | 26.42 | 19.98 | 19.91 | -16.98 | 0.01 | 11.8 | 121 | 148 | 10 | 21 | 40 |
| 7698 | 0.466 | 168 | 13.32 | 12.94 | 12.84 | 26.15 | 23.26 | 22.53 | -14.90 | 0.01 | 50.4 | 226 | 369 | 46 | 86 | 142 |
| 7723b | 0.284 | 117 | 11.6 | 11.6 | 11.6 | 25.2 | 19.5 | 20.6 | -18.7 | 0.51 | 25.4 | 206 | – | 15 | 32 | 63 |
| 7831 | 0.535 | 119 | 9.93 | 9.93 | 9.92 | 25.47 | 18.99 | 18.70 | -18.66 | 0.02 | 32.7 | 402 | 499 | 28 | 55 | 97 |
| 7853b | 0.226 | 10 | 10.39 | 10.38 | 10.35 | 25.25 | 19.17 | 19.75 | -19.11 | 0.06 | 32.1 | 314 | – | 26 | 61 | 101 |
| 7861 | 0.000 | 90 | 12.00 | 11.84 | 11.81 | 27.89 | 19.81 | 23.38 | -17.96 | 0.07 | 44.8 | 134 | 257 | 12 | 25 | 52 |
| 7866 | 0.270 | 10 | 13.40 | 13.25 | 13.18 | 26.09 | 22.08 | 21.79 | -15.23 | 0.01 | 24.7 | 153 | 223 | 20 | 42 | 73 |
| 7872 | 0.324 | 177 | 14.75 | 14.75 | 14.44 | 24.99 | 22.05 | 22.58 | -18.02 | 0.04 | 21.2 | 94 | – | 12 | 29 | 51 |
| 7907b | 0.846 | 35 | 10.64 | 10.51 | 10.51 | 26.27 | 19.85 | 20.53 | -18.98 | 0.18 | 96.0 | 785 | 1300 | 68 | 157 | 299 |
| 7916 | 0.700 | 170 | 14.99 | 14.92 | 14.70 | 25.44 | 23.53 | 23.04 | -14.93 | 0.01 | 42.0 | 153 | 222 | 27 | 50 | 82 |
| 7949 | 0.507 | 74 | 14.34 | 14.13 | 14.05 | 26.35 | 23.08 | 22.28 | -14.37 | 0.01 | 28.0 | 145 | 217 | 26 | 47 | 78 |
| 7971b | 0.200 | 35 | 12.6 | 12.6 | 12.5 | 25.9 | 21.2 | 21.0 | -17.1 | 0.51 | 23.0 | 165 | 209 | 20 | 40 | 68 |
| 8005 | 0.643 | 35 | 11.70 | 11.47 | 11.47 | 26.27 | 20.26 | 20.41 | -20.25 | 0.01 | 36.8 | 381 | 909 | 33 | 76 | 185 |
| 8024b | 0.463 | 33 | 13.88 | 13.69 | 13.64 | 26.35 | 22.57 | 21.77 | -14.78 | 0.06 | 24.5 | 142 | 218 | 23 | 41 | 70 |
| 8098 | 0.647 | 23 | 12.60 | 12.50 | 12.47 | 26.30 | 21.50 | 21.34 | -18.07 | 0.01 | 42.0 | 272 | 376 | 32 | 64 | 112 |
| 8188 | 0.106 | 90 | 11.19 | 11.09 | 10.99 | 25.88 | 22.04 | 21.20 | -17.37 | 0.01 | 52.0 | 352 | 489 | 53 | 101 | 162 |
| 8201b | 0.511 | 94 | 12.85 | 12.71 | 12.68 | 26.97 | 22.71 | 21.08 | -15.79 | 0.06 | 32.4 | 237 | 314 | 39 | 68 | 105 |
| 8286b | 0.759 | 28 | 11.3 | 11.3 | 11.2 | 25.6 | 19.6 | 19.4 | -17.2 | 0.51 | 34.4 | 346 | 431 | 30 | 59 | 101 |
| 8303 | 0.000 | 90 | 13.16 | 12.99 | 12.94 | 26.93 | 21.95 | 21.31 | -18.24 | 0.07 | 18.9 | 136 | 191 | 17 | 33 | 65 |
| 8320 | 0.380 | 150 | 12.53 | 12.47 | 12.38 | 25.36 | 22.35 | 21.49 | -16.47 | 0.01 | 35.3 | 230 | 350 | 31 | 59 | 99 |
| 8331 | 0.691 | 139 | 13.94 | 13.80 | 13.77 | 26.27 | 22.24 | 21.63 | -15.08 | 0.01 | 27.8 | 173 | 248 | 23 | 45 | 77 |
| 8441 | 0.209 | 70 | 14.05 | 13.79 | 13.71 | 27.85 | 22.18 | 22.47 | -17.80 | 0.04 | 25.6 | 119 | 175 | 19 | 40 | 69 |
| 8489 | 0.622 | 104 | 14.04 | 13.95 | 13.93 | 27.19 | 20.56 | 21.27 | -17.58 | 0.04 | 18.0 | 124 | 163 | 12 | 27 | 48 |
| 8490 | 0.398 | 175 | 11.22 | 11.19 | 11.18 | 26.06 | 19.76 | 19.95 | -17.28 | 0.02 | 29.0 | 285 | 360 | 24 | 50 | 90 |
| 8508 | 0.458 | 119 | 13.43 | 13.27 | 13.27 | 27.83 | 21.64 | 20.85 | -14.57 | 0.07 | 18.6 | 140 | 201 | 18 | 34 | 59 |
| 8550 | 0.809 | 169 | 13.12 | 13.05 | 13.05 | 26.37 | 20.34 | 20.16 | -15.57 | 0.01 | 24.2 | 223 | 327 | 21 | 41 | 74 |
| 8565 | 0.304 | 179 | 13.11 | 12.95 | 12.93 | 26.74 | 20.93 | 21.13 | -15.65 | 0.04 | 21.4 | 151 | 230 | 19 | 38 | 66 |
| 8651 | 0.419 | 76 | 13.95 | 13.75 | 13.72 | 27.49 | 22.63 | 21.70 | -15.13 | 0.01 | 22.4 | 139 | 188 | 22 | 41 | 67 |
| 8683 | 0.000 | 90 | 14.40 | 13.82 | 13.78 | 29.84 | 22.28 | 22.49 | -16.72 | 0.01 | 20.5 | 83 | 176 | 15 | 35 | 76 |
| 8760 | 0.640 | 33 | 13.94 | 13.75 | 13.74 | 27.28 | 22.32 | 21.27 | -15.11 | 0.01 | 23.0 | 156 | 228 | 24 | 44 | 72 |
| 8837 | 0.717 | 22 | 12.97 | 12.88 | 12.83 | 25.41 | 21.91 | 21.83 | -15.71 | 0.01 | 49.5 | 284 | 397 | 39 | 76 | 123 |
| 8892 | 0.479 | 52 | 14.33 | 14.02 | 14.00 | 28.22 | 21.86 | 22.01 | -18.31 | 0.02 | 22.2 | 122 | 179 | 19 | 40 | 70 |
| 9018 | 0.277 | 90 | 13.64 | 13.46 | 13.44 | 26.92 | 21.54 | 21.33 | -15.99 | 0.02 | 18.0 | 113 | 181 | 14 | 28 | 51 |
| 9128 | 0.258 | 19 | 14.10 | 13.97 | 13.89 | 26.15 | 22.76 | 21.54 | -14.33 | 0.07 | 17.2 | 110 | 154 | 18 | 32 | 52 |
| 9211 | 0.212 | 107 | 14.61 | 14.51 | 14.29 | 25.93 | 22.56 | 22.38 | -16.21 | 0.01 | 19.4 | 93 | 132 | 15 | 31 | 54 |
| 9219 | 0.496 | 99 | 13.13 | 13.07 | 13.06 | 27.25 | 20.70 | 20.89 | -17.34 | 0.07 | 21.0 | 154 | 193 | 17 | 34 | 56 |
| 9240 | 0.144 | 90 | 12.61 | 12.53 | 12.49 | 26.09 | 21.60 | 20.80 | -15.78 | 0.01 | 20.6 | 160 | 232 | 20 | 37 | 64 |
| 9405 | 0.442 | 147 | 14.09 | 13.91 | 13.85 | 26.38 | 22.00 | 22.18 | -15.55 | 0.04 | 24.6 | 140 | 193 | 19 | 42 | 70 |
| 9426 | 0.000 | 90 | 15.34 | 15.03 | 14.91 | 27.13 | 21.84 | 22.63 | -17.96 | 0.07 | 14.0 | 63 | 96 | 10 | 22 | 40 |
| UGC | PA | MR | ||||||||||||||
|---|---|---|---|---|---|---|---|---|---|---|---|---|---|---|---|---|
| (1) | (2) | (3) | (4) | (5) | (6) | (7) | (8) | (9) | (10) | (11) | (12) | (13) | (14) | (15) | (16) | (17) |
| 9769 | 0.353 | 9 | 13.24 | 13.10 | 13.01 | 26.38 | 20.69 | 22.24 | -18.10 | 0.01 | 33.5 | 170 | 238 | 18 | 44 | 83 |
| 9906 | 0.307 | 51 | 11.98 | 11.86 | 11.81 | 26.08 | 18.73 | 22.73 | -18.87 | 0.01 | 45.5 | 179 | 310 | 9 | 19 | 66 |
| 9992 | 0.319 | 148 | 14.53 | 14.26 | 14.24 | 27.65 | 21.72 | 21.75 | -15.89 | 0.04 | 15.9 | 90 | 149 | 13 | 26 | 49 |
| 10310 | 0.298 | 108 | 13.24 | 13.11 | 13.07 | 26.62 | 21.55 | 21.66 | -17.90 | 0.02 | 24.9 | 158 | 217 | 20 | 42 | 71 |
| 10736 | 0.727 | 156 | 13.81 | 13.75 | 13.73 | 25.95 | 21.11 | 21.13 | -16.71 | 0.02 | 27.1 | 183 | 229 | 21 | 43 | 68 |
| 10792 | 0.339 | 94 | 16.07 | 16.00 | 15.77 | 25.26 | 22.78 | 22.27 | -16.05 | 0.02 | 10.9 | 54 | – | 9 | 17 | 29 |
| 10806 | 0.490 | 81 | 12.87 | 12.83 | 12.83 | 27.10 | 19.85 | 19.94 | -18.45 | 0.02 | 15.1 | 134 | 164 | 13 | 27 | 44 |
| 11283 | 0.000 | 90 | 12.94 | 12.89 | 12.84 | 25.88 | 19.47 | 20.84 | -19.78 | 0.01 | 16.8 | 121 | 155 | 12 | 25 | 43 |
| 11557 | 0.187 | 106 | 12.90 | 12.88 | 12.82 | 25.54 | 20.00 | 20.73 | -19.71 | 0.01 | 26.2 | 171 | 198 | 17 | 34 | 53 |
| 11707 | 0.599 | 56 | 12.97 | 12.93 | 12.77 | 25.62 | 20.66 | 22.08 | -18.60 | 0.02 | 58.0 | 293 | 401 | 29 | 73 | 120 |
| 11861 | 0.392 | 125 | 12.25 | 12.51 | 12.23 | 23.84 | 19.37 | 20.87 | -20.79 | 0.02 | 52.9 | 348 | – | 31 | 60 | 92 |
| 12048 | 0.251 | 125 | 12.21 | 12.16 | 12.14 | 26.82 | 20.30 | 20.05 | -19.13 | 0.02 | 19.0 | 170 | 221 | 16 | 31 | 54 |
| 12060 | 0.000 | 146 | 13.43 | 13.32 | 13.23 | 26.11 | 21.10 | 21.56 | -17.95 | 0.02 | 20.8 | 145 | 195 | 15 | 36 | 64 |
| 12212 | 0.300 | 110 | 14.36 | 14.24 | 14.15 | 26.06 | 21.51 | 21.81 | -16.94 | 0.02 | 17.8 | 115 | 154 | 14 | 30 | 52 |
| 12554 | 0.790 | 168 | 10.67 | 10.62 | 10.62 | 26.67 | 19.34 | 19.90 | -19.44 | 0.02 | 73.2 | 674 | 861 | 55 | 125 | 219 |
| 12632 | 0.441 | 20 | 12.77 | 12.74 | 12.34 | 25.08 | 21.72 | 22.88 | -17.14 | 0.01 | 84.7 | 339 | – | 52 | 112 | 186 |
| 12732 | 0.184 | 6 | 13.04 | 12.73 | 12.69 | 26.93 | 21.51 | 22.14 | -18.01 | 0.01 | 35.4 | 181 | 308 | 25 | 55 | 104 |
| UGC | PA | MR | ||||||||||||||
|---|---|---|---|---|---|---|---|---|---|---|---|---|---|---|---|---|
| (1) | (2) | (3) | (4) | (5) | (6) | (7) | (8) | (9) | (10) | (11) | (12) | (13) | (14) | (15) | (16) | (17) |
| 731 | 0.506 | 73 | 15.12 | 14.43 | 14.14 | 25.78 | 22.98 | 23.27 | -15.78 | 0.03 | 50.5 | 154 | 284 | 34 | 70 | 110 |
| 1281 | 0.872 | 40 | 13.63 | 13.50 | 13.49 | 26.92 | 21.74 | 21.10 | -15.29 | 0.09 | 41.9 | 290 | 405 | 39 | 75 | 121 |
| 1501 | 0.774 | 1 | 12.49 | 12.37 | 12.36 | 27.19 | 21.99 | 21.29 | -16.54 | 0.09 | 55.8 | 376 | 497 | 45 | 90 | 151 |
| 2800 | 0.604 | 106 | 15.61 | 15.08 | 15.06 | 28.35 | 21.97 | 22.16 | -17.28 | 0.03 | 25.5 | 137 | 194 | 23 | 43 | 70 |
| 3060 | 0.789 | 24 | 12.19 | 11.98 | 11.97 | 27.96 | 21.76 | 21.45 | -16.34 | 0.09 | 81.3 | 540 | 773 | 65 | 135 | 237 |
| 3137b | 0.765 | 74 | 15.1 | 14.7 | 14.7 | 27.0 | 22.7 | 22.1 | -16.9 | 0.45 | 29.4 | 156 | 240 | 25 | 47 | 82 |
| 3144 | 0.516 | 113 | 15.32 | 14.87 | 14.84 | 27.19 | 22.35 | 22.36 | -16.93 | 0.03 | 21.1 | 100 | 170 | 18 | 35 | 63 |
| 3273a,b | 0.720 | 42 | 15.00 | 14.68 | 14.64 | 27.00 | 22.00 | 22.74 | -15.79 | 0.12 | 32.3 | 140 | 218 | 21 | 47 | 81 |
| 3317 | 0.355 | 18 | 16.71 | 15.57 | 15.37 | 27.26 | 23.59 | 23.55 | -16.34 | 0.03 | 25.0 | 65 | 133 | 20 | 39 | 64 |
| 3371 | 0.378 | 130 | 16.10 | 14.50 | 14.15 | 26.54 | 23.89 | 23.98 | -16.66 | 0.09 | 57.0 | 103 | 265 | 42 | 82 | 138 |
| 3384b | 0.000 | 135 | 16.41 | 15.53 | 15.27 | 26.60 | 22.44 | 23.37 | -16.48 | 0.12 | 18.1 | 50 | 109 | 12 | 29 | 52 |
| 3390a,b | 0.357 | 41 | 15.51 | 14.99 | 14.95 | 27.91 | 21.58 | 22.62 | -16.88 | 0.12 | 18.6 | 82 | 132 | 16 | 35 | 58 |
| 3475 | 0.421 | 73 | 18.67 | 16.45 | 16.37 | 28.23 | 23.23 | 23.11 | -14.13 | 0.12 | 17.5 | 44 | 109 | 17 | 32 | 50 |
| 3647b | 0.000 | 34 | 15.04 | 13.95 | 13.94 | 28.21 | 22.84 | 22.82 | -17.46 | 0.12 | 18.8 | 76 | 128 | 22 | 60 | 107 |
| 3698b | 0.294 | 179 | 15.74 | 15.35 | 15.33 | 26.53 | 22.97 | 21.72 | -14.55 | 0.12 | 10.1 | 61 | 114 | 11 | 20 | 36 |
| 3851 | 0.642 | 28 | 11.74 | 11.59 | 11.54 | 26.07 | 22.54 | 22.07 | -16.21 | 0.12 | 85.7 | 478 | 675 | 74 | 119 | 218 |
| 3860b | 0.482 | 24 | 15.56 | 15.15 | 15.09 | 27.07 | 23.05 | 22.48 | -14.20 | 0.12 | 18.9 | 79 | 136 | 16 | 29 | 52 |
| 4274b | 0.075 | 158 | 12.49 | 12.42 | 12.38 | 26.27 | 20.95 | 21.90 | -16.80 | 0.12 | 22.4 | 127 | 195 | 14 | 22 | 40 |
| 4278 | 0.900 | 172 | 12.07 | 12.07 | 12.06 | 25.14 | 19.73 | 19.87 | -18.12 | 0.02 | 50.7 | 396 | – | 37 | 76 | 119 |
| 4305 | 0.246 | 30 | 11.86 | 11.67 | 11.55 | 26.70 | 22.94 | 22.28 | -16.16 | 0.04 | 68.1 | 349 | 467 | 60 | 115 | 184 |
| 4325 | 0.356 | 56 | 13.14 | 12.98 | 12.87 | 27.37 | 22.27 | 22.16 | -17.25 | 0.03 | 38.8 | 193 | 254 | 31 | 58 | 96 |
| 4660 | 0.000 | 90 | 16.11 | 15.38 | 15.25 | 27.56 | 22.55 | 23.41 | -17.36 | 0.03 | 16.4 | 46 | 96 | 10 | 25 | 47 |
| 5040 | 0.000 | 90 | 15.23 | 14.73 | 14.42 | 27.57 | 21.95 | 23.49 | -19.40 | 0.12 | 26.4 | 76 | 124 | 19 | 40 | 129 |
| 5336 | 0.399 | 60 | 15.82 | 14.40 | 14.24 | 27.14 | 24.19 | 23.94 | -13.62 | 0.03 | 47.8 | 89 | 228 | 37 | 75 | 125 |
| 5829b | 0.000 | 58 | 13.1 | 12.7 | 12.6 | 26.8 | 22.4 | 22.7 | -17.2 | 0.45 | 40.8 | 179 | 274 | 35 | 69 | 118 |
| 6151b | 0.000 | 90 | 15.50 | 14.88 | 14.79 | 28.14 | 23.18 | 23.11 | -16.39 | 0.12 | 18.3 | 66 | 112 | 16 | 31 | 53 |
| 6713b | 0.179 | 121 | 14.3 | 14.2 | 14.1 | 26.8 | 21.9 | 22.0 | -17.0 | 0.45 | 17.0 | 92 | 131 | 15 | 28 | 47 |
| 6912b | 0.315 | 143 | 14.2 | 13.8 | 13.8 | 27.6 | 21.7 | 21.2 | -18.1 | 0.45 | 12.6 | 112 | 195 | 14 | 33 | 70 |
| 7199 | 0.345 | 12 | 13.78 | 13.60 | 13.58 | 27.27 | 21.34 | 21.82 | -14.14 | 0.09 | 19.9 | 115 | 176 | 14 | 27 | 54 |
| 7232 | 0.178 | 65 | 13.36 | 13.23 | 13.22 | 27.37 | 21.51 | 20.58 | -14.50 | 0.09 | 13.3 | 107 | 158 | 14 | 26 | 43 |
| 7356 | 0.330 | 159 | 16.46 | 15.75 | 15.66 | 27.36 | 23.71 | 23.21 | -12.06 | 0.09 | 16.7 | 56 | 99 | 16 | 29 | 48 |
| 7399 | 0.410 | 126 | 13.42 | 13.28 | 13.28 | 28.49 | 20.34 | 20.93 | -16.34 | 0.05 | 18.4 | 138 | 188 | 16 | 34 | 57 |
| 7534 | 0.000 | 36 | 14.47 | 14.16 | 13.67 | 25.60 | 22.36 | 23.41 | -15.98 | 0.01 | 34.1 | 102 | 177 | 22 | 53 | 137 |
| 7577 | 0.577 | 127 | 13.25 | 12.92 | 12.90 | 27.63 | 22.85 | 22.21 | -14.82 | 0.02 | 46.0 | 232 | 373 | 41 | 77 | 137 |
| 7861 | 0.000 | 90 | 13.10 | 12.89 | 12.85 | 28.17 | 20.61 | 24.02 | -16.92 | 0.03 | 38.4 | 95 | 173 | 12 | 25 | 50 |
| 7872 | 0.324 | 177 | 16.03 | 15.48 | 15.32 | 26.52 | 22.83 | 23.35 | -17.14 | 0.05 | 19.8 | 61 | 117 | 13 | 29 | 51 |
| 8303 | 0.000 | 90 | 14.27 | 13.87 | 13.82 | 27.89 | 22.93 | 22.23 | -17.36 | 0.09 | 19.4 | 91 | 159 | 18 | 33 | 63 |
| 8441 | 0.209 | 70 | 15.31 | 14.61 | 14.48 | 27.90 | 23.35 | 23.40 | -17.03 | 0.05 | 27.8 | 83 | 154 | 21 | 44 | 75 |
| 8489 | 0.622 | 104 | 14.83 | 14.66 | 14.64 | 27.71 | 21.42 | 21.92 | -16.87 | 0.05 | 17.6 | 103 | 145 | 12 | 27 | 47 |
| 8508 | 0.458 | 119 | 14.16 | 14.06 | 13.99 | 25.94 | 22.18 | 21.52 | -13.85 | 0.09 | 18.4 | 112 | 167 | 16 | 31 | 50 |
| 8565 | 0.304 | 179 | 14.09 | 13.83 | 13.81 | 27.52 | 21.39 | 22.08 | -14.77 | 0.05 | 21.5 | 112 | 172 | 16 | 34 | 60 |
| 9128 | 0.258 | 19 | 14.92 | 14.56 | 14.55 | 28.67 | 23.28 | 22.10 | -13.67 | 0.09 | 16.0 | 85 | 128 | 17 | 30 | 51 |
| 9219 | 0.496 | 99 | 14.09 | 13.93 | 13.89 | 27.71 | 21.72 | 21.93 | -16.51 | 0.05 | 23.2 | 127 | 172 | 19 | 37 | 61 |
| 9992 | 0.319 | 148 | 15.53 | 15.11 | 15.07 | 27.42 | 22.62 | 22.57 | -15.94 | 0.05 | 15.9 | 71 | 118 | 13 | 26 | 48 |
| 12554 | 0.790 | 168 | 11.79 | 11.68 | 11.67 | 26.76 | 20.54 | 21.10 | -18.39 | 0.03 | 75.4 | 568 | 744 | 60 | 132 | 221 |
| 12632 | 0.441 | 20 | 15.27 | 13.39 | 13.25 | 28.64 | 22.82 | 24.03 | -16.23 | 0.03 | 94.3 | 150 | 398 | 61 | 125 | 216 |
Appendix B Images and surface brightness profiles
The next pages show an overview of the images, surface brightness profiles and isophotal fits for the 171 late-type dwarf galaxies in the sample. For each galaxy one row with three panels is shown.
The first panel gives the -band image. All images have been put on a common grayscale using the calibration described in Sect. 4, and without correcting for Galactic foreground extinction. On the top left of each panel the UGC number is given, along with at most one other common name (either NGC or DDO). In the lower left a yardstick is shown, where the size depends on the scale of the galaxy. This size is shown above the yardstick and represents 1, 2, 5 or 10 kpc. The white cross near the center of the galaxy gives the adopted center from the isophotal fits (see Sect. 5). The ellipse indicates the orientation parameters, derived from the isophotal fits, that were adopted for each galaxy and that were used to derive the radial surface brightness profile.
The second panel presents the radial surface brightness profile. On the top right the morphological type, the absolute -band magnitude and the conversion between arcseconds and parsecs are given. The arrow on the left side indicates the above sky level. The radial surface brightness profile has not been corrected for Galactic foreground extinction. The radial scale is measured along the major axis.
The third panel gives the results from the isophotal fits with all parameters (center, position angle and ellipticity) free. Note that these are not the data from which the final orientation parameters were derived. These were derived in several steps as described in Sect. 5. Within this panel there are four subpanels. Clockwise from the top left these show the variation of ellipticity, position angle, -position and -position of the center with radius. The dotted line in each panel gives the adopted value for the plotted parameter.
Full version with figures in this appendix can be downloaded from:
http://www.robswork.net/publications/WHISPII.ps.gz