Observations of Hyperluminous Infrared Galaxies with the Infrared Space Observatory††thanks: Based upon observations with ISO, an ESA project with instruments funded by ESA Member States (especially the PI countries; France, Germany, the Netherlands and the United Kingdom) with the participation of ISAS and NASA: Implications for the origin of their extreme luminosities
Abstract
We present 7-180m photometry of a sample of hyperluminous infrared galaxies (HyLIGs) obtained with the photometer and camera mounted on the Infrared Space Observatory. We have used radiative transfer models of obscured starbursts and dusty torii to model their spectral energy distributions (SEDs). We find that IRAS F00235+1024, IRAS F14218+3845 and IRAS F15307+3252 require a combination of starburst and AGN components to explain their mid to far-infrared emission, while for TXS0052+471 a dust torus AGN model alone is sufficient. For IRAS F00235+1024 and IRAS F14218+3845 the starburst component is the predominant contributor whereas for IRAS F15307+3252 the dust torus component dominates. The implied star formation rates (SFR) for these three sources estimated from their infrared luminosities are and are amongst the highest SFRs estimated to date. We also demonstrate that the well-known radio-FIR correlation extends into both higher radio and infrared power than previously investigated. The relation for HyLIGs has a mean value of .
The results of this study imply that better sampling of the IR spectral energy distributions of HyLIGs may reveal that both AGN and starburst components are required to explain all the emission from the NIR to the sub-millimetre.
keywords:
infrared: galaxies - radio continuum: galaxies - galaxies: starburst - galaxies: Seyfert - galaxies: individual: IRAS F15307+3252 - galaxies: individual: IRAS F00235+1024 - galaxies: individual: IRAS F14218+3845 - galaxies: individual: TXS0052+4711 Introduction
Since the discovery of the ’hyperluminous’ galaxies IRAS P09104+4109 (Kleinmann et al., 1988) and IRAS F10214+4724 (Rowan-Robinson et al., 1991) the nature of these extremely luminous sources has been a matter of much interest. Objects with luminosities in excess of 111as per the definition for Hyperluminous Infrared Galaxies (HyLIGs) in Rowan-Robinson (2000). exceed the luminosities of normal spiral galaxies by three to four orders of magnitude and emit more than 95% of their bolometric power in the infrared wavelength range.
As with the lower luminosity ultraluminous infrared galaxies (hereafter ULIGs, ), the underlying power source responsible for such tremendous luminosities is a topic of much debate and remains controversial (the so-called ’Starburst-AGN Controversy’). The space density of HyLIGs was found to be similar to that of quasars of comparable luminosity. This result led to the postulate that such sources are powered by deeply dust enshrouded AGN and may represent an evolutionary stage in the formation of quasars (e.g. Sanders et al., 1988a, b). Alternatively, the high infrared luminosity has been attributed to highly obscured, compact nuclear starburst events (e.g. Soifer et al., 1984; Rowan-Robinson et al., 1984; Condon et al., 1991). IRAS detections of optical and/or radio selected quasars (e.g. Miley et al., 1984; Edelson & Malkan, 1986; Rowan-Robinson & Crawford, 1989) revealed their IR emission to be dominated by a broad component spanning 3-30m. In contrast, the IR emission of starbursts was found to be strongly peaked in the 60-100m range (e.g. Soifer et al., 1984; Rowan-Robinson et al., 1984). The spectral energy distributions (SEDs) of many luminous infrared galaxies (hereafter LIGs) display both peaks. The commonly accepted interpretation is that the IR luminosity is powered by a combination of the two mechanisms. The presence of a deeply dust enshrouded AGN cannot be ruled out in any ULIG/HyLIG. However the presence of an AGN does not imply that it powers all of the infrared emission.
The role of ULIGs and HyLIGs in galaxy evolution remains unclear, as does the evolutionary connection between the coexistent starburst and AGN activity detected in these luminous sources. ULIGs and HyLIGs have been proposed to be the dust enshrouded stage in the evolution of a quasar (Sanders et al., 1988a, b). In this scenario a forming AGN is shielded from detection by an optically thick dust screen. As the AGN becomes more powerful the screen begins to quickly break down revealing the optical quasar (Taniguchi, Ikeuchi, & Shioya, 1999). Alternatively, HyLIGs have been interpreted within galaxy unification schemes as ’misdirected’ QSOs, the high luminosity analogues of Seyfert 2 galaxies (e.g. Barvainis et al., 1995; Hines et al., 1999). As yet, the ubiquity of AGNs in ULIGs/HyLIGs has not been conclusively demonstrated although an increase in the number of ULIGs displaying Seyfert-like characteristics has been recorded beyond (Veilleux, Kim & Sanders, 1999).
The resolution of the starburst-AGN controversy has implications for the star formation history (SFH) of the LIG population. In order to make accurate estimates of obscured star formation rates (SFR), the luminosity due to AGN and starburst activity needs to be quantitatively differentiated. The importance of this issue becomes apparent when one considers the popular belief that ULIGs/HyLIGs are the local analogues of the high redshift sources being detected in sub-millimetre surveys (e.g. Hughes et al., 1998; Ivison et al., 1998). These dusty, high redshift sources may sample the populations contributing to the FIR-sub-millimetre background. Such sources have also been linked to the X-ray background which, at hard X-ray energies, is postulated to have an origin in obscured AGN (Comastri et al., 1995; Fabian et al., 1998). Ultimately the resolution of the ’Starburst-AGN Controversy’ may indicate a connection between these extragalactic backgrounds. Therefore ULIGs/HyLIGs may be exploited as local laboratories to investigate and understand the physical processes occurring at higher redshifts.
Whether HyLIGs simply represent the high luminosity fraction of the well investigated population of ULIGs remains to be conclusively clarified. Yet, this has proved difficult due to the rarity of known HyLIGs. Rowan-Robinson (2000, hereafter RR2000) estimate that there are 100-200 HyLIGs over the whole sky with 222van der Werf et al. (1999) estimate a density of for HyLIGs with . This figure is higher than the estimate of Rowan-Robinson but is highly uncertain since the density is based upon the detection of only one HyLIG in an area of square degrees.. To date, only have been discovered. A number of HyLIGs have been found via correlations of the IRAS catalogues with optical, radio or known active galaxy catalogues leading to a significant bias in the sample of known HyLIGs. Thus the high proportion of AGN-like sources in any HyLIG sample may simply be a selection effect. RR2000 compiled the first, large sample of HyLIGs selected from unbiased IR surveys. In a sample of twelve HyLIGs discovered from direct follow-up of IRAS or 850m surveys, 50% have AGN-like optical spectra. In five of these cases, the MIR bolometric power originating from the AGN exceeds that of the starburst. The proportion of HyLIGs containing AGN is in agreement with the fraction () of Seyferts found in ULIG samples with (Veilleux et al., 1999). However the fraction of sources with bolometrically dominant AGN is higher than that found in ULIG samples (e.g. Genzel et al., 1998).
In this paper we use infrared photometry to investigate the nature of HyLIGs by comparing the resultant infrared SEDs to theoretical models. In order to do so, the broad-band IR emission needs to be well measured at discrete wavelengths over the infrared range. However, for many HyLIGs emission in the MIR-FIR regime is poorly sampled from IRAS data alone, most sources only having one or two reliable333i.e. flagged as good or moderate quality detections in the IRAS catalogues detections in the IRAS catalogues. We have therefore undertaken a photometry program spanning 6.75-180m using the camera (ISO-CAM, Cesarsky et al., 1996) and imaging photometer (ISO-PHOT, Lemke et al., 1996) instruments on board the Infrared Space Observatory (ISO). We compare the data to pure starburst (Efstathiou, Rowan-Robinson & Siebenmorgen, 2000, hereafter ERS00), quasar (Rowan-Robinson, 1995, hereafter RR95) and inclined dust torus AGN (Efstathiou, Hough, & Young, 1995, hereafter EHY95) models to ascertain the nature of the sources. Strong and broadly flat MIR emission will indicate the presence of an obscured AGN. The contribution of the AGN component to the bolometric power can be immediately compared to that in the starburst component by using SEDs plotted in .
We present photometric data for four objects from a sample of HyLIGs all of which have IRAS detections at 60m. These new data (a) enable detailed modelling of the broad-band emission for each HyLIG in this sample (b) provide constraints for and allow the development of generic models for this class of infrared source (c) provide estimates of dust masses and star formation rates for these sources.
The structure of this paper is as follows. Section 2 describes the sample selection and is followed by an explanation of the data reduction methods in Section 3. Section 4 describes background and models used in fitting these sources. The ISO-CAM images and spectral energy distributions are presented in Section 5. The results are discussed in Section 6. We also address as sub-sections of the discussion (a) the implied star formation rates and (b) the extension (in terms of power) of the known FIR/radio luminosity correlation to HyLIGs by combining the IR luminosities with radio data taken from the NRAO VLA Sky Survey (Condon et al., 1998, hereafter NVSS). Finally, a summary of our conclusions is presented in Section 7.
Unless stated otherwise, throughout this paper we adopt .
2 ISO Sample Selection
The original ISO sample of HyLIGs contained all known HyLIGs (fifteen at that time) which were selected using a variety of methods and sampled a full range of optical and radio properties. Each object had at least a 60m detection in the IRAS catalogues and the sample has a median redshift of 1. Due to scheduling constraints only five of these objects were observed444A further five HyLIGs were observed under the ISO central program but are not discussed in this paper. The programs from which these five sources were discovered are described in the ensuing paragraphs.
2.1 IRAS F00235+1024, IRAS F23569-0341
IRAS F00235+1024 and IRAS F23569-0341 were discovered in a systematic, optical identification program carried out with the APM machine at the Institute of Astronomy, Cambridge by McMahon et al. This project uses robust statistical estimators to identify IRAS sources taking into account the IRAS error ellipses and optical magnitudes of all potential optical counterparts. Deep VLA observations were taken of the sources with faint optical associations to confirm the correct optical counterpart to be spectroscopically followed-up. These multi-wavelength investigations led to the discovery of IRAS F00235+1024 and IRAS F23569-0341, both of which display narrow line starburst spectra.
2.2 TXS0052+471
A cross-correlation of the entire IRAS Faint Source Database with the TEXAS radio survey (Douglas et al., 1996) performed by Dey & van Breugel (1995), yielded a sample of radio loud IRAS galaxies of which TXS0052+471 is one of the most luminous [at a redshift of 1.935 (Jarvis et al., 2001)]. Our ISO observations confirm the IRAS reject catalogue detection (FSR0052+4710).
2.3 IRAS F14218+3845
IRAS F14218+3845 was identified within the same observational program which led to the discovery of IRAS F10214+4724 (Rowan-Robinson et al., 1991). Oliver et al. (1996) carried out a systematic redshift survey of 1438 IRAS Faint Source Survey (Moshir et al., 1992) sources with 0.2Jy within a 720 square degree area. IRAS F14218+3845 is one of five HyLIGs found within this survey which together effectively represent a FIR flux limited sample of hyperluminous objects.
2.4 IRAS F15307+3252
IRAS F15307+3252 was discovered by Cutri et al. (1994) within a program investigating objects from the IRAS FSC ‘Warm Extragalactic Object’ survey (Low et al., 1988) with faint optical counterparts. The spectrum of this source exhibits Seyfert 2 characteristics (Kleinmann et al., 1988; Cutri et al., 1994).
It is important to note that IRAS F15307+3252 and TXS0052+471 were discovered using selection techniques biased towards AGN (i.e. samples of galaxies with ’warm’ IRAS colours and the cross-correlation of a radio-loud galaxy with the IRAS catalogues respectively). Whereas, IRAS F00235+1024, IRAS F14218+3845 and IRAS F23569-0341 were discovered in systematic surveys, free from any bias towards AGN.
3 ISO Observations and Data Reduction
Observations were carried out using ISO’s imaging photometer array ISO-PHOT at FIR wavelengths and imaged in the MIR with ISO-CAM. The majority of HyLIGs have two or fewer good or moderate quality IRAS detections. Thus ISO observations have been the only means, to date, of obtaining better sampling of the broad band IR emission of such sources.
Images of the five galaxies were taken using ISO-CAM in CAM01 mode which was normally used for photometric imaging. Observations were carried out using the LW2 (centre 6.75m, range 5.0-8.5m) and LW3 (centre 15m, range 12.0-18.0m) filters with an integration time of 300s. These images were used to (a) determine whether the object is extended in the NIR/MIR (b) obtain more accurate positions than IRAS (c) obtain accurate MIR fluxes derived from aperture photometry from the images.
ISO-PHOT observations were taken using the observation modes PHT03 at 25m and PHT22 at 60, 90 and 180m. These filters were chosen to span the greatest wavelength range and complement the existing IRAS data.
3.1 ISO-CAM Images
Data reduction was performed from the raw data stage using the CAM Interactive Analysis software555The ISO-CAM data presented in this paper was analysed using ’CIA’, a joint development by the ESA Astrophysics Division and the ISO-CAM Consortium. The ISO-CAM consortium is led by the ISO-CAM PI, C. Cesarsky, Direction des Sciences de la Matiere, C.E.A., France. (CIA). Firstly, the actual observations were extracted from the raw data product producing a data cube [image(x,y) against exposure time]. The data cube was processed with corrections applied for dark current, automated and interactive removal of cosmic rays and their remnants (deglitching) and stabilisation of the detector. The images were normalised to ADUs/gain/second. The data cube was then reduced to a single exposure/image. This single image was flatfielded using the internal CIA ISO-CAM flatfield. Finally, the CIA structures were written out to a FITS image file with astrometric calibration.
The resolution of the ISO-CAM images () was insufficient to resolve any structure or morphological information. Since the images were astrometrically calibrated, it was possible to determine the position of each source with an accuracy superior to that of IRAS. Aperture photometry was performed to obtain the NIR/MIR fluxes using a fixed circular aperture with a diameter of 4 pixels666This aperture was chosen following a ’curve-of-growth’ analysis. centred upon the source. Surrounding this aperture, the background flux was determined using an annulus with an inner and outer radius of 2 and 6 pixels respectively. The background flux was subtracted from the flux in the source aperture to give the source flux.
3.2 ISO-PHOT Observations
The data were reduced using PHOT Interactive Analysis (PIA) Software (version 9.1)777PIA is a joint development by the ESA Astrophysics division and the ISO-PHOT Consortium led by MPIA, Heidelberg. Contributing ISO-PHOT Consortium institutes are DIAS, RAL, AIP, MPIK and MPIA. from the edited raw data products. The sources were observed using a chopper throw of three arcminutes in a rectangular configuration. The ISO-PHOT integrations were readout and stored in a series of ramps containing information in time slices. Destructive readouts were discarded and the ramps were corrected for non-linear detector response.
Measurements using ISO-PHOT could be taken in three main modes: staring, where the total exposure time is spent upon the source; maps, where the source under study and its immediate surrounding area are mapped by overlapping pointings; chopped, where the exposure time is divided between an on-source position and an off-source (sky background) position. In this paper we present data from the staring and chopped observation modes which require different reduction methods.
The staring ISO-PHOT-P observations (i.e. 25m) were reduced using the standard procedure. Glitches and their after-effects caused by cosmic ray hits were removed. The ramps were then reduced to a single data point per ramp with further discarding of destructive readouts and glitches. The signal-per-ramp data were combined to give the signal-per-pixel. The signal was calibrated using the internal fine calibration source (FCS) measurement.
Since the IR background at 25m is dominated by zodiacal light, we estimated the IR background for each of our sources using the zodiacal emission model given in Rowan-Robinson et al. (1991) evaluated at the appropriate solar elongation angle at the time of observation. This calculated background was then subtracted from the staring measurement giving the on-source flux. However, due to uncertainties associated with the background model, the 25m flux was greatly over-estimated in comparison to the IRAS limits. As a check, IRAS and COBE/DIRBE background estimates from IRSKY were also subtracted but gave similarly low backgrounds to those calculated from the Rowan-Robinson et al. (1991) model. Therefore, we concluded that data of sufficient resolution are not available to accurately subtract 25m backgrounds for these sources. For this reason the 25m flux has not been included in the subsequent analysis but is considered an upper limit.
Chopping is a widely used observational technique to observe faint sources since higher sampling of the data, from repeated measurements at both on and off-source positions, provides lower noise levels than those obtained from single exposures. In the case of ISO-PHOT, the chopping technique was used to reduce the low frequency detector noise. The technique worked well in eliminating the long-term signal drift of the detector since the drift timescale is longer than that of a chopper cycle (Ábrahám et al., 2001). However, during the mission it was discovered that the chopping technique did not perform according to specifications due to the introduction of additional instrumental effects. An extensive description of the problems associated with this observation template (and their corrections) is given in Ábrahám et al. (2001). These effects include short term detector transients which, for the ISO-PHOT-C detectors, resulted in signal loss (i.e. underestimation of the source flux) due to the on-source integration time being shorter than the detector stabilisation time888the response time taken by the detector to measure the true flux of a source. Thus observations taken with the highest chopper frequencies are most strongly affected (Figure 2b in Ábrahám et al., 2001). A chopper offset effect was also identified which can mimic or hide a real detection caused by inhomogeneous illumination of the focal plane. New deglitching routines were devised specifically for this observation mode since the standard algorithms, devised for staring measurements, were inefficient as the signal was often not stabilised within a chopper plateau.
The severity of the problems associated with the chopped mode was not known until well into the ISO mission by which time the PHT22 data presented here had already been taken999Some 7000 measurements were taken in chopped mode i.e. a substantial fraction of ISOPHOT’s Legacy (Klaas et al., 2001). However, since the problems were identified during the lifetime of ISO, it was possible to obtain calibration measurements in order to determine corrections. The analysis and conclusions derived from such measurements are detailed in Ábrahám et al. (2001). They report that the signal loss due to chopping is dependent upon the on/off-source integration times as well as the flux of the source and background. This effect is found to be quite strong in the C100 detector, where the source flux is significantly underestimated, and less so for the C200 detector (). Ábrahám et al. (2001) describe the calibration issues and have derived corrections which have been implemented in PIA v9.1. In addition they also devised a new reduction method (‘ramp pattern’) for chopped measurements which is a more stable reduction method and is less sensitive to glitches. After the correction for the long term signal drift and application of new deglitching algorithms, the repeated on and off-source data are reduced into a single, high signal-to-noise ‘pattern’ consisting of only eight points (four on-source and four off-source).
The ‘ramp pattern’ method was therefore used to reduce the data. Following power calibration the background measurement was subtracted from the on-source and the result was flux calibrated using the internal FCS1 measurement101010The FCS1 measurement is thought to be more reliable than the FCS2 measurement, so only the FCS1 measurements are used for flux calibration (Ábrahám priv. comm).. For the C100 detector, it is recommended to derive the flux using only the central pixel (pixel 5). This is because the signal loss corrections have been determined solely on data from pixel five (to date).
The point spread function was larger than both of the C100 and C200 detector arrays. Corrections have been estimated for the signal loss for the entire array and for pixel 5 of the C100 array only (Salama, 2000, 2001, ; Klaas priv. comm.). The appropriate factors were applied to the data to correct for the unmeasured flux in the wings of the PSF lying outside the detector array or pixel.
3.3 Error Budget
A signal-to-instrumental noise (comprising the statistical errors propagated through the reduction software) ratio of greater than three was used to determine the significance of source detection. In addition, the uncertainty associated with photometric calibration must also be considered to provide a representative total error on any measurement. The calibration of ISO data has been known to be problematic, but has been intensively investigated for all instruments (Metcalfe and Kessler, 2001) and is now well understood. We consider the calibration status presented in the documents Klaas et al. (2001) for ISO-PHOT and Cesarsky & Blommaert (2000) for ISO-CAM to derive calibration accuracies which are appropriate for our measurements.
3.3.1 ISO-PHOT
The essence of the calibration error for ISO-PHOT lies not only in the chopped mode strategy but also in inaccuracies of the measurement internal FCS calibration source. Many calibration tests have been carried out to quantify the levels of this error for the ISO-PHOT instruments. We use the photometric accuracies from Klaas et al. (2001)111111The accuracies given in this reference are for the offline pipeline processing software (version 10) and are also appropriate to those resulting from an interactive reduction using PIA v9.1 (Klaas priv. comm.).. For the staring observations at 25m the photometric accuracy is 20%. However, investigations into the chopped mode photometry show that, at faint flux levels ( and ), a careful consideration of the cirrus confusion noise is mandatory to determine the overall photometric accuracy of the measurement (Ábrahám et al., 2001; Klaas et al., 2001).
The data for this program was taken in a rectangular chopping mode with a single off-source position. An ISO observer could define the magnitude of the chopper throw, but the actual location of the background measurement was determined by the telescope configuration (i.e. roll angle) at the time of observation. Thus a consideration of the fluctuations in the IR background due to cirrus or unresolved galaxies must be included.
Therefore in the error budget we must consider three sources of error:
instrumental the statistical error propagated through the
reduction software
photometric the error associated with
the accuracy of the calibration measurements
cirrus
confusion the error associated with the IR background measured by the off
source position.
Measurements are generally instrumental noise limited but some may be
limited by the cirrus confusion noise.
The confusion noise was determined using the prescription given in Kiss et al. (2001) (the equation numbers cited in this paragraph are references to the equations in Kiss et al.). Firstly, the zodiacal light contribution was subtracted using estimates from the COBE/DIRBE zodiacal light model (Kelsall et al., 1998) interpolated to the ISO-PHOT wavelengths (Ábrahám and Klaas priv. comm.). The cirrus confusion noise was then calculated using Equation 4 for 60 and 180m and Equation 6 for 90m from Kiss et al. (2001). The noise is also dependent upon the size of the chopper throw (the confusion noise increases with increasing separation between the on and off source positions) and thus the noise is corrected using Equation 7. Finally, a 20% correction is included to account for having only a single off-source position.
For all measurements, bar one, the cirrus confusion noise is much lower than the instrumental noise i.e. the measurements are instrumental noise limited. For these measurements, the standard photometric accuracies given by Klaas et al. (2001) of 30% for ISO-PHOT-C100 and 40% for ISO-PHOT-C200 apply (Klaas priv. comm.). For the cirrus-confusion noise limited measurement (TXS0052+471 at 180m) we apply a calibration error of 50% based upon the level of the cirrus confusion noise (Klaas priv. comm.).
3.3.2 ISO-CAM
The photometric calibration accuracy is given by Cesarsky & Blommaert (2000). For the low flux range of our sources, an accuracy of 30% is appropriate.
4 Models for the infrared emission of galaxies
In this section we give a brief summary of the development of IR models, including a description of the models used to fit the ISO-IRAS SEDs obtained here.
4.1 Background
In general, the emission of IRAS galaxies was modelled using a mixture of
components (e.g. de Jong et al., 1984; Helou, 1986):
(a) an interstellar dust component which is heated by ambient starlight
associated with an old quiescent population. This component was named ’cirrus’
since it has the same characteristics as cirrus seen in the Galaxy i.e.
peaking at 100m with some emission at 60m (Low et al., 1984)
(b) a ’starburst’ component representing warmer emission which is associated
with emission from dust clouds within which active star formation is
occurring. It dominates the IR emission at 50-100m peaking at
60m (Soifer et al., 1984; Rowan-Robinson et al., 1984).
Rowan-Robinson & Crawford (1989, hereafter RRC89) incorporated two improvements in these component models based upon information derived from IRAS colour-colour diagrams and source SEDs. Firstly, they used an exact solution to the radiative transfer problem through star forming regions to improve the model of the starburst component. Secondly, they introduced a third ’Seyfert’ component. This component contributed to the MIR emission and displayed a broad peak at m, reflecting the characteristic IR emission seen in AGN (e.g. Edelson & Malkan, 1986). RRC89 found that their IR starburst model fit the observed SED of the archetypal ULIG Arp 220 extremely well.
Models comprising some combination of the components detailed above provide good fits to the observed SEDs of most IR galaxies. The contribution of each component to the total power varies from source to source. For example, some ULIGs have been observed to have IRAS colours similar to those of Seyferts [ as defined in de Grijp et al. (1985)] and were defined to be ’warm’ ULIGs. The best-fitting models to the SEDs of such sources would include a stronger Seyfert component than is used for modelling ’colder’ IRAS galaxies.
4.1.1 Detailed Pure Starburst Models
Rowan-Robinson & Efstathiou (1993, hereafter RRE93) presented an improved radiative transfer starburst model using the dust grain model of Rowan-Robinson (1992). They found their models fitted the emission of ULIGs well but required a higher optical depth than was needed to explain the emission of less luminous infrared galaxies (i.e. from to ).
’State-of-the-art’ pure starburst models have been developed by ERS00 again using radiative transfer theory. These models include a simple model for the evolution of HII regions surrounding stars, employ an advanced dust grain model containing PAHs (Siebenmorgen & Krügel, 1992) and an evolving stellar population derived from the stellar synthesis codes of Bruzual & Charlot (1993, 1995). The models assume a fixed initial star formation rate which exponentially decays with an e-folding time of 20Myrs. Other variable parameters are the starburst lifetime and initial visual optical depth. The latter parameter (which has four discrete values ) also determines the star formation efficiency of the molecular clouds which is set to be 25% for and halves for each step in . The SEDs of starburst galaxies M82 and NGC 6090 were demonstrated to be well fit by one or a combination of two of the models from this set.
4.1.2 Detailed AGN Models
RRE93 modified the MIR Seyfert model of RRC89 to model the emission of an AGN through an optically thick, spherically symmetric dust shell with density . This model was found to fit the MIR emission of some IRAS galaxies well. Such Seyfert models predict the presence of an unobserved 10m emission feature. RR95 constructed a geometric model of the obscuring material which suppressed this unobserved feature. He assumed the obscuring matter was an ensemble of isolated, approximately spherical, dust shells. The distribution of the obscuring material in this manner caused the emission and absorption of photons at 10m to be approximately equivalent since the shells act as good approximations to a black-body. The shells were located at distances from 1 to 300pc from the central source with density distribution and had dust temperatures in the range of 160-1600K.
Efstathiou & Rowan-Robinson (1995) modelled the IR emission of AGN using accurate solutions of the axially symmetric radiative-transfer problem [an adaptation of the code of Efstathiou & Rowan-Robinson (1990)]. A multi-grain dust model (Rowan-Robinson, 1992) was used, a range of density distributions were explored and three tori geometries were considered; flared disks, tapered disks and anisotropic spheres. On comparison with observational data, they found the best-fitting models to be those with tapered disk geometries with an opening angle consisting of dust grains following density distribution of . Flared disks, anisotropic spheres and tapered disks with different parameters predicted spectra with either too narrow an infrared continuum or strong 10m features. The geometry and density distribution of the preferred tapered disk model suppressed this 10m feature. Based upon these tapered disc models, EHY95 successfully modelled the emission of Seyfert galaxy NGC1068. However, an additional component of optically thin dust (), situated between the narrow and broad line regions, was required to explain all of the infrared emission.
Alternatively, models of warped disks around quasars have been advocated to explain both the MIR and FIR emission of quasars and ULIGs (e.g. Sanders et al., 1989). In such models, the NIR-MIR emission originates from hot dust closest to the central engine which reprocesses nuclear light. The FIR-mm emission emanates from cooler dust located in the outer regions of the warped disk which is also illuminated by the central power source. Warped disk models using radiative transfer theory are yet to be developed. RR95 demonstrated that the existing warped disk models were unable to explain all the IR emission of some PG quasars. Their SEDs were found to be better modelled using a sum of ’disk’, ’Seyfert’ and ’starburst’ components.
4.2 Combined Models
Green & Rowan-Robinson (1996) found that the IR emission of the HyLIG IRAS P09104+4109 was well explained using a flared-disk Seyfert model without any contribution from a starburst. Moreover, Granato, Danese & Franceschini (1996) found that the emission of IRAS F10214, IRAS P09104 and IRAS F15307+3252 could all be modelled using a heavily dust enshrouded quasar with a thick dust torus model (Granato & Danese, 1994) alone. In contrast, Green & Rowan-Robinson (1996) successfully modelled the emission of IRAS F10214+4710, using a radiative transfer model requiring both starburst and flared disk Seyfert components. RR2000 found that a combination of both starburst and AGN models was required to explain the SEDs of over 70% of all HyLIGs known at the time.
In summary, the infrared to sub-millimetre continuum of HyLIGs may be modelled by employing elaborate torus/disk models for AGN. However such models do not conclusively demonstrate the power source of the emission since they often fail to explain all of the emission beyond 50m for which a starburst component is required.
Of the models described above we use the following (and combinations thereof)
to compare to our ISO-IRAS SEDs presented in the subsequent section:
(1) RR95 MIR emission model for quasars
(2) EHY95 inclined dust torus models121212EHY95 derive models to explain
the emission of NGC 1068. We do not employ the NGC1068 models themselves, but
we use the inclined dust torus models which are the basis of the NGC1068
models (i.e. NGC1068 models without the additional conical dust component).
(3) ERS00 pure starburst model131313It is important to note that the
starburst models were developed to explain the IR emission of far less extreme
sources (). Thus parameters such as star formation
efficiency may be underestimated.
5 Results
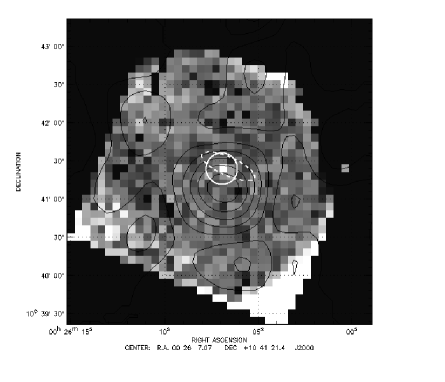
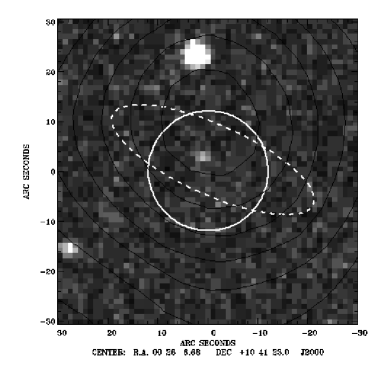
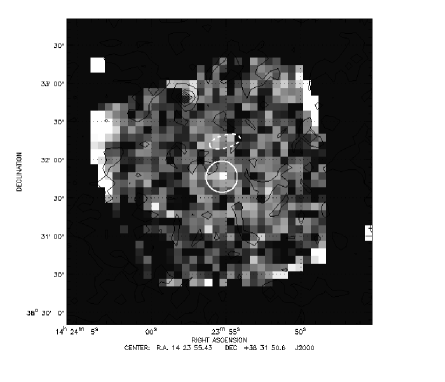
The fluxes and associated errors obtained per source are presented in Table 1. For both ISO-CAM and ISO-PHOT observations, detections were considered to be real if they were at least three sigma detections otherwise a three sigma upper limit is given. ISO-CAM images and SEDs are presented below. Where available, radio flux contours taken from the FIRST survey (Becker, White & Hefland, 1995) are overplotted on the ISO-CAM images, otherwise data from the NVSS survey (Condon et al., 1998) are used. The IRAS Faint Source Catalogue (Moshir et al., 1992) one-sigma positional error ellipses are also shown. The ISO-CAM and ISO-PHOT fluxes were combined with the IRAS data and any previously published IR, sub-mm or optical data to form the SEDs.
These SEDs have been compared to three models of starbursts and Seyferts described in Section 4.2. In the first instance, best-fitting models from the FIR to the MIR for each of these three models were selected using the minimum reduced chi squared estimator. The best-fit of each model type outlined above are overplotted on the SEDs for comparison. From these plots we obtain an idea of which model type is the most dominant contributor (i.e. whether the source is starburst-like or AGN-like). Additionally, this plot demonstrates whether single component models alone are able to explain the emission across the entire IR range.
We also combined the inclined dust torus models of EHY95 with the pure starburst models of ERS00 allowing the contributions of both components to freely vary. It is important to note that by using a combination of the models described in the previous section we are by no means sampling the full parameter space of starburst or AGN models. The number of free parameters we can use is restricted by the sampling of the SED. This enables us to determine the quality of the combined fit by calculating the reduced chi squared () estimator. The combined models with lying between the minimum chi squared value () and were taken to be the best-fitting combinations. The degeneracy within this range of combined models was investigated to determine the best-fitting model. The contribution levels of the starburst and AGN to the total infrared power are then directly obtained from the best-fitting model.
Additionally, optical and/or NIR spectroscopic classification was used to verify consistency with the inclination of the equatorial plane of the dust torus to the line of sight. (The models assume a half opening angle () of . Thus to obtain a narrow-line or Seyfert 2 like spectrum the broad line region must be obscured i.e. the inclination angle must be . For QSO or Seyfert 1 spectral signatures would be seen).
5.0.1 Key
In all cases the ISO-PHOT data is given by and the ISO-CAM by . IRAS good or moderate quality data are given by . Upper limits are plotted as the unfilled symbol , and with a downwards arrow plotted directly below.
Photometric data obtained from literature are also included in the fitting algorithm. They are plotted on the SEDs as unfilled diamonds (with arrows below if upper limits). The source of any additional data is detailed in the figure captions.
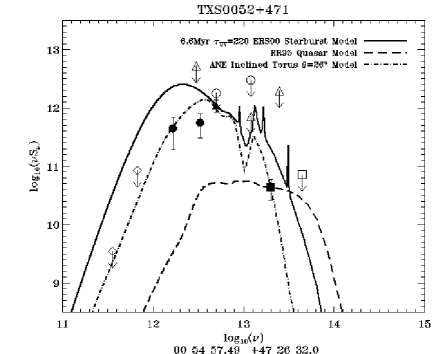
The starburst model (ERS00) is denoted by a solid line, the spherically symmetric quasar and Seyfert model (RR95) by a long dashed line and finally the inclined torus models (EHY95) by a dotted-dashed line in the bottom left part of Figures 1-4.
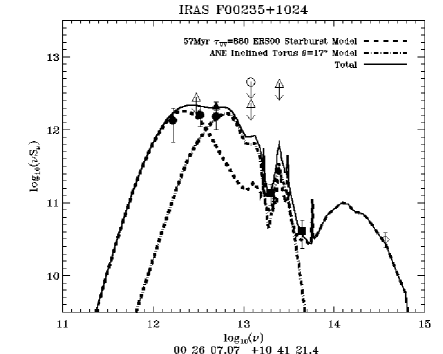
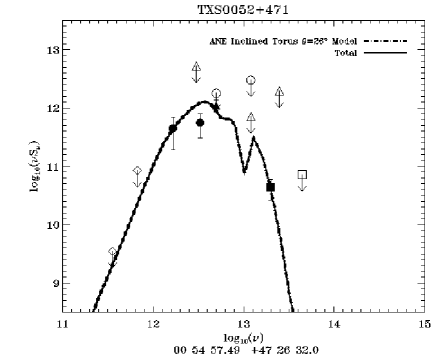
In the combined model SEDs the starburst model is plotted as a long dashed line and the dust torus model as a dashed-dotted line. A solid line represents the best-fitting combined model.
| Name | IRAS F00235+1024 | TXS0052+471 | IRAS F14218+3845 | IRAS F15307+3252 | IRAS F23569-0341 |
|---|---|---|---|---|---|
| Wavelength | Flux | Flux | Flux | Flux | Flux |
| (m) | (mJy) | (mJy) | (mJy) | (mJy) | (mJy) |
| IRAS 12 | |||||
| IRAS 25 | |||||
| IRAS 60 | |||||
| IRAS 100 | |||||
| CAM 6.7 | |||||
| CAM 15 | |||||
| PHOT 25 | |||||
| PHOT 60 | |||||
| PHOT 90 | |||||
| PHOT 180 |
5.1 IRAS F00235+1024
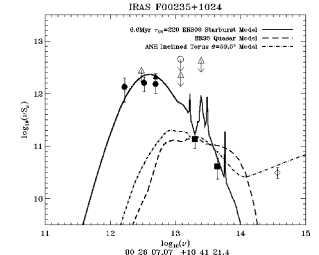
Fluxes are given in Table 1 and the SED is plotted in Figure 1. The IRAS 60m detection is confirmed by ISO-PHOT. We also obtain significant detections at 90 and 180m. The comparison of the IR emission to the single component models reveals that the emission over the entire wavelength range is generally more consistent with a starburst but it does not explain all the data well. The predicted FIR emission by both AGN models is substantially below that of the measured values. Therefore none of the pure starburst or pure AGN models alone can fit the IR emission of this source well.
The selected best-fitting combined model includes a starburst model of age 57Myr and with initial UV optical depth of 880, contributing at a level of 63% to the IR luminosity. The remaining 37% is attributed to a torus model inclined at to the line of sight. Models with have a distribution of contributions with a mean starburst to AGN ratio of . The plotted model reflects this ratio. The mode of the contribution distribution is (not plotted). Such combinations can explain most of the IR emission but greatly overpredict the 90m emission and require an AGN to power all of the optical emission [this is inconsistent with evidence from high resolution I-band imaging (Farrah et al., 2002)]. The distribution of AGN fraction in the low range extends to a maximum 75% AGN contribution. Such composite models over-estimate the emission measured by ISO-CAM and predict a 25m power [in ] of . Without a 20-30m constraint we cannot categorically rule out a stronger AGN in this source. Nevertheless, given the data available, the mean of the combination distribution and the overpredictions found using the extreme AGN contributions (of 10% and 75%) we conclude that it is likely this source is predominantly () starburst fuelled and an AGN component is required to explain full the SED.
The dominance of the starburst contribution to the IR emission of this source determined from the fit of the SED is consistent with observations at other wavelengths. For example, Wilman et al. (1998) find the soft X-ray upper limits from ROSAT-HRI observations are consistent with an origin in a starburst. In addition, the predominant starburst fuelling is consistent with the narrow-line classification based upon the optical spectrum of this object (McMahon et al., in prep.). Moreover, the inclination of the torus model with respect to the line of sight () also supports the narrow line spectral classification and the non-detection of X-rays since both the broad line region and soft X-ray emission would be obscured by the dust torus in the line of sight.
The ISO, IRAS, optical [DSS and HST (Farrah et al., 2002)] and radio (NVSS) source positions are in good agreement.
5.2 TXS0052+471
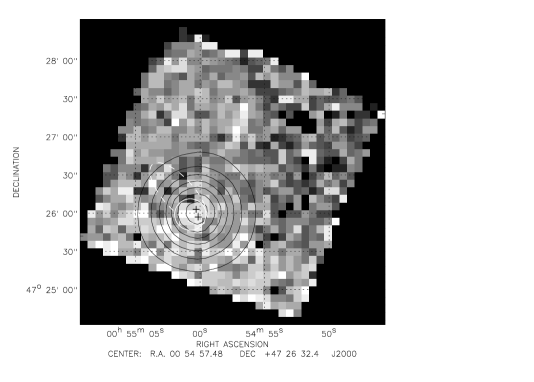
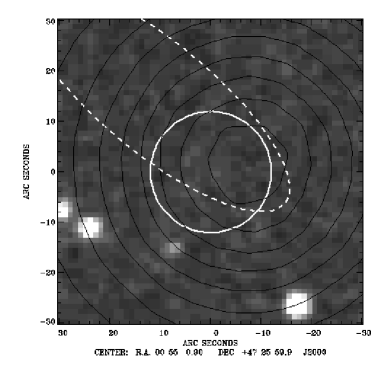
Fluxes are given in Table 1 and the SED is plotted in Figure 2. The IRAS, ISO-CAM and radio positions are coincident (lower left hand corner of the ISO-CAM image). The DSS image of the corresponding region reveals no optical source. Aperture photometry of the ISO-CAM image was therefore performed at this radio peak rather than the pointing centre. This radio position does not lie on the central pixel of the ISO-PHOT C100 detector but lies between pixels 2 and 3 of the array. Therefore the fluxes quoted for the C100 array are calculated from the entire array with the appropriate PSF correction applied. The 60 and 90m fluxes therefore may be underestimated due to signal loss outside the array and in the gaps between the detector pixels 2 and 3.
Nevertheless, these observations provide conclusive evidence that this IRAS Reject Catalogue object is a real infrared source. The SEDs clearly display this source has IR emission more consistent with an inclined torus model rather than any starburst model. The inclined torus model also satisfies the sub-millimetre limits from Ivison (RR2000, priv. comm.). Investigations of the combined model degeneracy reveals that all low models favour a torus model with orientation of with a starburst contribution. However the combined models, which include a low level starburst contribution, are forced to pass extremely close to the sub-millimetre limits and therefore a null starburst contribution is preferred.
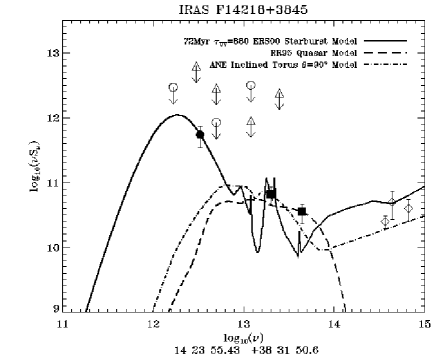
5.3 IRAS F14218+3845
Fluxes are given in Table 1 and the SED is plotted in Figure 3. This source was observed twice by ISO-PHOT and ISO-CAM under two separate programs. We have therefore combined the data from both observations of this source. In total, we have measurements at 60, 65 m and repeated measurements at 6.7, 15, 90 and 180m. The fluxes obtained from both observations are mutually consistent.
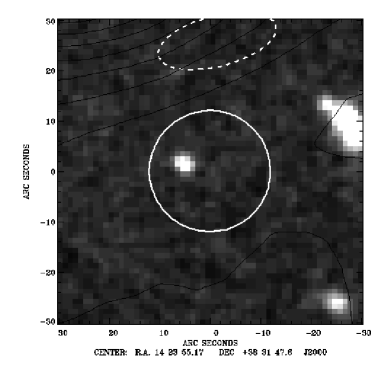
Both ISO-CAM images show a weak source close to the centre of the image which associated with the source seen in the DSS image. The ISO-CAM position lies within the central pixel (pixel 5) of the ISO-PHOT C100 array. Using the pixel 5 fluxes we find that the IRAS 60 and 100m fluxes of 0.565 and 2.1Jy are not confirmed by the measurements taken with ISO-PHOT at 60 and 90m. There is evidence from both the IRAS (the source is flagged as extended at 60 and 100 m) and the C100 observations (flux is recorded in pixels other than pixel 5) that the IRAS fluxes may be contaminated by cirrus. Any starburst or AGN torus could not be greater than one arcminute in extent, as implied by the unresolved IRAS size, which corroborates that the IRAS fluxes are contaminated by cirrus. Such contamination thus explains the lack of confirmation of the high IRAS fluxes by ISO-PHOT. However, at this stage, we cannot exclude the possibility that the emission detected by IRAS originates from more than the central ISO-CAM source. The area around IRAS F14218+3845 needs to be mapped in greater resolution by future FIR instruments for confirmation.
We find that at 60 and 65m the source is not detected in pixel 5. Significant detections are obtained at 90 and 180m and the fluxes obtained from the two repeat observations are consistent within the total errors. At 90m the flux given is derived only from pixel 5 as recommended for the C100 array. The ISO-CAM detection and HST optical position (Farrah et al., 2002) are in agreement and lie within pixel 5 of the C100 array. We are therefore confident that the flux obtained emanates from the identified quasar at . Unfortunately at 180m, the ISO-CAM source lies directly in the centre of the C200 array. Since the emission from the central quasar cannot be separated from any cirrus (or possible additional source) contributions within the C200 array, we use the strongly detected 180m flux only as an upper limit to the 180m emission of the QSO.
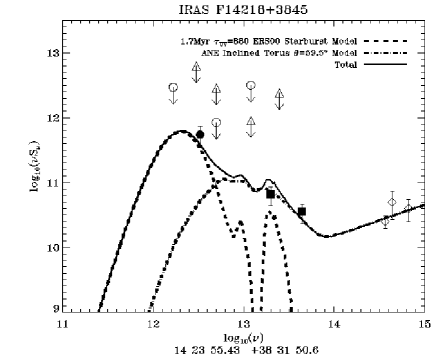
Figure 3 shows the SED obtained for the identified QSO. We used a wide range of torus models (varying in torus opening angle, line of sight orientation and normalisation) to test if the source emission could be explained by a torus model alone. In all cases good fits to the MIR emission failed to explain the 90m emission and models passing through the 90m detection greatly overpredicted the MIR emission by 2-3 orders of magnitude. Therefore a combined model was preferred. As above, the components are allowed to freely vary in contributions. The best-fitting models (i.e. those between ) displayed a common feature where the MIR-optical emission is dominated by the torus emission and the 90m flux explained by a starburst. Degeneracy in the low range () was investigated revealing over 80% of the combined models preferring a power ratio of starburst:torus. The best-fitting model shown in Figure 3 reflects this preference. The combined model consists of a 1.7Myr starburst with an UV optical depth of 880 contributing at a level of 74%, the remainder being accounted for by an torus model inclined at 59.5∘ to the line of sight. This orientation of the torus model with opening angle of ∘ implies the broad line region is visible. The model is therefore consistent with the detection of broad lines in the optical spectrum (Farrah et al., 2002). The best-fitting models also display a slight over-prediction of the 15m emission. It is most likely this is due to the fact that we are not sampling the full parameter space of starburst and AGN models.
Within the low range we can find solutions with AGN contributions as low as 10% and as high as 40%, but for both of these extremes the combined model overpredicts the MIR emission detected by ISO-CAM. The conclusion that the thermal emission is predominantly of starburst origin remains unchanged.
Despite the ISO flux being almost a factor of 10 lower than those detected by IRAS the ISO detected fluxes and fits confirm that the QSO (at a redshift of 1.21) remains a bona fide HyLIG.
5.4 IRAS F15307+3252
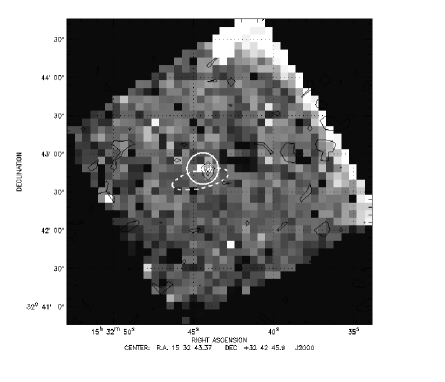
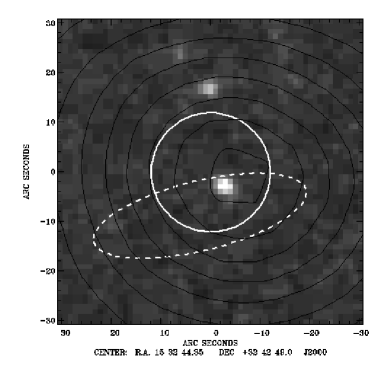
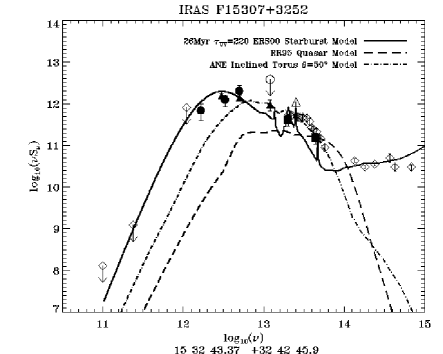
Fluxes are given in Table 1 and the SED is plotted in Figure 4. This object has strong ISO-CAM detections. The IRAS and ISO fluxes are in good agreement. Since this source was observed using ISO-CAM-CVF (Aussel et al., 1998) we could use this data to further constrain the models. This additional data also enabled the use of a wider range of starburst (Efstathiou priv. comm.) as the number of data points greatly exceeds the degrees of freedom. This extended set of starburst models varies not only in starburst age and but also includes a varying time constant for the exponentially decaying star formation rate. In addition, the fraction of optical light that is allowed to ’leak’ out from the giant molecular ’cloud plus star’ systems without absorption and the time after the formation of the star when unabsorbed light begins to leak-out both vary.
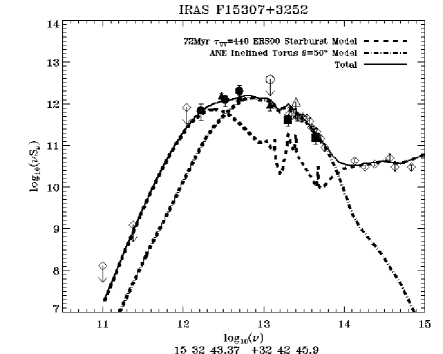
Using this extended set of starburst models together with EHY95 dust torus models with a half-opening angle of , we obtained a moderately good fit for the emission of IRAS F15307+3252 from the optical to the millimetre. The strongest constraint on the fitting in the FIR is the 1250m limit as the high 180m flux forces models to lie close to this limit. Investigating the parameter space between indicates that a starburst contribution to the IR power is favoured by the majority of combinations. Hence we select a combined model where this preference is reflected and has a low .
The fitting of this source has proved difficult since the non-detection of PAH features141414This is widely seen in AGN where PAHs are destroyed by the intense radiation field. in the CVF spectrum (Aussel et al., 1998) greatly limits any starburst contribution. Despite this, a strong starburst component is required to explain the 180m emission since any of the torus or spherically symmetric AGN models cannot explain all the FIR emission beyond 60m. Therefore in addition to the to limits we also include that PAH features should not be significantly detectable above the continuum in the NIR. A starburst contribution is required to explain the FIR emission which must also satisfy the sub-millimetre (taken from Aussel et al., 1998) and millimetre (Yun & Scoville, 1998, hereafter YS98) limits. Figure 4 shows an example of such a combined model, however the CAM 15m and a few of the higher wavelength ISO-CAM-CVF data are overpredicted by the combined model by a factor . This predicted excess could be attributed to either the calibration of the ISO-CAM data or to the fact that the set of starburst and AGN models do not sample the full parameter space. This excess is an unavoidable prediction of the AGN models which are required to fit the NIR-MIR data points and to suppress the PAH features. Therefore all the best-fitting combined models for this source display this 15m excess. To eliminate this problem further development of the models is required which is beyond the scope of this paper.
Approximately 90% of the combined models consist of at least a 55% AGN contribution. The remaining 10% of composite models favour combinations with only a 10-15% AGN contribution. However such models invoke the presence of strong PAH features in the MIR due to the strength of the starburst over AGN model. Due to the lack of detection of such features we exclude these combinations as justifiable alternative fuelling compositions. Therefore our conclusion that this source is predominantly fuelled by an AGN in the infrared remains unchanged.
NIR spectroscopy (Evans et al., 1998), UV/blue spectroscopy (Cutri et al., 1994) and optical spectropolarimetry (Hines et al., 1995) classify this source to be a Seyfert 2. Hines et al. (1995) found 13% of the optical flux to be polarised and detected a broad MgII line in the polarised continuum. Both of these results suggest the presence of an AGN with its light scattered into the line of sight by matter. Also upper limits ( in the 2-10 keV band) from soft X-ray data cannot rule out the presence of a heavily obscured AGN (Ogasaka et al., 1997). This limit was lowered by a factor of four in luminosity ( in the 0.1-2.4keV band) using ROSAT HRI data (Fabian et al., 1996). If an AGN is present in this source, Fabian et al. (1996) state that it must be obscured by matter of extremely high column density which is X-ray absorbing and is Thomson thick (). However, the observed polarisation of optical light in this source (Hines et al., 1995) implies that X-rays emanating from the AGN would also be scattered into the line of sight unless the medium does not contain any free electrons (i.e. the scattering material is dust) or the source is exceptionally weak in X-rays. This then implies that there is little ionised gas in the line of sight which is consistent with low gas masses detected from CO observations (YS98) of . Combining the measured millimetre flux limits with the existing IRAS data, YS98 use the prescription of Hildebrand (1983) and best-fitting black-bodies to determine a dust mass within the range for this source. YS98 comment the IR-sub-millimetre emission properties of IRAS F15307+3252 are quite different to Arp220, commonly referred to as the archetypal starburst ULIG, suggesting that a starburst explanation alone is insufficient and the presence of a energetically significant, obscured AGN is probable.
Overall our results are in agreement with the presence of a strong AGN in this source and corroborate previously published evidence at other wavelengths. The best-fitting model has starburst-to-AGN luminosity ratio of 32%:68%. The best-fitting torus model is inclined to the line of sight by and has a half-opening angle . This orientation implies the broad line region is obscured which is consistent with the Seyfert 2 spectroscopic classification. The SED of this galaxy has also been successfully modelled using a simple dust torus model at an orientation of (Granato, Danese & Franceschini, 1996). This modelling was performed upon IRAS data and optical/NIR photometry (Cutri et al., 1994) alone. We obtain a similar inclination to the line of sight as Granato, Danese & Franceschini (1996) but a starburst contribution is definitely required to explain all of the FIR emission. This contributing best-fitting starburst model has an age of 72Myr, an initial UV optical depth of 440, a starburst e-folding constant of 100Myr and leak fraction of 1.0 beginning 39.8Myr after the formation of the stars.
Liu, Graham & Wright (1996) propose that this galaxy may be a giant elliptical in the process of galactic cannibalism. However, they also highlight that aspects of the morphology are reminiscent of gravitational lensing. However, this view is not supported by recent high resolution imaging using WFPC2 on the HST (see Farrah et al., 2002).
5.5 IRAS F23569-0341
The IRAS 60m flux could not be confirmed and there were no detections in the remaining filters with both ISO-CAM and ISO-PHOT. Hence, upper limits for this source are presented in Table 1 but a SED is not presented.
5.6 Luminosities and Dust Masses
| Name | RA | DEC | z | Age | ||||||||
|---|---|---|---|---|---|---|---|---|---|---|---|---|
| (J2000) | (J2000) | (Myr) | ∘ | |||||||||
| IRAS F00235+1024 | 00 26 04.86 | +10 42 45.3 | 0.58 | 57 | 880 | 11 | 1.28E+09 | 2.29E+13 | 1.45E+13 | 8.42E+12 | 27.3 | 1.68 |
| TXS0052+471 | 00 54 59.95 | +47 25 59.4 | 1.93 | - | - | 26 | - | 1.10E+14 | - | 1.10E+14 | - | - |
| IRAS F14218+3845 | 14 23 58.66 | +38 33 12.1 | 1.2 | 1.7 | 880 | 59.5 | 2.25E+09 | 2.27E+13 | 1.68E+13 | 5.94E+12 | 24.06 | 1.79 |
| IRAS F15307+3252 | 15 32 46.97 | +32 44 03.9 | 0.93 | 72 | 440 | 50 | 1.41E+08 | 4.79E+13 | 1.54E+13 | 3.24E+13 | 30.2 | 1.72 |
Bolometric luminosities and dust masses have been computed from the best-fitting starburst model (parameters given in Table 2). Luminosities were calculated using the standard expressions for luminosity distance (, Equation 1) and luminosity (, Equation 2) where is flux.
| (1) |
| (2) |
Dust masses have been calculated using Equation 3 taken from Green & Rowan-Robinson (1996) with input values taken directly from the best-fitting starburst model.
| (3) |
(assuming no magnification). is the luminosity distance calculated assuming and from Equation 1. is the flux of the model fitted to the observational data and is the flux predicted by the (unfitted) model at a distance of a cloud radius from the central source. However, since the models are calculated at a fiducial distance of 100 times the cloud radius, a factor of is applied to the calculated dust mass. is the optical depth at 1000Å at four discrete values of 220, 440, 660 and 880 (where ). Summations are made over grain types for a given fraction (), mass () and extinction cross-section at 1000Å () to calculate the effective density of dust grains in the cloud (values are taken from Siebenmorgen & Krügel, 1992, and Efstathiou, priv. comm.).
We estimate effective temperatures and emissivities of the FIR emitting dust by fitting a modified black-body spectrum Equation 4 to the FIR tail of the starburst spectrum. The optimal parameters for the modified black body were determined by using an iterative curve fitting routine until the resultant chi-squared values converged giving an optimal set of input parameters. The freely varying parameters are normalisation (N), Temperature (T), emissivity parameter () and reference wavelength ()
| (4) |
For IRAS F00235+1024, IRAS F14218+3845 and IRAS F15307+3252 with starburst contributions, the calculated dust masses are assuming no magnification due to lensing. The mass to luminosity ratios for all sources with starburst contributions [] are -4.25, -4.00 and -5.53 for IRAS F00235+1024, IRAS F14218+3845 and IRAS F15307+3252 respectively. These ratios are broadly consistent with the ratio found for IRAS F10214+4724 of -4.6 (Green & Rowan-Robinson, 1996). The effective FIR temperatures calculated from the modified black-body fits are indicative of large quantities of dust at low temperatures. In addition the values of effective dust emissivity is consistent with values expected for local starburst galaxies ( e.g. Calzetti et al., 2000).
For IRAS F15307+3252 the calculated dust mass from the best-fitting starburst model is which is consistent with dust mass predicted by CO observations (YS98, ). The dust masses calculated by YS98 were based upon black/grey-body fits to the IR-sub-millimetre emission (IRAS data plus sub-mm limits). The dust masses derived from these black-body fits (prescription from Hildebrand, 1983) are generally not accurate since they often underestimate the MIR emission if the fits are normalised to the FIR emission and therefore do not include the mass of the dust responsible for the MIR emission. Also the prescription is heavily dependent upon the value of emissivity chosen. As YS98 indicate, the resulting dust masses calculated based upon the emissivity (and therefore mass opacity coefficient) may be uncertain by at least a factor of three. Nevertheless, the dust mass calculated from our best-fitting combined SED model lies within the dust mass range given by YS98 yielding a gas-to-dust ratio of .
6 Discussion
6.1 The Starburst-AGN Controversy for ULIGs and HyLIGs
Many authors (e.g. Armus, Heckman & Miley, 1989; Veilleux et al., 1995; Sanders & Mirabel, 1996; Shier et al., 1996; Veilleux, Kim & Sanders, 1999) report a general increase in the number of Seyferts in ULIG samples with increasing luminosity samples. If this trend continues beyond then it may be expected that a higher fraction of AGN-like objects in HyLIG than ULIG samples. Moreover, RR2000 found that in a sample of HyLIGs selected from unbiased surveys approximately 50% have IR emission which is predominantly fuelled by an AGN. This fraction is higher than that found in ULIG samples [e.g. 15-25% (Genzel et al., 1998; Veilleux et al., 1999), 20-30% (Lutz, Veilleux & Genzel, 1999) if LINERs are attributed to the HII class] thus corroborating the increase in AGN-like LIGs with increasing luminosity relation.
On the basis of the idea that the number of AGN increases in samples of ULIGs with increasing luminosity, Taniguchi et al. (1999) postulate that it is highly probable that ULIGs are simply the heavily dust enshrouded phase of the formation of a quasar (as was proposed by Sanders et al., 1988a, b). In these scenarios the AGN begins to form following a merger during which time a dust enshrouded starburst phase dominates. After sometime the screen of extremely thick dust, which shields the emission from the forming AGN, begins to break down and the active nucleus becomes exposed. It is postulated that this phase quickly evolves into the optical quasars seen to-day (Lutz et al., 1999).
Barvainis et al. (1995) comment upon the similarity between the 20m to sub-millimetre emission of the Cloverleaf quasar (H1413+117, z=2.558) and F10214 suggesting that they are the high redshift counterparts of narrow and broad line AGN’s respectively differing only in viewing angle. HyLIGs are proposed to be the missing Seyfert 2 analogues to quasars, so called ‘misdirected’ quasars or ‘QSO-2s’ (Hines, 1998), where a QSO is seen if the pole lies along the line of sight and a HyLIG at any other orientation.
Observations of HyLIGs in the hard X-ray regime provide an obscuration independent test of the presence of an AGN since they have sufficient energy to penetrate the obscuring dust torus [a prerequisite for unified AGN models (see Antonucci, 1993, for a review)]. For ULIGs, Eales & Arnaud (1988) found Arp 220 and Mrk 231 to be underluminous in the X-ray from Einstein data and attributed this to absorption by dust in the line of sight. Non-detections of nine ULIGs in the HEAO A-1 database (Rieke, 1988) at higher X-ray energies (i.e. less sensitive to obscuration) required alternative explanations since the interstellar absorption of hard X-rays is low. Rieke (1988) proposed three possibilities; the presence of an X-ray underluminous AGN, delayed AGN activity or a starburst origin for the X-ray emission.
Typically, weak X-ray emission is also seen in HyLIGs. IRAS F10214+4710 was weakly detected by the ROSAT PSPC (Lawrence et al., 1994). Fabian et al. (1994) did measure significant X-ray emission from ASCA observations of HyLIG IRAS P09104+4109 which was subsequently found by Fabian & Crawford (1995) using ROSAT’s HRI to originate from a cooling flow around the galaxy rather than scattered light of an embedded AGN. Fabian et al. (1996) found that IRAS F15307+3252 was undetected in X-rays (using ROSAT HRI) which suggested that either an unusually small fraction of the total power of a possible embedded AGN is emitted in the X-rays or that little nuclear X-ray flux is scattered into the line of sight by electrons. IRAS F15307+3252 was not detected by ASCA but that the ratio of the X-ray upper limit to infrared luminosity was consistent with the presence of a highly obscured QSO (Ogasaka et al., 1997). Moreover, for four HyLIGs; IRAS F00235+1024, IRAS F12514+1027, IRAS F14481+4454 and IRAS F14537+1950, Wilman et al. (1998) detect no confirmed X-ray emission from any of the sources. It is interesting to note that even for F12514+1027 and F14481+4454, which have optical spectral signatures consistent with a Seyfert 2 classification, the upper limits obtained are only consistent if the active nucleus is atypically weak in X-rays or is obscured by . Their soft X-ray emission bears more resemblance to Seyfert 2-starburst combination sources (Wilman et al., 1998).
The CO luminosity (thus molecular gas) measured for SMMJ02399-0136 and SMMJ14011+0252 two sub-millimetre selected hyperluminous galaxies were found to be consistent with a substantial fraction of the infrared luminosity having an origin in star formation (Frayer et al., 1998, 1999). In addition, millimetre emission has been measured from F10214+4724 (Brown & vanden Bout, 1991; Solomon, Downes & Radford, 1992) via CO molecular lines. On the other hand, IRAS F15307+3252 was undetected in CO and at rest-frame 650m (YS98). The derived limits on the molecular gas mass and the gas-to-dust ratios are below those typical for gas rich infrared spirals but within observed ranges (YS98). Additionally, Evans et al. (1998) found that HyLIGs IRAS F15307+3252 and IRAS P09104+4109 presented NIR emission line ratios consistent with those observed for Seyfert 2 galaxies. From non-detection of they determined that the upper limits () on the mass of hydrogen gas to be less than most gas rich IR galaxies. These galaxies also presented the most extreme infrared/CO luminosity ratios known (). Evans et al. (1998) presented this data, in combination with the warm infrared colours, to be indicative of heating of a small amount of dust located close to the AGN. Also, for both IRAS F15307+3252 and IRAS F10214, YS98 noted the FIR luminosity to dust mass ratio to be four times larger than that measured for Arp 220 and thus concluded the values were larger than reasonably expected for starburst dominated sources.
The presence of an AGN in IRAS P09104+4109 and IRAS F15307+3252, is corroborated by detections of broad line regions in polarised light (Hines, 1991; Hines & Wills, 1993; Hines et al., 1995). Also, the detection of a highly polarised giant reflection nebula in IRAS P09104+4109 implies that if the object were viewed from either pole it would be indistinguishable from typical luminous QSOs (Hines et al., 1999). WFPC-2 and NICMOS imaging of IRAS P09104+4109 and IRAS F15307+3252 reveal bipolar morphology (Hines, 1998), again adding credence to the idea that some HyLIGs contain obscured AGN where emission from the central engine can only be observed as light scattered into our line of sight.
In this paper we show that the reality of all the observed HyLIGs, except IRAS F23569-0341, has been confirmed by ISO. The total far-infrared luminosities calculated from the best-fitting models confirm these sources are indeed members of the hyperluminous class and are amongst the most luminous sources known in the Universe. For all four detected sources our results are consistent with previously published results at different wavelengths. With so few sources it is difficult to extrapolate our findings to the entire population. Nevertheless, we can state that ALL of our sources require contributions from an AGN component to completely explain their IR SEDs. This suggests that obscured AGN and the hyperluminous phenomenon are linked. For IRAS F00235+1024 and IRAS F14218+3845 this contribution is below that of the starburst, while for IRAS F15307+3252 and TXS0052+471 it is the dominant or sole contributor respectively. The high fraction of AGN dominated systems in this subset of a sample of galaxies, limited only by observational constraints, supports the postulates of increasing AGN-like sources with IR luminosity. Additionally, we can hypothesise that higher sampling of HyLIG SEDs will reveal the need for an AGN component to explain all of the IR emission (as was seen for all our sources). We therefore conclude from the results of this study, coupled with the multiwavelength data available to date, that it is likely that HyLIGs contain AGN which contribute to the infrared emission. However, they are not energetically dominant in all HyLIGs.
6.2 Star Formation Rates
Accurately quantifying the degree of obscured star formation is crucial for accurate representations of the star formation history of the Universe (e.g. Rowan-Robinson et al., 1997; Calzetti, 1997; Hughes et al., 1998; Pettini et al., 1998; Calzetti & Heckman, 1999). The SFR has been calculated from , optical, UV and FIR luminosities using several approaches. The theory behind the estimators is that the infrared emission is grain re-radiation of UV and optical light from the photospheres of young, massive stars. Hence as the number of young, massive stars increases so does the infrared luminosity. In fact, the massive stars are also prone to becoming supernovae and hence the infrared luminosity scales with the radio. Therefore the same is true for the star formation rates calculated from the radio and infrared luminosities. The contention in the evaluation of the infrared star formation rate lies in the fact that the contribution to the infrared luminosity is not solely from the massive young stars. In fact, Lonsdale Persson & Helou (1987) argued that stars with masses less than five solar mass are significant contributors to the FIR emission from disk galaxies. Additionally, Bothun, Lonsdale, & Rice (1989) highlighted that old disk stars can play a significant part in the heating of grains in normal disk galaxies.
Currently, the majority of estimators used are based upon a selected initial mass function (IMF) since the star formation can then be inferred from the number of stars greater than a given mass and the power they emit. The crux of the determination of SFR is that the lifetimes of massive stars, forming the basis of the radio and IR emission, are much shorter than a Hubble time hence the radio/IR luminosities are directly proportional to the recent star formation rate (Condon, 1992). (This proportionality is thus also reflected in the linear radio/FIR correlation.) Hence, integrating the mass implied by the IMF between given mass limits gives the mass of stars contributing to the luminosity for starburst time period per unit area. Normalising this relation per starburst lifetime gives the mass of stars produced per year i.e. the star formation rate (see Condon, 1992). Following the prescription in Rowan-Robinson et al. (1997), the star formation rate (SFR) for the HyLIGs have been derived using the following approximations:
| (5) |
adopting for a Salpeter IMF and for the efficiency of conversion between optical/UV photons to IR (e.g. Devereux & Young, 1990; Xu, 1990; Calzetti et al., 2000). In this case we use the bolometric luminosity from the integration of the starburst model therefore eliminating the inaccuracies associated with bolometric corrections. Additionally, the rates calculated are inversely proportional to the square of , therefore the SFR is quoted in units of . The star formation rate for TXS0052+471 has not been calculated since our results show that its IR power is derived from an AGN rather than starburst. The calculated star formation rates are , and for IRAS F00235+1024, IRAS F14218+3845 and IRAS F15307+3252 respectively.
6.3 Radio-IR Luminosity Correlation for HyLIGs
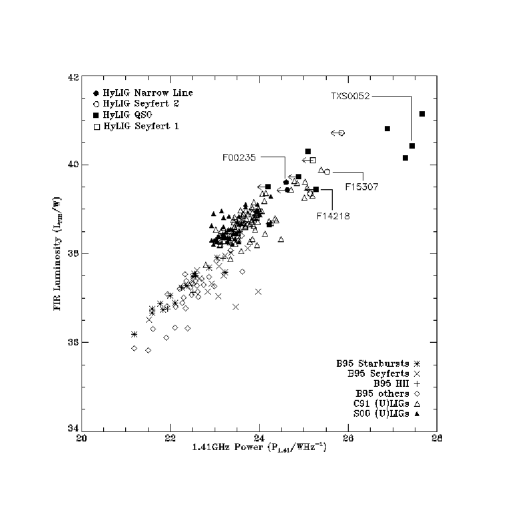
A tight correlation exists, over several orders of magnitude of IR flux, between FIR and radio emission (e.g. Helou, Soifer, & Rowan-Robinson, 1985; Soifer, Neugebauer, & Houck, 1987; Condon, 1992; Sanders & Mirabel, 1996) for normal starburst and Seyfert galaxies. Helou et al. (1985) parameterised the correlation by the logarithmic measure q=log() which has a mean value of 2.34 and a range of 2.0-2.6 for starbursts (Condon et al., 1991). If it is accepted that ULIGs have radio emission of starburst origin [i.e. synchrotron emission from relativistic electrons accelerated in SNRs forming within starburst regions (Harwit & Pacini, 1975)] then it is to be expected that the FIR and radio fluxes are correlated since they have a common source of emission. On the other hand, radio loud quasars and radio galaxies have q values between 0-1 (e.g Golombek, Miley, & Neugebauer, 1988; Knapp, Bies, & van Gorkom, 1990; Impey & Gregorini, 1993; Marx et al., 1994; Roy et al., 1998). Whereas radio quiet quasars follow the same IR-Radio correlation as normal star forming galaxies and ULIGs (Sopp & Alexander, 1991) as do Seyfert galaxies without compact cores (Roy et al., 1998). Smith, Lonsdale, & Lonsdale (1993) and Sanders (1999) interpret this relation between RQQs and ULIGs to add weight to the unification of the two sources, but it is probably only indicative that the radio emission from RQQs originates from star forming regions rather than the active nucleus (Sopp & Alexander, 1991; Cram, North, & Savage, 1992). Condon et al. (1991) also used the dispersion in the radio/infrared correlation to distinguish between starburst (tight correlation) and AGN-like (more disperse) sources. For example, the RMS scatter for a range of galaxy types and samples displaying star forming activity was determined to be 0.2 with a mean value of 2.34 at 1.4GHz (Condon, 1992, and references therein).
Radio detections from the NVSS catalogue (Condon et al., 1998) were sought for the objects in the originally proposed ISO-HyLIG sample (see Table 3). An infrared source was regarded as being associated with a radio source if the one sigma IRAS and NVSS error ellipses overlapped. Figure 5 shows the resultant FIR-to-radio correlation. Many of the sources were not detected in the survey and hence are shown as upper limits i.e. less than 2.7mJy (corresponding to the completeness limit of the NVSS survey). For the HyLIGs the 1.41GHz flux was k-corrected in the form of where assuming a value of for the median spectral index between 1.49 and 8.44GHz (as calculated for ULIGs in Condon et al., 1991).
The far-infrared luminosity from the IRAS fluxes alone is generally calculated using the prescription given in Helou et al. (1985) and Lonsdale et al. (1985)
| (6) |
which effectively mimics the integrated emission between 42.5-122.5m151515A bolometric correction may be applied (). However, we use in this Section and therefore no bolometric correction is applied to the result of Equation 6. Since we have higher sampled SEDs and well fitting modelling the far infrared luminosities for the ISO-observed sources were calculated from the integration of the best-fitting model between 42.5-122.5m to mimic in Equation 6. For the remaining HyLIGs with well sampled SEDs, but without ISO data (see RR2000 Tables 1-4), it was possible to perform similar SED fitting and then determine the far infrared luminosity as for the ISO-observed HyLIGs. For sources with no additional photometric information and with a good or moderate quality IRAS detection at 100m the far infrared luminosity was calculated using Equation 6. However, for sources with only an upper limit at 100m the luminosity was calculated over the integration of a model consistent with available data and satisfying all the upper limits. In this manner the obtained would be more reliable than simply using Equation 6 with a 100m upper limit which would clearly overestimate the far infrared luminosity. The method used for each source is indicated in Table 3 ( is only quoted for the ISO-HyLIG sample).
Figure 5 also shows a selection of published 1.4GHz to FIR luminosity ratios. The sample of Bicay et al. (1995) contains Markarian galaxies for which the spectroscopic types are known and includes both starbursts and Seyferts. From this data the starbursts display a tight correlation whereas the Seyferts are more disperse. For forty LIGs and ULIGs from Condon et al. (1991, also plotted) all but one have radio emission consistent with compact starbursts. They have ratios greater than those expected at lower luminosities. The FIRST-ULIG sample (Stanford et al., 2000) is also overplotted and is in good agreement with the data from Condon et al. (1991). Figure 5 displays that the trend is continued for the higher redshift HyLIGs. Marked on the plot are the objects for which ISO data is presented and also the optical spectroscopic classification from various investigations (see RR2000 Tables 1-4 and references therein). The two narrow line objects occupy a similar region of the plotted region however one has only a 1.4GHz upper limit. The AGNs are more disperse.
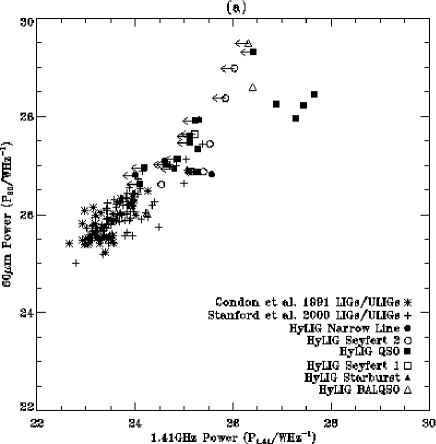
For the sources without ISO detections or poorly sampled SEDs, the FIR luminosity calculated from the models or from the prescription given in Lonsdale et al. (1985) may be inaccurate due to a lack of good quality data points. In order to eliminate these uncertainties from the radio-IR correlation we consider only the IRAS 60m flux to investigate the Radio-FIR correlation as most known HyLIGs sources have at least good/moderate detections in this band161616not true for the new sub-millimetre HyLIGs.. In addition we complement the sample with further HyLIGs with 60m emission included in RR2000. The total sample is given in Table 3 and the resulting data is shown in Figure 6. If the objects have ISO detections, the rest-frame 60m luminosity extrapolated from the best-fitting model is used, otherwise a k-correction is used of the form where and is estimated to be two for starburst galaxies.
| Name | z | Spec. | q | |||||
| Type | (mJy) | (mJy) | ||||||
| IRAS F00235+1024 | 0.58 | NL | 428 | 2.6 | 27.084 | 24.610 | 2.475 | |
| TXS0052+4710 | 1.93 | QSO | 223.2 | 150.5 | 28.223 | 27.445 | 0.778 | |
| SMMJ02399-0136 | 2.803 | S2 | 428 | 28.983 | 26.029 | - | ||
| IRAS P07380-2342 | 0.292 | NL | 1170 | 26.798 | 24.016 | - | ||
| TXS0749+211 | 2.2 | QSO | 155.4 | 31.6 | 28.231 | 26.883 | 1.348 | |
| IRAS F08279+5255 | 3.91 | BALQSO | 511 | 29.496 | 26.321 | - | ||
| IRAS P09104+4109 | 0.44 | S2 | 525 | 15.9 | 26.875 | 25.150 | 1.725 | |
| TXS0925+029 | 2.57 | QSO | 158.7 | 138.0 | 28.440 | 27.661 | 0.779 | |
| IRAS F10026+4949 | 1.12 | S1 | 266 | 27.631 | 25.213 | |||
| TXS1011+142 | 1.55 | QSO | 225 | 165.7 | 27.953 | 27.291 | 0.661 | |
| IRAS F10214+4724 | 2.286 | S2 | 190 | 28.368 | 25.849 | |||
| PG1148+549 | 0.969 | QSO | 196 | 4.3 | 27.327 | 25.286 | 2.041 | - |
| PG1206+459 | 1.158 | QSO | 463 | 27.912 | 25.243 | - | ||
| IRAS F12207+0939 | 0.68 | QSO | 180 | 5.8 | 26.885 | 25.100 | 1.785 | |
| IRAS F12358+1807 | 0.26 | BALQSO | 262 | 5.6 | 26.031 | 24.230 | 1.801 | |
| PG1248+401 | 1.03 | QSO | 224 | 27.457 | 25.139 | - | ||
| IRAS F12509+3122 | 0.78 | QSO | 218 | 27.123 | 24.890 | |||
| IRAS F12514+1027 | 0.3 | S2 | 712 | 8.5 | 26.609 | 24.538 | 2.071 | - |
| PG1254+047 | 1.024 | QSO | 307 | 27.587 | 25.133 | - | ||
| IRAS F13279+3401 | 0.36 | QSO | 1028 | 26.956 | 24.202 | |||
| IRAS P14026+4341 | 0.324 | QSO | 609.8 | 26.621 | 24.108 | - | ||
| H1413+117 | 2.546 | BALQSO | 230 | 7.9 | 28.589 | 26.410 | 2.179 | - |
| IRAS F14218+3845 | 1.21 | QSO | 36.16* | 26.857 | 25.282 | |||
| IRAS F14481+4454 | 0.66 | S2 | 190 | 12.1 | 26.875 | 25.393 | 1.482 | - |
| IRAS F14537+1950 | 0.64 | SB | 283 | 27.013 | 24.714 | - | ||
| IRAS F15307+3252 | 0.93 | S2 | 280 | 8.1 | 27.434 | 25.524 | 1.910 | |
| FFJ1614+3234 | 0.71 | NL | 174 | 26.918 | 24.806 | - | ||
| PG1634+706 | 1.334 | QSO | 318 | 2.4 | 27.919 | 25.318 | 2.601 | - |
| IRAS P18216+6418 | 0.3 | NL | 1128 | 91.9 | 26.809 | 25.572 | 1.237 | - |
| IRAS F23569-0341 | 0.59 | NL | 347 | 27.012 | 24.641 |
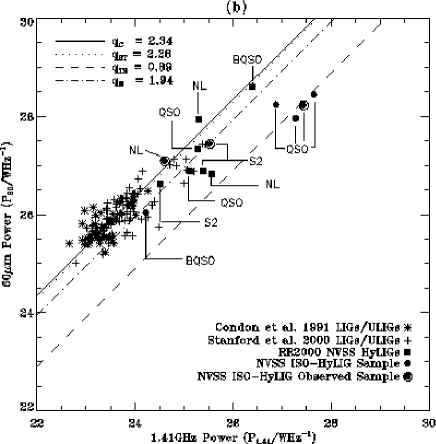
It is clear from Figures 5 and 6 that the radio-IR correlation extends to higher radio and IR power than has been previously claimed. The broad correlation seen in the Condon et al. (1991) and Stanford et al. (2000) data is consistent with that seen for HyLIGs. The majority of the HyLIGs which have NVSS detections have AGN (QSO, BALQSO or Seyfert) optical classifications, the remaining three are narrow line objects. Since the numbers of NVSS detected sources are low, it is difficult to determine accurate relations for individual source types. Nevertheless determinations of the q parameter, which in this paper is calculated from the rest-frame fluxes as
| (7) |
shows that the mean value for the NVSS detected HyLIGs is 1.66. This is
somewhat lower than the typical value determined for starburst galaxies and
radio-quiet quasars of (). However, if the sample is split into the
radio-loud TEXAS HyLIGs and the remainder we find that
(a) the TEXAS HyLIGs have a median q value (0.89) which is consistent with the
ratios found for radio-loud quasars (0-1).
(b) for the remaining HyLIGs with NVSS detections the mean parameter is
which lies very slightly below the typical range for starburst and
radio-quiet quasars of (2-2.6). However, this mean is much lower than the mean
derived for LIGs and ULIGs of and from Condon et al. (1991)
and Stanford et al. (2000) respectively. This
could be explained by the following postulates:
The NVSS-detected HyLIGs all contain AGN which contribute a significant fraction to the galaxy’s total radio power, thus reducing the value of q. In ULIGs the radio power of any obscured AGN (if present) is minimal and hence radio emission from starburst regions is dominant.
HyLIGs have a skewed IMF with a higher proportion of high mass stars (which are prone to become supernovae) than ULIGs and therefore have a higher supernovae rate but maintain the same infrared power. Thus the radio emission (due to SNe rather than AGN) of HyLIGs is higher than that of ULIGs. Hence the value of is lower in comparison.
It is important to note that in Figure 6a using the actual radio fluxes rather than NVSS upper limits will push the points to the left i.e. to higher values of . Considering the NVSS survey limit is 2.7mJy and the 60m k-corrected fluxes together imply that the sources must have values greater than 2 (with the only exception being IRAS F14218+3845). The calculated mean -value is therefore biased by HyLIGs with lower values of .
Therefore the postulates described above apply only to HyLIGs with lower values than is expected for radio-quiet sources (i.e. less than 2.0). There are six such sources (excluding the TEXAS sources). It is possible that these sources are from a class of intermediate radio power AGN (i.e. in concordance with the first postulate). Despite the well known radio bi-modality of the quasar population, such sources have been shown to constitute a similar fraction of the quasar population as the relativistically boosted radio-loud quasars (Falcke, Sherwood & Patnaik, 1996)171717Falcke et al. (1996) attribute the radio-intermediate quasars as being due to relativistic boosting in RQQs. and therefore is not unreasonable to expect such sources to be present within a HyLIG sample.
Four HyLIGs have lower limits of q in excess of the range expected for ULIGs (i.e. ). This fraction is consistent with Condon et al. (1991) who also found that the BGS LIGs and ULIGs had values which were within the expected starburst range or higher. The remnants of Type II and Type Ib SNe accelerate the majority of relativistic electrons in starbursts (Condon, 1992). Over the lifetime of the starburst, the number of relativistic electrons gradually increases with each new SNR [the lifetime of the relativistic electrons () is longer than that of the SNe (months-years) and SNRs (), Condon (1992)]. Considering this, it is plausible that the HyLIGs with the higher -values are the younger starbursts which have had less time to build upon the relativistic electron reservoir. Therefore their radio emission is lower than that of older starbursts, causing the value of to be higher. Further radio follow-up of the high- HyLIGs will be performed to confirm their radio weakness.
7 Conclusions
Infrared Space Observatory measurements of hyperluminous infrared galaxies have been performed to ascertain the nature of these extreme infrared objects.
a) Four objects, with faint IRAS detections, have been confirmed to be real infrared sources.
b) The ISO observed sources constitute some of the most luminous sources in the Universe ().
c) The broad-band spectral energy distributions of these objects have been compared to starburst and Seyfert models. The IR emission of IRAS F00235+1024 and IRAS F14218+3845 are predominantly starburst fuelled whereas predominant AGN fuelling is seen for TXS0052+471 and IRAS F15307+3252.
d) The only radio loud HyLIG of this sample (TXS0052+471) has emission consistent with a dust torus model (EHY95) with an inclination angle of . This object is of most interest since it is part of a subset of faint IRAS F sources which were correlated with the TEXAS Radio Survey to identify possible extreme sources. Prior to the detections by ISO, the reality of TXS0052+471 had not been confirmed.
e) Photometry data of sufficient quality has been obtained for all four HyLIGs to develop more accurate emission models for hyperluminous IR sources.
f) The radio-far infrared luminosity correlation has been verified to continue to previously un-investigated radio and infrared luminosity powers. The mean q value for the radio-quiet sources (1.94) is lower than that previously determined for ULIGs (2.34) and indicates higher radio luminosities for HyLIGs.
g) All the HyLIGs requiring a starburst component to explain the IR SEDs have SFRs in excess of (adopting either a Salpeter or Miller-Scalo IMF).
h) We postulate that most HyLIGs require a combination of starburst and AGN components. The results of this study imply that better sampling of the IR emission of HyLIGs may reveal that an AGN component (not necessarily dominant) is required to explain all the emission from the NIR to the sub-millimetre.
Acknowledgements
This work was in part supported by PPARC grant no. GR/K98728 and EC Network is FMRX-CT96-0068. AV acknowledges the receipt of a PPARC studentship. We would like to thank Sebastian Oliver for his assistance during the preparation of this sample and the anonymous referee for his/her hepful comments. We would also like to thank José Afonso, Seb Oliver, Duncan Farrah and Antonio da Silva for useful discussion. In particular, AV would like to thank Peter Ábrahám and Ulrich Klaas for their time and invaluable advice.
References
- Ábrahám et al. (2001) Ábrahám P., Acosta-Pulido J.A., Klaas U., Bianchi S., Radovich M., Schmidtobreick L., 2001, ‘The calibration legacy of the ISO Mission’, proceedings of a conference held Feb 5-9, 2001. Edited by L. Metcalfe and M.F.K. Kessler. To be published by ESA as ESA Special Publications Series’, Volume 481
- Antonucci (1993) Antonucci R., 1993, ARA&A, 31, 473
- Miley et al. (1989) Armus L., Heckman T.M., Miley G.K., 1989, ApJ, 347, 727
- Aussel et al. (1998) Aussel H., Gerin M., Boulanger F., Desert F.X., Casoli F., Cutri R.M., Signore M., 1998, A&A, 334, L73
- Barvainis et al. (1995) Barvainis R., Antonucci R., Hurt T., Coleman P., Reuter H.-P., 1995, ApJ, 451, L9
- Becker et al. (1995) Becker R.H., White R.L., Helfand D.J., 1995, ApJ, 450, 559
- Bicay et al. (1995) Bicay, M.D., Kojoian, G., Seal, J., Dickinson, D.F., & Malkan, M.A. 1995, ApJS, 98, 369
- Blundell et al. (1998) Blundell K.M., Rawlings S, Eales S.A., Taylor G.B., Bradley A.D., 1998, MNRAS, 295, 265
- Bothun et al. (1989) Bothun G.D., Lonsdale C.J., & Rice W., 1989, ApJ, 341, 129
- Brown & vanden Bout (1991) Brown, R.L., vanden Bout P.A., 1991, AJ, 102, 1956
- Bruzual & Charlot (1993) Bruzual A., Charlot S., 1993, ApJ, 405, 5
- Bruzual & Charlot (1995) Bruzual A., Charlot S., 1995, GISSEL user guide, ftp://gemini.tuc.noao.edu/pub/charlot/bc95
- Calzetti (1997) Calzetti D., 1997, AJ, 113, 162
- Calzetti & Heckman (1999) Calzetti D. & Heckman T.M., 1999, ApJ, 519, 27
- Calzetti et al. (2000) Calzetti D., Armus L., Bohlin R.C., Kinney A.L., Koornneef J., & Storchi-Bergmann T., 2000, ApJ, 533, 682
- Cesarsky et al. (1996) Cesarsky C.J., Abergel A., Agnese P., Altieri B., Augueres J.L., et al., 1996, A&A, 315, L32
- Cesarsky & Blommaert (2000) Cesarsky, D., Blommaert, J., ’ISOCAM Calibration Accuracies Document’, available at http://www.iso.vilspa.esa.es/
- Comastri et al. (1995) Comastri A., Setti G., Zamorani G., & Hasinger G. 1995, A&A, 296, 1
- Condon (1992) Condon J.J., 1992, ARAA, 30, 575
- Condon et al. (1991) Condon J.J. Huang Z., Yin Q.F., & Thuan, T.X., 1991, ApJ, 378, 65
- Condon et al. (1998) Condon J.J., Cotton W.D., Greisen E.W., Yin Q.F., Perley R.A., Taylor G.B., Broderick J.J., 1998, AJ, 115, 1693
- Cram et al. (1992) Cram L.E., North A., & Savage A., 1992, MNRAS, 257, 602
- Cutri et al. (1994) Cutri R.M., Huchra J.P., Low F.J., Brown R.L., vanden Bout P.A., 1994, ApJ, 424, L65
- de Grijp et al. (1985) de Grijp M.H.K., Miley G.K., Lub J., de Jong T., 1985 Nature, 314, 240
- de Jong et al. (1984) de Jong T., Clegg P.E., Rowan-Robinson M., Soifer B.T., Habing H.J., Houck J.R., Aumann H.H., & Raimond E., 1984, ApJL, 278, L67
- Devereux & Young (1990) Devereux N.A. & Young J.S., 1990, ApJ, 359, 42
- Dey & van Breugel (1995) Dey A., van Breugel W., 1995, in Shlosman I., ed., ’Mass-Transfer Induced Activity in Galaxies’. Cambridge Univ. Press, Cambridge, p. 263
- Douglas et al. (1996) Douglas J.N., Bash F.N., Bozyan F.A., Torrence G.W., Wolfe C., 1996, AJ, 111, 1945
- Eales & Arnaud (1988) Eales S.A. & Arnaud, K.A., 1988, ApJ, 324, 193
- Edelson & Malkan (1986) Edelson R.A., Malkan M.A., 1986, ApJ, 308, 59
- Efstathiou et al. (2000) Efstathiou A., Rowan-Robinson M., Siebenmorgen R., 2000, MNRAS, 313,734 (ERS00)
- Efstathiou et al. (1995) Efstathiou A., Hough J.H., & Young S., 1995, MNRAS, 277, 1134 (EHY00)
- Efstathiou & Rowan-Robinson (1990) Efstathiou A. & Rowan-Robinson M., 1990, MNRAS, 245, 275
- Efstathiou & Rowan-Robinson (1995) Efstathiou A., Rowan-Robinson M., 1995, MNRAS, 273, 649
- Evans et al. (1998) Evans A.S., Sanders D.B., Cutri R.M., Radford S.J.E., Solomon P.M., Downes D., Kramer C., 1998, ApJ, 506, 205
- Fabian & Crawford (1995) Fabian A.C., Crawford C.S., 1995, MNRAS, 274, L63
- Fabian et al. (1998) Fabian A.C., Barcons X., Almaini O., & Iwasawa K. 1998, MNRAS, 297, L11
- Fabian et al. (1996) Fabian A.C., Cutri R.M., Smith H.E., Crawford C.S., Brandt W.N., 1996, MNRAS, 283, L95
- Fabian et al. (1994) Fabian A.C., Shioya Y., Iwasawa K., Nandra K., Crawford C., Johnstone R., Kunieda H., McMahon R., Makishima K., Murayama T., Ohashi T., Tanaka Y., Taniguchi Y., Terashima Y., 1994, ApJ, 436, L51
- Falcke et al. (1996) Falcke H., Sherwood W., Patnaik A.R., 1996, ApJ, 471, 106
- Farrah et al. (2002) Farrah, D.G., Verma A., Oliver S.J., Rowan-Robinson M., McMahon R, 2002, MNRAS, 329, 605
- Frayer et al. (1998) Frayer, D.T., Ivison R.J., Scoville N.Z., Yun M., Evans A. S., Smail I,, Blain A.W., Kneib J.-P., 1998, ApJ, 506, L7
- Frayer et al. (1999) Frayer D.T., Ivison R.J., Scoville N.Z., Evans A.S., Yun M.S., Smail I., Barger A.J., Blain A.W., Kneib J.-P., 1999, ApJ, 514, L13
- Genzel et al. (1998) Genzel, R., et al. 1998, ApJ, 498, 579
- Golombek et al. (1988) Golombek D., Miley G.K., & Neugebauer G., 1988, AJ, 95, 26
- Granato & Danese (1994) Granato G.L., Danese L., 1994, MNRAS, 268, 235
- Granato, Danese & Franceschini (1996) Granato G.L., Danese L., Franceschini A., 1996, ApJ, 460, L11
- Green & Rowan-Robinson (1996) Green S.M., Rowan-Robinson M., 1996 MNRAS, 279, 884
- Harwit & Pacini (1975) Harwit M., Pacini F., 1975, ApJL, 200, L127
- Helou (1986) Helou G., 1986, ApJL, 311, L33
- Helou et al. (1985) Helou G., Soifer B.T., & Rowan-Robinson M., 1985, ApJL, 298, L7
- Hildebrand (1983) Hildebrand R.H., 1983, QJRAS, 24, 267
- Hines (1991) Hines D.C., 1991, ApJ, 374, L9
- Hines (1998) Hines D.C., 1998, AAS, 193, 2704
- Hines & Wills (1993) Hines D.C., and Wills B.J., 1993, ApJ, 415, 82
- Hines et al. (1995) Hines D.C., Schmidt G.D., Smith P.S., Cutri R.M. and Low F.J. 1995, ApJ, 450, L1
- Hines et al. (1999) Hines D.C., Schmidt, G.D., Wills, B.J., Smith, P.S., Sowinski, L.G., 1999, ApJ, 512, 145
- Hughes et al. (1998) Hughes D.H. et al., 1998, Nature, 394, 241
- Impey & Gregorini (1993) Impey C., Gregorini L., 1993, AJ, 105, 853
- Ivison et al. (1998) Ivison R.J., Smail I., Le Borgne J.-F., Blain A.W., Kneib J.-P., Bezecourt J., Kerr T.H., Davies J.K., 1998, MNRAS, 298, 583
- Jarvis et al. (2001) Jarvis, M.J. et al., 2001, MNRAS, 326, 1563
- Kelsall et al. (1998) Kelsall, T. et al. 1998, ApJ, 508, 44
- Klaas et al. (2001) Klaas U., Laureijs R.J., Schulz B., Acosta-Pulido J.A., Ábrahám P., & Lemke D., 2001, in the ’The Calibration Legacy of the ISO Mission, proceedings of a conference held Feb 5-9, 2001. Edited by L. Metcalfe and M. F. K. Kessler. To be published by ESA as ESA Special Publications Series’, Volume 481.
- Kiss et al. (2001) Kiss C., Ábrahám P., Klaas U., Juvela M., & Lemke D., 2001, A&A, 379, 1161
- Kleinmann et al. (1988) Kleinmann S.G., Hamilton D., Keel W.C., Wynn-Williams C.G., Eales S.A., Becklin E.E., Kuntz K.D., 1988, ApJ, 328, 161
- Knapp et al. (1990) Knapp G.R., Bies W.E., & van Gorkom, J.H., 1990, AJ, 99, 476
- Lawrence et al. (1994) Lawrence A., Rigopoulou D., Rowan-Robinson M., McMahon R.G., Broadhurst T., Lonsdale C.J., 1994, MNRAS, 266, L41
- Lemke et al. (1996) Lemke D., Klaas U., Abolins J., Ábrahám, P., et al., 1996, A&A, 315, L64
- Liu et al. (1996) Liu, M.C., Graham J.R., Wright G.S., 1996, ApJ, 470, 771
- Lonsdale Persson & Helou (1987) Lonsdale Persson C.J. & Helou G., 1987, ApJ, 314, 513
- Lonsdale et al. (1985) Lonsdale C.J., et al., ’Cataloged galaxies and quasars observed in the IRAS survey’, 1985, Pasadena: Jet Propulsion Laboratory (JPL)
- Low et al. (1984) Low F.J., Young E., Beintema D.A., Gautier T.N., Beichman C.A., Aumann H.H., Gillett F.C., Neugebauer G., Boggess N., Emerson J.P., 1984, ApJ, 278, L19
- Low et al. (1988) Low F.J., Cutri R.M., Huchra J.P., Kleinmann S.G., 1988, ApJ, 327, L41
- Lutz et al. (1999) Lutz D., Veilleux S., Genzel R., 1999, ApJ, 517, L13
- Marx et al. (1994) Marx M., Kruegel E., Klein U. & Wielebinski R., 1994, A&A, 281, 718
- Metcalfe and Kessler (2001) ‘The calibration legacy of the ISO Mission’ Edited by L. Metcalfe and M. F. K. Kessler, ESA Special Publications Series’, Volume 481.
- Miley et al. (1984) Miley G., Neugebauer G., Soifer B.T., Clegg P.E., Harris S., Rowan-Robinson M. & Young E., 1984, ApJL, 278, L79
- Moshir et al. (1992) Moshir M., Kopman G., & Conrow T. et al., 1992, Pasadena: Infrared Processing and Analysis Center, California Institute of Technology, 1992, edited by Moshir M., et al.
- Ogasaka et al. (1997) Ogasaka Y., Inoue H., Brandt W.N., Fabian A.C., Kii T., Nakagawa T., Fujimoto R., Otani C., 1997, PASJ, 49, 179
- Oliver et al. (1996) Oliver, S. J. et al. 1996, MNRAS, 280, 673
- Pettini et al. (1998) Pettini M., Kellogg M., Steidel C.C., Dickinson M., Adelberger K.L., & Giavalisco M., 1998, ApJ, 508, 539
- Rieke (1988) Rieke G.H., 1988, ApJ, 331, L5
- Rowan-Robinson (1992) Rowan-Robinson M., 1992, MNRAS, 258, 787
- Rowan-Robinson (1995) Rowan-Robinson M., 1995, MNRAS, 272, 737
- Rowan-Robinson (2000) Rowan-Robinson M., 2000, MNRAS, 316,885
- Rowan-Robinson & Crawford (1989) Rowan-Robinson M., Crawford J., 1989, MNRAS, 238, 523
- Rowan-Robinson & Efstathiou (1993) Rowan-Robinson M., Efstathiou A., 1993, MNRAS, 263, 675
- Rowan-Robinson et al. (1984) Rowan-Robinson M., Clegg P.E., Beichman C.A., Neugebauer G., Soifer B.T., Aumann H.H., Beintema D.A., Boggess N., Emerson J. P., Gautier T.N., Gillett F.C., Hauser M.G., Houck J.R., Low F.J., Walker R.G., 1984, ApJ, 278, L7
- Rowan-Robinson et al. (1991) Rowan-Robinson M., Broadhurst T., Oliver S.J., Taylor A.N., Lawrence A., McMahon R.G., Lonsdale C.J., Hacking P.B., Conrow T., 1991, Nature, 351, 719
- Rowan-Robinson et al. (1997) Rowan-Robinson M. et al., 1997, MNRAS, 289, 490
- Roy et al. (1998) Roy A.L., Norris R.P., Kesteven M.J., Troup E.R., & Reynolds J.E., 1998, MNRAS, 301, 1019
- Salama (2000) Salama A., 2000, in ’ISO Beyond Point Sources: Studies of Extended Infrared Emission’, Edited by R. J. Laureijs, K. Leech and M. F. Kessler, ESA-SP, 455, 7
- Salama (2001) Salama, A., 2001, in ‘The calibration legacy of the ISO Mission’, Edited by L. Metcalfe and M. F. K. Kessler. To be published by ESA as ESA Special Publications Series’, Volume 481., E6
- Sanders (1999) Sanders D.B., 1999, Astrophysics and Space Science, 266, 331
- Sanders & Mirabel (1996) Sanders D.B., Mirabel I.F., 1996, ARA&A, 34, 749
- Sanders et al. (1989) Sanders D.B., Phinney E.S., Neugebauer G., Soifer B.T., Matthews K., 1989, ApJ, 347, 29
- Sanders et al. (1988a) Sanders D.B., Soifer B.T., Elias J.H., Madore B.F., Matthews K., Neugebauer G., Scoville N.Z., 1988a, ApJ, 325, 74
- Sanders et al. (1988b) Sanders D.B., Soifer B.T., Elias J.H., Neugebauer G., & Matthews K., 1988b, ApJL, 328, L35
- Shier et al. (1996) Shier L.M., Rieke M.J., Rieke G.H., 1996, ApJ, 470, 222
- Siebenmorgen & Krügel (1992) Siebenmorgen R., Krügel E., 1992, A&A, 259, 614
- Smith et al. (1993) Smith, H.E., Lonsdale C.J., & Lonsdale C.J., 1993, American Astronomical Society Meeting, 182, 5305
- Soifer et al. (1987) Soifer B.T., Neugebauer G., & Houck J.R., 1987, ARA&A, 25, 187
- Soifer et al. (1984) Soifer B.T., Rowan-Robinson M., Houck J.R., de Jong T., Neugebauer G., Aumann H.H., Beichman C.A., Boggess N., Clegg P.E., Emerson J.P., Gillett F.C., Habing H.J., Hauser M.G., Low F.J., Miley G., Young E., 1984, ApJ, 278, 71
- Solomon et al. (1992) Solomon P.M., Downes D., Radford S.J.E., 1992, ApJ, 398, L29
- Sopp & Alexander (1991) Sopp H.M. & Alexander P., 1991, MNRAS, 251, 14P
- Stanford et al. (2000) Stanford S.A., Stern D., van Breugel W., & De Breuck C., 2000, ApJS, 131, 185
- Taniguchi et al. (1999) Taniguchi Y., Ikeuchi S., & Shioya Y., 1999, ApJL, 514, L9
- van der Werf et al. (1999) van der Werf P.P., Clements D.L., Shaver P.A., Hawkins M.R.S., 1999, A&A, 342, 665
- Veilleux et al. (1995) Veilleux S., Kim D., Sanders D.B., Mazzarella J.M., & Soifer B.T., 1995, ApJS, 98, 171
- Veilleux et al. (1999) Veilleux S., Kim D.-C., Sanders D.B., 1999, ApJ, 522, 113
- Wilman et al. (1998) Wilman R.J., Fabian A.C., Cutri R.M., Crawford C.S., Brandt W.N., 1998, MNRAS, 300, L7
- Xu (1990) Xu C., 1990, ApJL, 365, L47
- Yun & Scoville (1998) Yun M.S., Scoville N.Z., 1998, ApJ, 507, 774