SCUBA observations of galaxies with metallicity measurements: a new method for determining the relation between submm luminosity and dust mass
Abstract
Using a new technique we have determined a value for the constant of proportionality between submillimetre (submm) emission and dust mass, the dust mass absorption coefficient () at m. Our method has an advantage over previous methods in that we avoid assumptions about the properties of dust in the interstellar medium. Our only assumption is that the fraction of metals incorporated in the dust () in galaxies is a universal constant. To implement our method we require objects that have submillimetre and far-infrared (FIR) flux measurements as well as gas mass and metallicity estimates. We present data for all the galaxies with suitable measurements, including new submm maps for five galaxies. We find .
We have also been able to use our sample to investigate our assumption that is a universal constant. We find no evidence that is different for dwarf and giant galaxies and show that the scatter in from galaxy to galaxy is apparently quite small.
keywords:
dust,extinction-galaxies:dwarf-galaxies:abundances-galaxies:evolution1 Introduction
Measurements of the depletion of heavy elements, relative to the solar abundances, along the line of sight to the stars show that about of the metals in the Galaxy is bound up in dust grains (Whittet 1992). This raises the questions: Is this fraction the same for every galaxy? What are the processes that so efficiently lock metals into dust grains?
Although the presence of dust manifests itself in a multitude of ways - extinction, reddening, the polarisation of starlight, to name but three - the best way, in principle, to estimate the mass of dust in a galaxy is from the submm flux density. The advantages of this are that (a) the emission from dust is optically thin and (b) the emission depends mainly on the mass of dust and is only weakly dependent on the temperature of the dust. The practical obstacle to making the full use of this technique has been the difficulty of estimating the constant of proportionality between the emission and the mass of dust, the mass-extinction or the mass-absorption coefficient. There are two methods that have been used to estimate this constant.
The most commonly used technique to calibrate this constant is by observations of Galactic reflection nebulae (Hildebrand 1983; Casey et al. 1991). By making optical and far-infrared/submillimetre observations, one can estimate /submm in a reasonably straightforward way. If one assumes a value of and a gas-to-dust ratio, one can estimate the mass-absorption coefficient, . For observations at long wavelengths such as with the SCUBA submillimetre camera (Holland et al. 1999), which operates mostly at 850m, there is also the practical problem that this technique has only been applied at relatively short ( 400m) submillimetre wavelengths, which means that the coefficient has to be extrapolated to longer wavelengths. Since the dust emissivity index, , is uncertain by a factor of two, there is an immediate uncertainty of a factor of two in the long-wavelength value of on top of all the other uncertainties. This problem, of course, could be solved by SCUBA observations of reflection nebulae, but there are additional problems with this technique. First, there is evidence that the properties of dust vary with environment (e.g. Cardelli et al. 1996), and so the dust in a reflection nebula may not be representative of a galaxy as a whole. Second, the technique relies on the assumption of spherical symmetry for the reflection nebulae and on the values for properties that are not themselves simple to measure, such as the dust-to-gas ratio and (although there are variations in this technique that do not require these, there are other assumptions that have to be made, such as the typical sizes and densities of dust grains). Hughes et al. (1993) estimate that the factor of uncertainty in at is .
Alton (2000) employed Hildebrand’s (1983) technique using SCUBA observations of an external galaxy to derive , essentially using a galaxy rather than a reflection nebula to calibrate . This method obviously avoids the problems of extrapolation to longer wavelengths and the fact that nebular dust may not be the same as dust in the rest of the interstellar medium but still requires assumptions to be made about the physical properties of the dust.
The other technique that has been used to estimate is more loosely linked to submillimetre observations. In this technique one constructs a model for dust (its chemical composition, distribution of grain sizes etc.) that agrees with all the available data, for example the shape of the optical extinction curve, and then uses the model to estimate the value of the submillimetre mass-absorption coefficient (Draine & Lee 1984; Hughes et al. 1993).
In this paper we suggest an alternative way of estimating the mass-absorption coefficient based on the global properties of galaxies rather than on individual properties within the Galaxy. This technique is based on the assumption that the fraction of metals within the interstellar medium of a galaxy that is bound up in dust is a constant. There is some evidence for this from the correlation between dust-to-gas ratio and metallicity in nearby galaxies (Issa, MacLaren & Wolfendale 1990). The high depletion of many elements within our own ISM (Whittet 1992) also suggests that the mechanism forming dust is efficient - that is, if there are metals present, they are efficiently incorporated into dust grains. Finally, there is evidence in the Galaxy that although the dust extinction curve is quite variable from place to place, the gas phase carbon and oxygen abundances are remarkably constant over a wide range of ISM density (Cardelli et al. 1996; Meyer et al. 1998), implying (as these elements are the most important constituents of dust) that the fraction of metals in dust is a constant. In contrast to this evidence, Lisenfeld & Ferrara (1998) found a non-linear relationship between metallicity and dust-to-gas ratio for 28 dwarf irregular galaxies, which suggests that , the fraction of metals locked up in dust, is not the same for all types of galaxy. In this paper, we will present new data that shows that Lisenfeld & Ferrara’s technique missed cool dust, and when this is taken into account does appear to be remarkably constant from galaxy to galaxy.
To apply the technique we need a galaxy which has submillimetre and far-infrared flux measurements, a measure of its total gass mass, and a measure of its metallicity.
The dust mass of the galaxy is then given by two equations:
| (1) |
where is the mass of gas in the galaxy, is the metallicity relative to solar, is the ratio of the mass of metals in the dust to the total mass of metals and is the ratio of the mass of metals to the mass of gas for gas with solar metallicity, we estimate , and;
| (2) |
in which is the flux density at 850m, is the distance of the galaxy, is the value of the Planck function at 850m, T is the dust temperature and is the mass-absorption coefficient at 850m. We then set these two equations equal to one another, and as long as we know , we can estimate .
The arrangement of this paper is as follows. In section 2 we present the results of a search through the archive of the James Clerk Maxwell Telescope for submm data for galaxies with known metal abundances. In section 3 we derive a value for based on observations of the local interstellar medium. In section 4 we apply the technique to estimate and investigate whether is a universal constant. We assume throughout that .
2 Data reduction & Results
We looked through the JCMT111The JCMT is operated by the Joint Astronomy Centre on behalf of the UK Particle Physics and Astronomy Research Council, the Netherlands Organization for scientific Research and the Canadian National Research Council archive for all the objects for which there are both abundance measurements and observations with the SCUBA camera (Holland 1999). Table 1 is a list of galaxies in the archive for which there are published metallicity measurements but no published submm results.
The data for these five objects was reduced in the usual way using the SURF (Jenness & Lightfoot 1998) software package. Images were first flat-fielded to remove inhomogeneity in bolometer sensitivity. Corrections were then made for atmospheric absorption using the opacities () derived from skydip measurements. Noisy bolometers were masked and large spikes in the bolometer time-stream removed by applying a 4- clip. Residual sky noise was removed with the SURF task REMSKY. Following removal of the sky noise, the bolometer time-stream was clipped again at the 3- level.
All the datasets in the archive which were taken with the same chop throw were then made into a map using the SURF program REBIN. The maps were calibrated using jiggle maps of both primary and secondary calibrators reduced in the same way. Figure 1 shows contour plots of the maps of these objects overlaid on images from the Digitised Sky Survey (DSS). The lowest level contour is and increasing in steps to . Although it appears that the submm emission is concentrated in the centre of NGC5253, the dynamical range of the optical data is much greater than the submm data, thereby making it difficult to draw any firm conclusions as to whether the optical emission is indeed more extended than the dust emission.
The flux was measured by using the DSS image as a guide to chose an aperture which contained as much of the galaxy and as little of the sky as possible. The flux errors were estimated using the procedure in Dunne et al. (2000). The fluxes and the apertures used are given in Table 1.
Since the first draft of this paper another submm map of NGC1569 has been published (Lisenfeld et al. 2001). The new data was taken in much better conditions than the data we retrieved from the SCUBA archive and the flux measured is significantly higher than ours. We repeated our reduction of this object but the flux determined remained lower than the flux measured by Lisenfeld et al. (2001). The discrepancy may arise from the galaxy being larger than the SCUBA array, for which Lisenfeld et al (2001) have tried to correct.
Table 1. SCUBA archive data and flux measurements (1) (2) (3) (4) (5) (6) (7) (8) (9) (10) Name D date Run no. int. time Ap size (Mpc) (sec) () (mJy) (Jy) (Jy) UM448 72 13 nov 1998 4 1280 0.4 34 40 9 4.1 4.3 13 nov 1998 16 1280 0.4 NGC5253 3.2 13 jan 1999 77 1280 0.4 41 19223 30.5 29.4 13 jan 1999 114 1280 0.4 Mrk33 24.9 13 apr 1998 15 1280 0.1 36 428 4.7 5.3 13 apr 1998 16 1280 0.1 NGC4670 11.0 28 dec 1998 62 1920 0.5 38.6 497 2.6 4.5 21 jan 1999 94 1920 0.4 21 jan 1999 95 1920 0.4 NGC1569 1.6 10 sep 1997 81 1280 0.4 74 269 45.4 47.3 10 sep 1997 82 1280 0.4
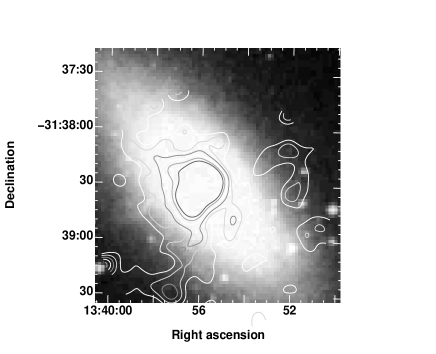
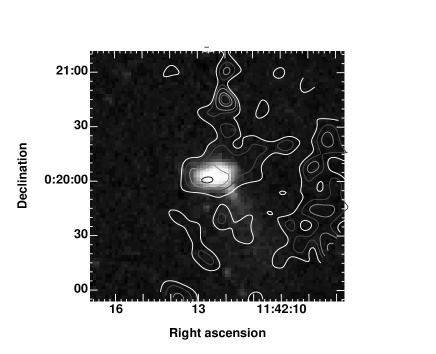
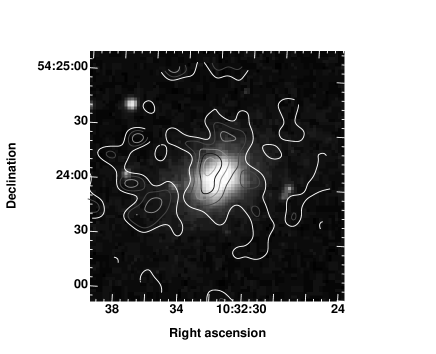
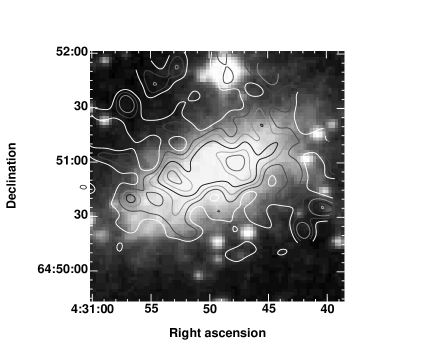
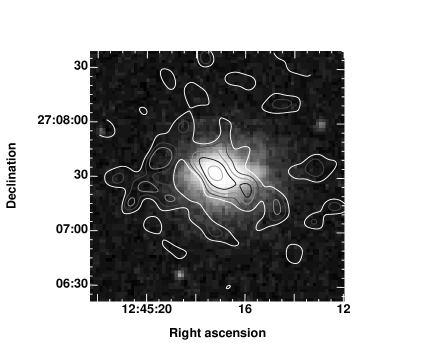


TABLE 2. Submm results (1) (2) (3) (4) (5) (6) Name D log (Mpc) (mJy) (K) () UM448 72 40 9 45 32.9 7.41 NGC5253 3.2 19223 45 24.4 5.39 Mrk33 24.9 428 42 22.4 6.51 NGC1569 1.6 269 40 8.3 4.91 NGC4670 11.0 497 38 25.6 5.87 NGC2903 6.3 34 30.7 7.02 NGC4303 15.2 41 82.6 7.54 NGC6946 5.5 NGC7331 14.3 34 44.2 7.69 NGC1222 32 38 7.02 NGC7469 64 38 8.13 NGC7714 37 60 7.05 NGC3994 41 33 7.34 NGC3995 43 56 7.47 NGC5929 33 6.51 NGC5953 26 7.20 NGC5954 26 7.03 NGC6052 62 37 7.65 MCG+02-04-025 122 43 7.83 IR0335+15 138 41 8.01 NGC5256 109 36 8.07 NGC7674 113 46 8.25
TABLE 3. Dust and gas masses using metallicity dependent X-factors (1) (2) (3) (4) (5) (6) (7) (8) Name 12 + log (O/H) Ref. log () log log log log () () () () () UM448 8.08 1 9.40 10.14 10.92 7.36 8.08 NGC5253 8.34 1,2 8.29 6.78 7.07 5.71 5.73 Mrk33 8.40 1 8.47 8.64 8.94 6.33 6.54 NGC1569 8.16 1,3 7.75 6.31 6.92 4.99 5.04 NGC4670 8.30 1 8.22 7.66 8.10 5.69 5.83 NGC2903 9.12 4 8.98 8.81 8.03 7.39 7.21 NGC4303 9.01 4 9.42 9.61 8.99 7.90 7.64 NGC6946 9.06 4 9.49 9.41 8.72 7.88 7.69 NGC7331 9.03 4 9.66 9.79 9.14 8.13 7.87 NGC1222 8.57 5 9.08 6.41 6.72 NGC7469 8.80 6 9.18 10.10 9.80 7.99 7.76 NGC7714 8.53 7 8.93 9.65 9.75 7.32 7.41 NGC3994 8.61 8 9.45 7.13 7.13 NGC3995 8.66 8 9.79 7.52 7.52 NGC5929 8.18 8 8.63 8.83 9.46 6.29 6.77 NGC5953 8.73 8 8.76 9.48 9.29 7.62 7.20 NGC5954 9.16 8 8.63 8.61 7.77 7.15 7.18 NGC6052 8.65 8 9.58 9.58 9.71 7.60 7.67 MCG+02-04-025 8.87 8 9.24 7.18 7.18 IR0335+15 9.00 8 10.29 9.69 8.36 7.76 NGC5256 8.75 8 10.46 10.24 8.28 8.06 NGC7674 8.56 8 10.03 10.67 10.73 8.39 8.44


3 Calibrating
The fraction of metals incorporated in dust in the interstellar medium can be estimated from spectroscopic observations of nearby stars, which show that a significant fraction of the metals that one would expect, from cosmic abundances, to be in the ISM are not there - they have been bound up in dust. If is the number of atoms of a given chemical element relative to the number of hydrogen atoms, is the atomic weight of the element, and is the proportion of that element bound up in dust, then
| (3) |
Recent observations of nearby stars with the Hubble Space Telescope have made it possible to calculate more accurately because they have provided accurate depletion measurements for two of the most important elements, oxygen and carbon, strong evidence that the depletion is the same along different sight lines, and evidence that the cosmic metal abundance is about two thirds the solar metal abundance (Cardelli et al. 1996; Meyer et al. 1998). To calculate , we have assumed the solar metal abundance given in Pagel (1997) and then multiplied this by two thirds to obtain the cosmic metal abundances. It should be noted that the recent re-determination of the solar oxygen abundance by Allende Prieto et al. (2001), suggests that the solar metallicity is considerably closer to the ISM value than has been conventionally assumed. We have assumed the depletions given by Whittet (1992), except that we have preferred the recent measurements for carbon and oxygen obtained from the Hubble Space Telescope observations (Cardelli et al. 1996; Meyer et al. 1998). We obtain a value for of 0.456.
4 Applying the method
Table 2 lists the submm results for all the galaxies that we are aware of which have metallicity measurements and submillimetre measurements. Many of the objects in the table are taken from the SCUBA Local Universe Galaxy Survey (SLUGS) of Dunne et al. (2000). Distances for objects with radial velocities were taken from the Nearby Galaxies Catalogue (Tully 1988). Table 3 gives the metallicity measurements for the sample and also measurements of the masses of the atomic and molecular gas. Metallicities for some SLUGS objects were estimated using strong line ratios and the calibration method of Edmunds & Pagel (1984), relating and and oxygen abundances in HII regions. Line ratios were taken fron Keel et al. (1985) and Veilleux et al. (1995). Although more recent work has shown that the Edmunds & Pagel calibrator may over-estimate metallicities above solar, it is probably a reasonable estimator in the abundance range of these galaxies.
There are two complications to applying the simple method we have outlined in the introduction: (a) the requirement of equation (2) for a temperature model; (b) the fact that estimates of gas mass depend to some extent on assumptions about metallicity. We will now discuss these in turn.
4.1 Dust Masses
Dunne Eales (2001), in their investigation of the FIR/submm spectral energy distributions (SEDs) of galaxies in the SCUBA Local Universe Galaxy Survey (SLUGS), found that the 450/850m flux ratio is remarkably constant for galaxies with a wide range of luminosities. They conclude that the dust emissivity index must be 2. They then showed that with this emissivity index, there must be at least two dust components with different temperatures in galaxies, even in ultraluminous IRAS galaxies like Arp220.
We fitted the Dunne & Eales two-component model to the five objects for which we have new SCUBA data. Since we only have three fluxes for each galaxy (60, 100 and m), we fixed the temperature of the cold component to be 20K, the average of the values found by Dunne & Eales (2001). Figure 2 shows the fits for the five galaxies and Table 2 gives the temperature of the warm component and the ratio of the cold-to-hot dust (). We have also given the results of the two component fits for the SLUGS galaxies by Dunne & Eales (2001) and values for a few other galaxies for which we either made two-component fits or for which we took two-component fits from the literature. From the results of these fits we have estimated dust masses using equation (4):
| (4) |
in which is the flux density at 850m, is the value of the Planck function at 850m, is the mass-absorption coefficient at 850m and D is the distance found for . We have initially adopted the value for m) of used by Dunne et al. (2000), although of course one of the goals of the present paper is to measure a new value for this. These initial estimates of the dust masses are given in Table 2.
4.2 Gas Masses
The mass of HI can be unambiguosly calculated from the intensity of the 21-cm line. Following Lisenfeld & Ferrara (1998), we have calculated the dust mass within the optical disk, since the metallicity (and thus the dust content) outside the optical disk is likely to be low.
Cold is detected indirectly by means of a tracer such as CO. The conversion factor is however highly variable depending on temperature, density and metallicity. It is usual to determine the mass in a galaxy by applying a ’standard’ conversion factor, , where I(CO) is the velocity-integrated CO intensity and is the molecular hydrogen column density. A complication here is that the conversion factor almost certainly depends on metallicity. We investigated the dependence of our method on this uncertainty by trying a number of suggested relationships between X and metallicity.
Molecular hydrogen () masses for the five objects from the SCUBA archive were calculated from the CO fluxes taken from the literature using
| (5) |
(see Tinney et al. 1990) where is in . values were taken from Sage, Salzer, Loose and Henkel (1992) and from Taylor, Kobulnicky and Skillman (1998). was calculated from the relation where is the radius of the telescope beam on the galaxy in . Gas masses for the SLUGS sample were taken from Dunne et al. (2000). For those objects whose m fluxes were obtained from Amure (priv. comm.) and Bianchi et al. (1998, 2000) we took values from Young et al. (1995).
We investigated the dependence of the method on the metallicity-dependence of the X-factor by trying two different suggested relationships for the dependence of X on metallicity. Arimoto, Sofue and Tsujimoto (1996) propose that X has a strong dependence on metallicity.
| (6) |
where .
Israel (2000) notes the probable dependence on ultra-violet ratiation field, but also suggests a simplified approximate metallicity dependence for X,
| (7) |
We have used both of these relations to determine masses for our sample. These are listed in Table 3. As an additional test of the sensitivity of the method to the X-factor we have also used a “standard” conversion factor, , from Bloemen et al. (1986) derived from observations of the Galaxy. Table 3 also gives the dust masses calculated using equation 1.
5 Interpretation & Discussion
In figure 3 we have plotted the dust masses calculated by the two different methods against each other. We first performed a simple least-squares fit on the data points. All of the least squares solutions were consistent with a slope of unity. This suggests that the properties of dust, in particular and , are similar for dwarf galaxies and large galaxies like our own. On the assumption that this is true, the value of can be determined in the following way. If the value of we have initially assumed for plotting Fig. 3 is correct, the points should lie on a line of slope unity passing through the origin. By measuring the actual offset of the points from the line, we can calculate a new value of . We obtain values of 0.07 0.02, 0.070.01 and 0.070.01 using Arimoto, Israel and Galactic X-factors respectively.
The method clearly does not depend critically on the metallicity-dependence of the CO-to- X-factor, presumably because either the overall contribution of to the gas-mass is in all cases relatively small, or, where the molecular content is high, the X-factors do not vary greatly at these metallicities. The main uncertainty in the method is the basic assumption that the fraction of metals in dust () is a universal constant. If this is not correct, our estimate of this constant, from observations of the interstellar medium in our own galaxy will not be applicable to other galaxies. However, Figure 3 is itself evidence that this is not too bad an assumption. The scatter around the best fit lines is only a factor of 2 in the ordinate. This scatter includes all observational errors, as well as galaxy-to-galaxy variations in and . On the extreme assumption that all the scatter is caused by variation in , we estimate that the galaxy-to-galaxy variation in can only be a factor of . If this extreme assumption is correct, then our estimate of , would have an error of a factor of for an individual galaxy.
Our conclusion that the fraction of metals incorporated in dust is the same for giant and dwarf galaxies is in contradiction with the conclusions of Lisenfeld & Ferrara (1998), who found that metals are less effectively incorporated in dust in dwarfs than in giant galaxies. Figure 4 shows metallicity plotted against dust-to-gas mass ratio for our sample and that of Lisenfeld & Ferrara. The Lisenfeld & Ferrara points suggest a non-linear relationship between dust-to-gas ratio and metallicity. However we have re-observed some of the objects from their sample with SCUBA and find that their dust-to-gas mass ratios are increased when estimated from submm rather than far-infrared flux. This is expected since in their study, Lisenfeld et al. (1998) used the IRAS m flux ratio to determine a dust temperature and hence may have underestimated the dust mass by missing cold dust at longer wavelengths. The re-observed points are consistent with a slope of unity. Very recently Lisenfeld et al. (2001) have suggested that a low dust mass is appropriate for NGC1569, whether such a model is applicable to all dwarf galaxies, or is unique to NGC1569 is not yet clear. We have also plotted two of the galaxy dust evolution models of Edmunds (2001) in figure 4. The solid line shows a model in which supernovae play an important role in dust production and the dashed line a model in which dust is produced in some kinds of evolved low and intermediate mass stars. Our current dataset is unable to make a distinction between these two models but further submm observations at low metallicities should help demonstrate whether or not condensation of dust grain cores in supernova ejecta is an important dust source. Such observations will be quite challenging as the number of objects suitable for observation at m which have very low metallicities is small.
In Figure 5 we have reproduced a plot from Alton (2001) that shows estimates of the dust mass absorption coefficient in the IR-Submm from a variety of sources. Sopka et al. (1985) made observations of the thermal emission from the dust envelopes of evolved stars. Rengarajan (1984) reports results from observations of centrally heated infrared sources deeply imbedded in molecular clouds. Boulanger et al. (1996) studied the dust-to-gas correlation at high Galactic latitude using COBE data. The Draine & Lee (1984) points come from a model for diffuse Galactic dust. Both the Hildebrand (1983) and Casey (1991) points are from Galactic reflection nebulae. The Alton (2000) measurement is from SCUBA observations of the spiral galaxy NGC891 while Bianchi et al. (1999) used COBE & IRAS data. Finally, Agladze et al. (1994) performed laboratory experiments on forsterite . The line shows . Our data (open triangle) is consistent with the COBE data of Boulanger et al. (1996) as well as that of Draine & Lee (1984), Hildebrand (1983) and Bianchi et al. (1999).

6 Conclusions
We have presented a new method for determining the m dust mass absorption coefficient, and obtain a value of 0.070.02 .
Our method for determining this coefficient avoids the problems encountered by previous investigators (Hildebrand 1983, Bianchi 1999, Alton 2000). Using SCUBA observations at m we can probe the dust emission directly. We do not make any assumptions about the properties of the dust nor do we rely on similarity between dust in Galactic reflection nebulae and that in the general ISM. Our only assumption (admittedly an important one) is that the fraction of metals incorporated in dust is a universal constant. This seems a justified assumption however since the small scatter in Fig. 3 suggests that the fraction of metals in dust is the same for a wide range, from dwarf to high mass galaxies.
Having used both metallicity-dependent (Israel 2000; Arimoto et al. 1996) and independent (Bloemen et al. 1986) conversion factors to derive a molecular gas mass we have concluded that the metallicity-dependence of the X-factor is not an important consideration in this derivation of .
The COBE data of Boulanger et al. (1996) are consistent with our value for as are the data of Draine & Lee, Bianchi and Hildebrand. The value of Alton (2000) that was derived from SCUBA observations of the edge on galaxy NGC891 is times higher than ours. They do however admit that uncertainty in their technique means that their quoted value for the dust emissivity could be in error by a factor of 2 either way. Agladaze et al. (1994) laboratory experiments yield a that is times higher than ours, however they use for wavelength extrapolations. Sopka et al. 1985 also use .
Unfortunately, the metallicity range of our sample does not extend low enough to make a distinction between the dust formation models proposed by Edmunds (2001). We intend to acquire m data for the rest of the Lisenfeld & Ferrara (1998) sample where possible.
Acknowledgments
Guest User, Canadian Astronomy Data Centre, which is operated by the Dominion Astrophysical Observatory for the National Research Council of Canada’s Herzberg Institute of Astrophysics.
This research has made use of the NASA/IPAC Extragalactic Database (NED) which is operated by the Jet Propulsion Laboratory, California Institute of Technology, under contract with the National Aeronautics and Space Administration.
Stephen Eales thanks the Leverhulme Trust for the award of a research fellowship.
We thank the referee for helpful comments.
References
- [1] Agladze N., Sievers A., Jones S., Burlitch J. & Beckwith S. 1994, Nature, 372, 243
- [2] Allende Prieto C., Lambert D.L. and Asplund M. 2001, ApJ, 556, 63
- [3] Alton P.B., Lequeux J., Bianchi S., Churches D., Davies D. and Combes F. 2001, A&A, 366, 451
- [4] Alton P.B., Xilouris E.M., Bianchi S., Davies J., Kylafis N. 2000, A&A, 356, 795
- [5] Arimoto N.,Sofue Y. and Tsujimoto T. 1996, Publ. Astron. Soc. Japan, 48, 275
- [6] Bianchi S., Alton P.B., Davies J.I. and Trewhella M. 1998, MNRAS, 298, L49
- [7] Bianchi S., Davies J.I., Alton P.B. 1999, A&A, 344, L1
- [8] Bianchi S., Davies J.I., Alton P.B., Gerin M., 2000
- [9] Bolemen J.B.G.M. et al. 1986, A&A, 154, 25
- [10] Bonatto C.J. & Pastoriza M.G. 1990, ApJ, 353, 445
- [11] Boulanger F., Abergel A., Bernard J.P., et al. 1996, A&A, 312, 256
- [12] Cardelli J.A., Meyer D.M., Jura M. & Savage B.D. 1996, Ap, 467, 334
- [13] Casey S.C. 1991, ApJ, 371, 183
- [14] Davies J.I., Alton P., Trewhella M., Evans R., Bianchi S. 1999, MNRAS, 304, 495
- [15] Draine B.T. & Lee H.M. 1984, ApJ, 285, 89
- [16] Dunne L. & Eales S.A. 2001, MNRAS, 327, 697
- [17] Dunne L., Eales S. Edmunds M., Ivison R., Alexander P., Clements D.L. 2000, MNRAS, 315, 115
- [18] Edmunds M.G. 2001, MNRAS, 328, 223
- [19] Edmunds M.G. & Pagel B.E.J 1984, MNRAS, 211, 507
- [20] Gonzalez D., & Rosa M. 1995, PASP, 107, 1130
- [21] Hildebrand R.H. 1983, QJRAS, 24, 267
- [22] Holland W.S. et al. 1999, MNRAS, 303, 659
- [23] Hughes D., Robson E., Dunlop J., Gear W., 1993, MNRAS, 263, 607
- [24] Israel F.P. 2000, astro-ph/0001250
- [25] Issa M.R., McLaren I. and Wolfendale A.W. 1990, A&A, 236, 237
- [26] Jenness T. & Lightfoot J.F. 1998, Astronomical Data Analysis Software and Systems VII, conf. ser. 145, 216, R. Albrecht, R.N. Hook, H.A. Bushouse eds.
- [27] Keel W.C., Kennicutt R.C.Jr, Hummel E., van der Hulst J.M. 1995, AJ, 90, 708
- [28] Kenney J.D.P., & Young J.S. 1989, ApJ, 344, 171
- [29] Lisenfeld U. & Ferrara A. 1998, ApJ, 496, 145
- [30] Lisenfeld U., Israel F.P., Stil J.M. and Sievers A. 2001, astro-ph/0112212
- [31] Meyer D.M., Jura M., and Cardelli J.A. 1998, ApJ, 493, 222
- [32] Pagel B.E.J, Simonson E.A., Terlevich R.J., Edmunds M.G. 1992, MNRAS, 255, 325
- [33] Pagel B.E.J 1997, Nucleosynthesis and chemical evolution of galaxies, Cambridge University Press
- [34] Petrosian A.R. & Burenkov A.N. 1993, A&A, 279, 21
- [35] Rengarajan T. 1984, A&A, 140, 213
- [36] Sage L.J., Salzer J.J., Loose H.-H, Henkel C. 1992, A&A, 265, 19
- [37] Skillman E.D., Kennicutt R.C., and Hodge P.W. 1989, ApJ, 347, 875
- [38] Sopka R., Hildebrand R., Jaffe D. et al. 1985, ApJ, 294, 242
- [39] Taylor C.L., Kobulnicky H.A., Skillman E.D. 1998, ApJ, 116, 2746
- [40] Tinney C.G., Scoville N.Z., Sanders D.B., Soifier B.T. 1990, ApJ, 362, 473
- [41] Tully 1988, Nearby galaxies catalog, Cambridge University Press
- [42] Veilleux S., Kim D.-C., Sanders D.B., Mazarella J.M., Soifer B.T. 1995, ApJS, 98, 171
- [43] Whittet D 1992, Dust in the Galactic Environment (IOP Publishing)
- [44] Young J.S. et al. 1995, ApJS, 98, 219
- [45] Zaritsky D., Kennicutt R.C., Huchra J.P. 1994, ApJ, 420, 87