Chandra observation of Abell 1689: New determination of mass distribution and comparison to lensing measurements
Abstract
We present a new estimate of the projected X-ray mass of Abell 1689 observed with Chandra, in an attempt to clarify the issue of whether or not there exists a discrepancy between X-ray and gravitational lensing mass estimates claimed in previous investigations based on Einstein, ROSAT and ASCA observations. A particular attention is paid to examining if there is an offset between X-ray centroid and central dominant cD galaxy, which may be an indicator of the presence of local dynamical activities of intracluster gas in the central core and therefore, explain the discrepancy between X-ray and lensing mass estimates, if any. The unprecedentedly high spatial resolution achieved by Chandra allows us to precisely localize the X-ray centroid of Abell 1689, which appears to coincide perfectly with the central cD galaxy. This fact, along with the symmetry and regularity of the X-ray surface brightness and temperature distributions, suggests that Abell 1689 is a fully-relaxed cluster. We thus employ hydrostatic equilibrium hypothesis to determine the projected mass profile of Abell 1689, and compare it with the results obtained by different lensing techniques available in the literature. Our analysis confirms the existance of the discrepancy of a factor of between X-ray and lensing mass estimates in the central region of Mpc, although the two methods yield essentially consistent result on large radii. If the perfect coincidence between the X-ray center and the cD galaxy of Abell 1689 detected by Chandra observation is not a projection effect, the central mass discrepancy between X-ray and lensing measurements may pose a challenge to our conventional understanding of dynamical evolution of the intracluster gas in the central regions of clusters.
1 Introduction
Clusters of galaxies serve as an ideal cosmological laboratory for test of theories of formation and evolution of structures, and for determinations of fundamental cosmological parameters such as the matter density parameter , the baryon fraction , the normalization parameters and the shape parameter . All these cosmological applications depend critically on how accurately the mass distributions of clusters can be measured. Current techniques include the optical measurements of distribution and velocity dispersion of cluster galaxies combined with the Jeans equation, the X-ray observations of intracluster gas (density and temperature profiles) coupled with the hydrostatic equilibrium hypothesis, and the gravitational lensing effects of distant galaxies behind clusters. Other methods such as the measurements of hot intracluster gas through the Sunyaev-Zeldovich effect and the numerical simulations of formation and evolution of clusters also act as a complementary manner to the above direct approaches. A comparison of different mass estimates provides a simple way to examine the reliability and accuracy of different methods, which also allows one to diagnose dynamical evolution of different matter components (galaxies, gas and dark matter) of clusters. In such an exercise, the mass distribution revealed by gravitational lensing, which is independent of the matter content and dynamical state of clusters, may be used as a reference point for judging other approaches. Previous studies have essentially arrived at the following conclusions: There is good agreement between the weak gravitational lensing, X-ray and optical determined cluster masses on large scales characterized by X-ray core radii, while in the central regions of some lensing clusters the X-ray method is likely to systematically underestimate cluster masses by a factor of (Wu 1994; Miralda-Escudé & Babul 1995; Wu & Fang 1997; Allen 1998; Wu et al. 1998; Wu 2000 and references therein). Because this discrepancy occurs in the very central cores of clusters, it may arise from our oversimplification of dynamical properties of the intracluster gas on small scales. Indeed, the discrepancy becomes significant only for non-cooling flow clusters (Allen 1998; Wu 2000), in which the apparent offsets between X-ray and lensing centers have been detected (Allen 1998; Katayama, Hayashida & Hashimotodani 2002). Therefore, detailed knowledge of the gas distribution in the inner regions of clusters will be crucial for clarifying the issue.
The unprecedentedly high spatial resolution of the Chandra X-ray Observatory has permitted detailed studies of intracluster gas in the innermost regions of clusters. So far, central X-ray masses have been explicitly derived for several lensing clusters observed with Chandra. For at least three clusters (Abell 1835, MS 1358 and Abell 2390), the newly determined X-ray masses are found to be in good agreement with the gravitational lensing measurements (Allen, Ettori & Fabian 2001; Schmidt, Allen & Fabian 2001; Arabadjis, Bautz & Garmire 2001), while a significant discrepancy between the X-ray and strong lensing mass estimates is also detected in Abell 2218 (Machacek et al. 2001). For the latter, the X-ray centroid shows an offset of from the dominant cD galaxy. This reinforces the argument that the mass discrepancy may be attributed to the inappropriate use of hydrostatic equilibrium to the intracluster gas in the central regions where substructures and their bulk motion may govern the dynamical process of intracluster gas even if clusters become fully relaxed. Indeed, the existence of subsonic motion of central gas has been conformed recently by Chandra observation in cluster RXJ1720 which has a redshift (0.164) similar to those of lensing clusters (Mazzotta et al. 2001). Such motion may explain the offsets between X-ray and lensing centers. In a word, it seems that the consistency or discrepancy between the two mass estimates can be simply related to the question of whether or not the X-ray centers show a displacement from the central cD galaxies in lensing clusters.
In this paper, we present a Chandra observation of the lensing cluster Abell 1689 at redshift , in an attempt to reexamine the consistency/discrepancy between X-ray and lensing mass estimates and the possible offset between X-ray and optical centers. The mass distribution of Abell 1689 has been reconstructed by several independent techniques of gravitational lensing: arcs and arclets (Tyson & Fischer 1995), the number count dilution of lensed red galaxies (Taylor et al. 1998), the distortion of background galaxy luminosity function (Dye et al. 2001) and the weak lensing of background galaxies (Clowe & Schneider 2001). This cluster was observed with EINSTEIN, ROSAT, GINGA, and ASCA. The X-ray luminosity in the 0.1 - 2.4 band is erg s-1 (Ebeling et al. 1996) and the X-ray temperature is keV (Mushotzky & Scharf 1997). The X-ray determined mass within the giant arc position (), under the assumption of hydrostatic equilibrium, is found to be lower by a factor of than that derived from strong gravitational lensing (Miralda-Escudé & Babul 1995; Wu & Fang 1997; Allen 1998; Wu 2000). In particular, based on the ROSAT HRI observation, Allen (1998) attributed this discrepancy to the offset of between the lensing and X-ray centers. The offset value is within position uncertainty considering that ROSAT HRI provides a arcsec (full width at half-maximum) imaging resolution. With the new Chandra observation of Abell 1689, which is one magnitude improved in spatial resolution with respect to ROSAT HRI, we are now able to reexamine the reported mass discrepancy and its origin. Throughout this paper , we assume km s-1 Mpc-1 and .
2 Chandra observation and analysis
2.1 Data preparation
Abell 1689 was observed twice for separate 10 ksec by the Chandra X-ray Observatory on April 15, 2000 and January 7, 2001, respectively. Both observations were performed by using mainly the on board Advanced CCD Imaging Spectrometer in 22 imaging array (ACIS-I) mode. In the present work, the dataset is retrieved from the Chandra archive for the first 10 ksec observation. The second observation, unfortunately, suffered from some serious aspect problem and the dataset has not yet been made available for public.
In order to achieve a better modeling of instrument gain and quantum efficiency, we process the Level 1 CXC data products using Chandra Interactive Analysis of Observations package CIAO-2.2, with complement of the updated calibration database CALDB-2.9. Following the standard methods (Chandra Science Threads for CIAO-2.2111available at http://asc.harvard.edu/ciao/documents_threads.html.), we remove the Pixel and PHA Randomization effects, and “streak” events from the original event file.
Periods of background flaring are removed using the CIAO task lc_clean for ACIS chips I0-3 one by one. This finally yields an effective exposure time of s after all known corrections for Abell 1689 are taken into account.
While the telescope pointing placed bulk of the cluster emission on the ACIS chip I3, a certain cluster emission also extends over other three adjacent chips. This may cause some problems in finding source-free background regions for the spatial and spectral analysis. Thus, a suitable blank-sky background dataset, acisi_C_i0123_bg_evt_230301.fits, compiled by Markevitch (2001) has been chosen and tailored for the present observation. We apply the same cleaning algorithm to the data as was applied to the background set. Identical spatial and energy filters are applied to source and background data so that the background normalization is set by the ratio of their exposure times. Moreover, we have created a spectral weighted exposure map (see section 2.2) for the entire ACIS chip array, using the aspect histogram files which contain information about aspect motion during the observation for each chip, and instrument maps which are essentially the product of detector quantum efficiency and mirror effective area projected onto the detector surface.
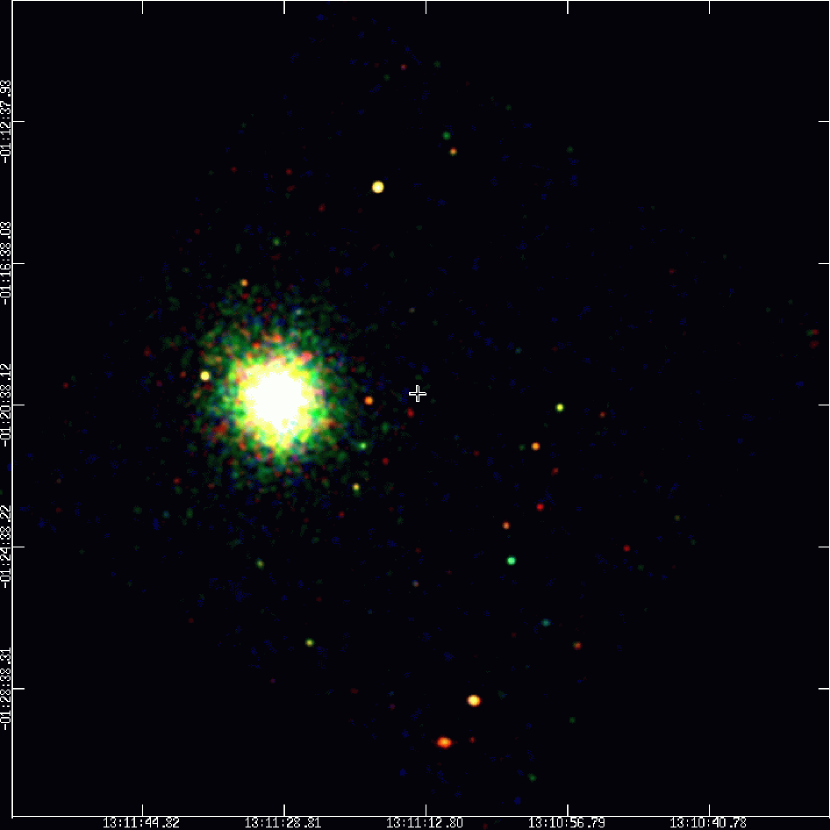
Figure 1 displays a true color image of Abell 1689, produced by a mosaic of three X-ray bands, red: 0.3–1.5 keV, green: 1.5–3 keV and blue: 3–10 keV. Images in each of the three bands, after being normalized by the exposure map, have been binned by four (such that an image pixel subtends 1.96 arcsec2 on the sky) and adaptively smoothed using CIAO task csmooth at 3 significant levels with a maximum smoothing scale of 5 pixels. It appears that with Chandra’s high spatial resolution a large number of X-ray point sources have been resolved within the field around the galaxy cluster, .
In order to check the Chandra astrometry, we use the CIAO tool wavdetect, with a significance parameter value of , to search for sources in the broad band image (0.3-10 keV) of the cluster field. A total of 29 sources are detected (see Figure 1). The source list is then compared with the optical USNO-A2.0 catalog and the radio FIRST catalog . Using a correlation radius of , we find three matches within a radius of the ACIS-I center. The cumulative probability of a single random association between this data is 0.016. The probability that all the three matches occurred by chance is only 3.8. Therefore, we conclude that the astrometry of this Chandra observation is not worse than without further adjustments.
2.2 Spectral analysis
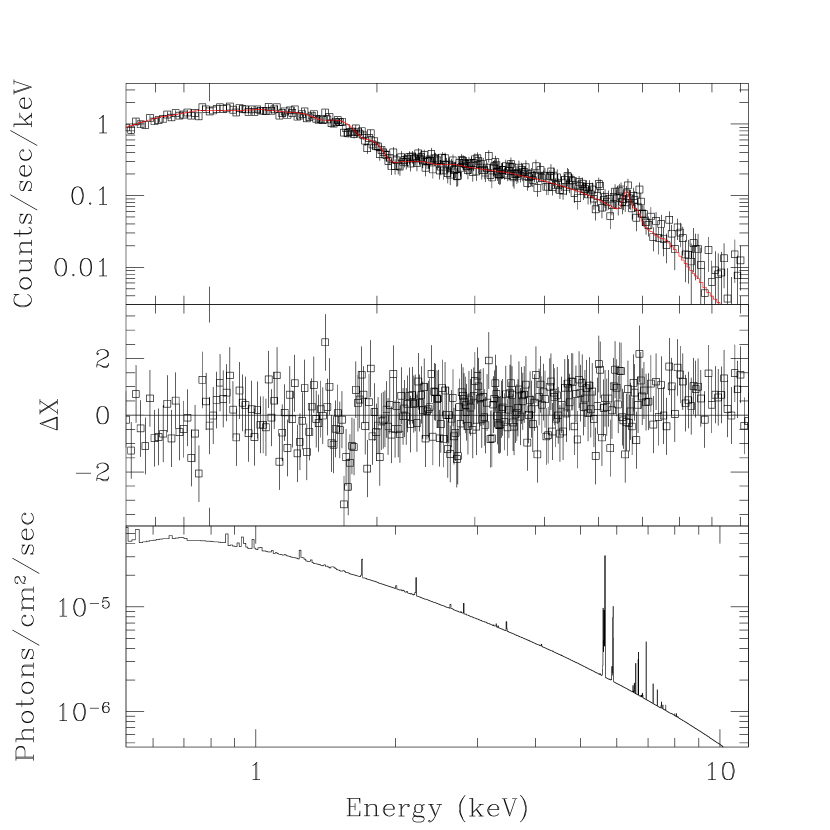
First we wish to work out the mean temperature and metallicity of the cluster. For this purpose, an overall spectrum within a large circular region of radius (corresponding to a physical radius of 0.87 Mpc) has been extracted from the cleaned events after excluding several point sources. The resulted spectrum is further grouped so that each energy bin contains at least 20 counts. Because for energies below 0.7 keV uncertainties in the current available ACIS-I response functions are relatively large, our spectrum analysis is restricted to the 0.7-9 keV energy band. We fit the spectrum using the thermal emission model MEKAL with a fixed absorption at the Galactic value, 1.8 . We find that this model (hereafter Model 1) does not give the best description of the data reflected by /d.o.f. The best fit of the data needs an additional absorption to the MEKAL model (hereafter Model 2), which improves the fit of Model 1 significantly at % confidence level with /d.o.f. The observed and fitted spectra of Abell 1689 are plotted in Figure 2, and the best fit parameters of both models are listed in Table 1. It turns out that although the resulting X-ray temperature depends sensitively upon whether or not there is an extra absorption component, the best fit value of metallicity remains almost unaffected. This last point can be seen in the confidence plot (Figure 3) of metallicity versus temperature. In summary, the average temperature and metal abundance for Abell 1689 are keV (or keV) and of solar, respectively. The bulk emission flux in the 0.5–10 keV band is , corresponding to an X-ray luminosity of erg s-1 in the 0.5–10 keV band or a bolometric X-ray luminosity of erg s-1. This is in good agreement with the expected value from the statistical - relation for clusters (Wu, Xue & Fang 1999) when the flux falling out the detection aperture is included using the model given below.
2.3 Temperature structure
Now we investigate the temperature structure of the cluster. We extract spectra for a series of annuli centered at the centroid of cluster emission (see section 2.4 for spatial analysis). All these spectra are properly grouped, which allows us to perform the minimum analysis. Here, both Model 1 and Model 2 are used. Alternatively, in order to set a robust constraint on temperature value, we freeze the metallicity parameter in the fitting process. The results are summarized in Table 2 and the azimuthally averaged temperature profile is shown in Figure 4.
2.4 Surface brightness
In order to take the possible asymmetric emission distribution into account, we first model the bulk X-ray emission of the cluster with a two-dimensional model in the form
| (1) |
where
| (2) |
and
| (3) | |||||
| (4) |
The model assumes that cluster emission has a projected elliptical brightness surface with ellipticity and position angle . The surface brightness is measured in photon counts/arcsec2/s with respect to the X-ray centroid (), and is characterized by the core radius and a power-law index . We apply this model to the exposure corrected image of the cluster in 0.3-10 keV, and also include the blank field background. The best fit results are summarized in Table 3. It appears that the core radius is in the range of , the index is 1.0–1.2, the normalization is photons s-1, and the X-ray emission centroid is located at , . Overall, the emission pattern is rather symmetric about the centroid with a very small value of ellipticity, .
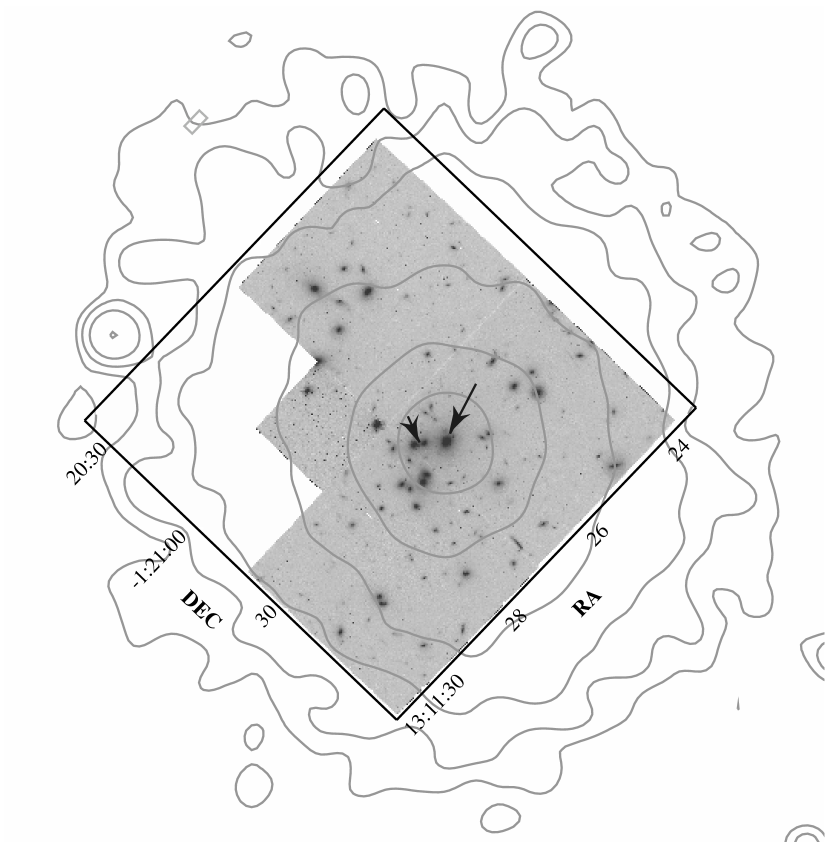
We have performed a detailed check of the HST observations of Abell 1689, which clearly shows a central dominant cD galaxy, with the position coinciding nicely with the X-ray centroid within uncertainties. We have then checked the FIRST observation in the radio band, which demonstrates a central emission peaked at (). This is about from the X-ray emission centroid. A visual examination shows that the radio centroid is centered on one of the companion galaxies around the central cD. In Figure 5, we plot the X-ray emission contours overlaid on an HST/WFPC2 image of Abell 1689.
Since the X-ray emission of the cluster is fairly symmetric, we first employ the conventional single model to fit the radial brightness profile of the cluster. However, the fitting is not acceptable, reflected by . We then adopt a double model
| (5) |
which provides a significantly reduced fit to the data with . The best fit parameters are summarized in Table 4, and the observed and fitted surface brightness profiles are demonstrated in Figure 6.
3 Mass determinations
Morphology of the overall X-ray surface brightness distribution of A1689, along with the nearly constant temperature across the cluster surface out to Mpc, suggests that Abell 1689 is a dynamically-relaxed cluster. This argument is further supported by the fact that the X-ray centroid coincides with the central dominant cD galaxy. Consequently, one may use the hydrostatic equilibrium hypothesis to evaluate the dynamical mass of the cluster. For an isothermal, double model, the total dynamical mass within radius can be obtained from
| (6) |
where is the average molecular weight, (i=1,2) is the particle number density for the th phase gas and . By reverting the observed surface brightness distribution [equation (5)], we can derive an analytic expression for (Xue & Wu 2000). Next, we infer the mass density profile from , and calculate the projected mass within radius from the cluster center along the line-of-sight. The resulting mass distribution based on the average temperature of from Model 1 is shown in Figure 7. Note that utilization of Model 1 yields a maximum estimate of the X-ray cluster mass because the temperature given by Model 1 is significantly higher than that by Model 2.
On the other hand, the projected cluster mass within the position of giant arc can be estimated through
| (7) |
where is the critical surface mass density, , and are the angular diameter distances to the cluster, to the background galaxy, and from the cluster to the galaxy, respectively. Unfortunately, the redshift of the giant arc at from the cD galaxy of Abell 1689 remains unknown. Assuming and for the arc in the above equation yields and , respectively. For comparison, the X-ray cluster mass within derived from the Chandra data reads and for Mode1 and Model 2, respectively. Namely, the ratios of strong lensing masses to X-ray masses given by spectral Model (1, 2) within are (, ) and (, ) for and , respectively. All the quoted errors are confidence limits. Recall that previous estimates based on the ROSAT and ASCA data ( keV) found a mass ratio of (Allen 1998; Wu 2000), which is in good agreement with our results based on Model 2. In other words, the high resolution observation of Chandra yields essentially the same result of X-ray cluster mass in the central core of Abell 1698. Only for Model 1 can the mass discrepancy be reduced especially when the background source is assumed at large redshifts and the measurement uncertainties are included.
The projected mass distribution of Abell 1689 has also been obtained from the study of the deficit of red galaxies behind the cluster by Taylor et al. (1998). We illustrate their reconstructed mass profile in Figure 7, allowing the uncertainties to include confidence limits. Another mass estimate is provided by Dye et al. (2001) from the comparison of luminosity functions of background galaxies between the lensed field behind Abell 1689 and an undistorted control field. Their cumulative projected masses within three radii are shown in Figure 7. Finally, Clowe & Schneider (2001) fitted their weak lensing derived cluster masses to a singular isothermal sphere for a set of assumed background galaxy redshifts, which are also demonstrated in Figure 7. It appears that the overall projected cluster masses reconstructed by four different lensing methods (arcs, number counts, distorted luminosity function of galaxies and weak lensing analysis) show a good agreement within measurement uncertainties.
The newly determined mass of Abell 1689 in the central region of Mpc by Chandra observation is systematically lower than those derived from strong and weak lensing techniques, although the two innermost data points given by the distorted luminosity function of galaxies are still consistent with the projected X-ray mass when the large measurement uncertainties are included. Nevertheless, at large radii Mpc the two mass estimates yield roughly the same result.
4 Discussion and conclusions
The high spatial resolution observation of Abell 1689 with Chandra has permitted an accurate localization of the X-ray centroid of the cluster, which shows a perfect coincidence with the central cD galaxy, suggesting that the cluster has become fully relaxed at its redshift . The central cooling time within kpc is Gyr and the cooling radius is kpc. The newly determined X-ray surface brightness and temperature distributions, incorporated with the hydrostatic equilibrium hypothesis, have allowed us to re-evaluate the projected mass profile of the cluster and compare it with the results provided by different lensing techniques. It shows that the significant mass discrepancy between X-ray and lensing methods reported in previous studies still remains even if the new Chandra data are used.
With the unprecedented sub-arcsec spatial resolution, as well as the large effective detection areas in the broad energy range of 0.3-10 keV, the new Chandra observation of Abell 1689 disagrees with previous findings based on ROSAT observation that there exists an offset of between the X-ray and optical centers (Allen 1998). The latter was suggested to be the main cause for the discrepancy between X-ray and lensing mass estimates. Indeed, the presence of such offset is a good indicator of local violent activities of the intracluster gas in the central core so that hydrostatic equilibrium may become inapplicable. An alternative is that the offset is produced by the oscillation of the central cD galaxy around the bottom of the cluster potential well (Lazzati & Chincarini 1998). The perfect coincidence between the X-ray center and the cD galaxy of Abell 1689 detected by Chandra observation, if it is not a projection effect, and the central mass discrepancy between X-ray and lensing measurements pose a challenge to the above speculation. If confirmed, this would have significant impacts on our understanding of the distribution and evolution of intracluster gas in the central cores of clusters. Future observations of other lensing clusters with Chandra would clarify the issue.
References
- (1) Allen, S. W. 1998, MNRAS, 296, 392
- (2) Allen, S. W., Ettori, S., & Fabian, A. C. 2001, MNRAS, 324, 877
- (3) Arabadjis, J. S., Bautz, M. W., & Garmire, G. P. 2001, ApJ, submitted
- (4) Clowe, D., & Schneider, P. 2001, A&A, in press
- (5) Dye, S., et al. 2001, MNRAS, 321, 685
- (6) Ebeling, H., et al. 1996, MNRAS, 281, 799
- (7) Katayama, H., Hayashida, K., & Hashimotodani, K. 2002, PASJ, in press
- (8) Lazzati, D., & Chincarini, G. 1998, A&A, 339, 52
- (9) Machacek, M. E., Bautz, M. W., Canizares, C., & Carmire, G. P. 2001, ApJ, submitted
- (10) Markevitch, M. 2001,
- (11) http://asc.harvard.edu/cal/Links/Acis/acis/Cal_prods/bkgrnd/current/index.html
- (12) Mazzotta, P., et al. 2001, ApJ, 555, 205
- (13) Miralda-Escudé, J., & Babul, A. 1995, ApJ, 449, 18
- (14) Mushotzky, R. F., & Scharf, C. A. 1997, ApJ, 482, L13
- (15) Schmidt, R. W., Allen, S. W., & Fabian, A. C. 2001, MNRAS, 327, 1057
- (16) Taylor, A. N., Dye, S., Broadhurst, T. J., Benítez, N., & van Kampen, E. 1998, ApJ, 501, 539
- (17) Tyson, J. A., & Ficsher, P. 1995, ApJ, 446, L55
- (18) Wu, X.-P. 1994, ApJ, 436, L115
- (19) Wu, X.-P. 2000, MNRAS, 316, 299
- (20) Wu, X.-P., Chiueh, T., Fang, L.-Z., & Xue, Y.-J. 1998, MNRAS, 301, 861
- (21) Wu, X.-P., & Fang, L.-Z. 1997, ApJ, 483, 62
- (22) Wu, X.-P., Xue, Y.-J., & Fang, L.-Z. 1999, ApJ, 524, 22
- (23) Xue, Y.-J., & Wu, X.-P. 2000, MNRAS, 318, 715
| Model | Temperature | Metallicity | /d.o.f | |
|---|---|---|---|---|
| () | (keV) | (Z⊙) | ||
| Model 1 | - | 13.2 | 0.35 | 344/311 |
| Model 2aaObserved flux in 0.5-10 keV, 2.7 . | 6.7 | 9.0 | 0.31 | 289/310 |
Note. — All the fittings have a fixed absorption at the Galactic value. All the errors quoted are at the 90% confidence level (i.e. ).
| Annuli() | Net counts | T1aaTemperature values are from Model 1 and Model 2, respectively. The intervals in parentheses represent 90% confidence limits. (keV) | T2 aaTemperature values are from Model 1 and Model 2, respectively. The intervals in parentheses represent 90% confidence limits. (keV) |
|---|---|---|---|
| 0-10 | 1197 | 14.5(10.4-20.8) | 9.7(7.1-13.8) |
| 10-20 | 2074 | 8.7( 7.3-10.5) | 7.8(6.7-9.3) |
| 20-30 | 1818 | 9.1( 7.6-11.5) | 7.6(6.5-9.2) |
| 30-40 | 1219 | 17.6(12.5-24.3) | 14.3(9.2-17.1) |
| 40-50 | 1388 | 12.4( 9.2-16.4) | 8.8(6.9-11.1) |
| 50-70 | 1804 | 11.8( 9.2-15.7) | 8.5(7.0-10.8) |
| 70-80 | 921 | 14.3(10.0-21.8) | 11.3(8.0-16.7) |
| 80-115 | 1850 | 13.5(10.4-18.2) | 9.8(8.0-12.6) |
| 115-155 | 1521 | 14.8(11.1-20.6) | 12.9(9.6-17.6) |
| () | (photons cm-2 s-1) | () | (degree) | ||
|---|---|---|---|---|---|
| 0.08 | 1.7 |
| () | (photons cm-2 s-1) | () | (photons cm-2 s-1) | ||
|---|---|---|---|---|---|