The X-ray jet and halo of PKS 0521365
Abstract
Chandra ACIS observations of PKS 0521365 find that the X-ray emission of this BL Lac object consists of emission from an unresolved core, a diffuse halo, and a 2 arcsec jet feature coincident with the inner radio/optical jet. A comparison with a new ATCA 8.6-GHz map also finds X-ray emission from the bright hotspot south-east of the nucleus. The jet spectrum, from radio to X-ray, is probably synchrotron emission from an electron population with a broken power-law energy distribution, and resembles the spectra seen from the jets of low-power (FR I) radio galaxies. The hotspot X-ray flux is consistent with the expectations of synchrotron self-Compton emission from a plasma close to equipartition, as seen in studies of high-power (FR II) radio galaxies. While the angular structure of the halo is similar to that found by an analysis of the ROSAT HRI image, its brightness is seen to be lower with Chandra, and the halo is best interpreted as thermal emission from an atmosphere of similar luminosity to the halos around FR I radio galaxies. The X-ray properties of PKS 0521365 are consistent with it being a foreshortened, beamed, radio galaxy.
keywords:
galaxies: active – BL Lacertae objects: individual: PKS 0521365 – X-rays: galaxies – radio continuum: galaxies1 Introduction
It has been suggested (e.g., Antonucci & Ulvestad 1985; Ulrich 1989; Urry & Padovani 1995) that BL Lac objects are “unified” with FR I radio galaxies (FRIRGs), so that the only difference between BL Lac objects and FRIRGs is their orientation relative to the observer’s line of sight. Thus BL Lac objects are supposed to be viewed from a direction close to the nuclear jet, whose Doppler-boosted emission dominates the appearance of the object at radio to -ray energies. FRIRGs are supposed to be viewed from a direction outside the nuclear jet, so that the nucleus is faint relative to the outer radio structure, the optical galaxy, and the unbeamed X-ray emission.
This idea has been tested through comparisons of BL Lac and FRIRG number densities, extended (and hence isotropic) radio luminosities and morphologies, and the optical luminosities and morphologies of the underlying galaxies (Morris et al. 1991; Perlman & Stocke 1993; Pesce, Falomo & Treves 1996). Tests based on X-ray properties, which are intrinsically among the most interesting since strong X-ray emission is a defining feature of BL Lac objects, have fitted the distribution of X-ray luminosity to a theoretical function based on some beaming factor and beam opening angle, using either the total X-ray luminosity (e.g., Padovani & Urry 1990) or the core X-ray luminosity, after any extended X-ray emission has been removed (Canosa 2000; Hardcastle et al. 2001).
Another possible X-ray test of the identification of BL Lac objects as beamed FRIRGs can be made based on the association of FRIRGs with strong X-ray emission from galaxy-to-group scale gas distributions (Worrall & Birkinshaw 1994, 2000). Since this emission is thermal and extended, it must radiate isotropically, and therefore should appear with similar properties around BL Lac objects and FRIRGs. A clear difference between the extended X-ray emissions near BL Lacs and FRIRGs would constitute evidence against a strong unification hypothesis.
This test is difficult because the extended X-ray emission has low contrast relative to the BL Lac’s unresolved active galactic nucleus (AGN). Wings on the point response function (PRF) of the X-ray optics and detector used to observe a BL Lac are therefore likely to exceed the brightness of the extended emission. Nevertheless, Hardcastle, Worrall & Birkinshaw (1999), using the ROSAT HRI, reported a halo of resolved emission around the AGN in the low-redshift (; Keel 1985) BL Lac PKS 0521365. Although PKS 0521365 had a low X-ray flux during this observation, the halo was only detectable above the wings on the HRI’s PRF over a small range of angles. The inferred halo luminosity, of , was far higher than the values typical of the FRIRGs in the B2 sample of Worrall & Birkinshaw (1994). Since the core radius of the PKS 0521365 X-ray halo was found to be only 8 arcsec (12 kpc for , , as assumed throughout this paper), the hot gas appeared to be confined near the host galaxy, rather than being associated with the group of galaxies in which PKS 0521365 lies, as is more usual for FRIRGs..
At this luminosity the cooling time of gas in the X-ray halo is less than yr, so that a halo of this size and luminosity would be expected to be participating in a rapid cooling flow, with an estimated infall rate . The ROSAT HRI data could not measure the temperature of the gas, or say whether the extended halo had the structure of a cooling flow near the AGN.
For these reasons, we obtained an imaging observation of PKS 0521365 with the Chandra ACIS-S. We anticipated that this would provide detailed structural and spectral information on the various components of the source, including the ROSAT-detected halo.
Chandra has shown that X-ray jets are relatively common in low-power radio galaxies (Worrall, Birkinshaw & Hardcastle 2001). Such jets are best interpreted as synchrotron emission from a high-energy continuation of the same electron spectrum responsible for the radio output. Thus if BL Lac objects are simply FRIRGs seen in projection, we might expect to see the same X-radiation from the jets as is seen in radio galaxies, with a similar X-ray to radio power ratio. However, this requires that the observation has enough angular resolution to measure a foreshortened jet feature close to the Doppler-enhanced X-ray core. PKS 0521365 is known to exhibit a radio/optical jet on arcsecond scales (Keel 1986; Macchetto et al. 1991) which connects to an inner VLBI jet on milliarcsec scales (Tingay et al. 1996), and so the arcsec jet might be resolvable from the bright core by Chandra.
Our observation of PKS 0521365, made early in the Chandra mission, successfully detected and studied the halo, and found X-radiation associated with both the arcsec-scale inner jet of the BL Lac and the hotspot of its radio structure. In this paper we describe these Chandra results, and their interpretation in terms of emission mechanisms and unified schemes for BL Lac objects.
2 Observations
2.1 X-ray observations
The Chandra observation of PKS 0521365 was made on 31 December 1999. The telescope was pointed so that the source was located near the aim-point of the back-illuminated CCD chip S3 of the Advanced CCD Imaging Spectrometer (ACIS). Unfortunately, at this early stage of the mission the standard offsets placed PKS 0521365 close to the boundary between two readout nodes of the S3 chip, so that the source moved between regions of the chip with somewhat different responses, and the dead region between them, as the pointing direction of the observatory was dithered by about 20 arcsec.
Since PKS 0521365 was expected to produce a high X-ray count rate, in excess of 1 count , the observation was made with the minimum permitted ACIS frame time (0.4 sec). To achieve this it was necessary to observe with a small window on the CCD. This window was 128 pixels (each of arcsec on a side) wide, and 1024 pixels long, and at the roll of the satellite during these observations (), the long axis of the viewing window lies in position angle
Even with the reduced frame time, there is a significant chance that several photons will be received from the core of PKS 0521365 in a single CCD pixel within a single integration. This “pileup” effect leads to a distortion of the spectrum of the core and a reduction in the count rate relative to the true incoming rate. Another consequence of pileup is that the image of the core differs from the images of fainter, unresolved, sources, in the sense of appearing somewhat extended and flat-topped. Finally, because the count rate is high, there is a significant probability that the CCD will record photons from the source while the data are being clocked to the readout registers. This causes faint “readout streaks”, which appear in position angles and from the core of the source for the roll of these data.
The data were provided to us in a variety of processing states: the analysis reported here was performed on data processed using pipeline software version R4CU5UPD11.1, and used software from the CIAO v2.0.2. After screening out periods of high background, the original exposure of 9122 sec (live time, from an on-source time of 9870 sec) was reduced to 7776 sec of live time.
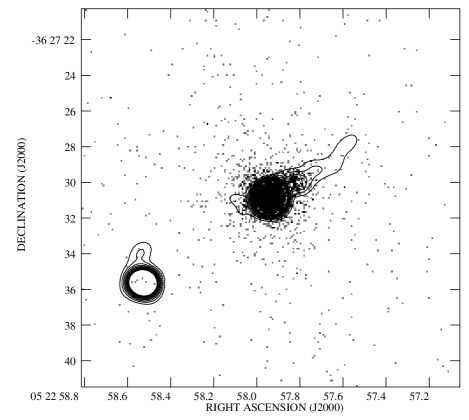
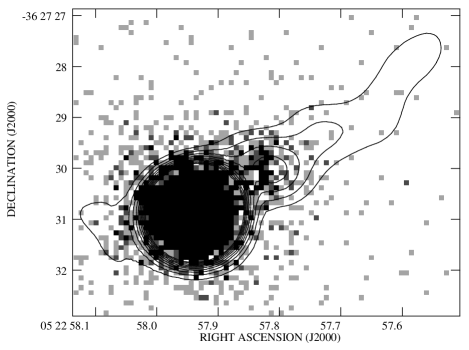
An image was made from the events file by restricting the apparent photon energies to the relatively well-calibrated range keV, and corrections were made for the effective area of the instrument and the exposure. At the same time, the data were reprocessed to remove the anti-aliasing pixel randomization included in the standard pipeline, to produce an image with the best possible angular resolution, and were resampled onto a pixel scale one fifth that of the ACIS-S pixels ( arcsec). The resulting image is shown in Fig. 1. Clearly visible in this image is the bright concentration of counts at the core of the AGN, an asymmetric excess of counts associated with the brightest feature in the radio jet to the north-west (at J2000 coordinates RA , Dec ), and a radial gradient in the count density from the AGN. An excess of counts is also be associated with the bright hotspot of the radio structure, to the south-west of the source.

Spectral analyses were performed using the CIAO SHERPA package, after calculating the response matrices in the standard fashion. Although the matrices used for fitting were appropriate for only one of the readout nodes of the ACIS-S3 chip (the node on which most of the counts lie), tests using matrices calculated for the other readout node showed no significant differences from the results presented here. Fits were performed only in the relatively well-calibrated energy range , and only after the counts had been binned such that there were 20 or more counts in each energy bin.
A radial profile centred on the core of PKS 0521365 was extracted from the subsampled, keV image, and analysed in the manner described in Worrall et al. (2001), using an averaged point response function based on the CIAO PRF library and the spectra of several similar sources. This radial profile (shown in Fig. 3) is expected to be a poor representation of the true source structure near the core because of pileup: fits to the profile therefore ignored the central 1.2 arcsec diameter circle. In addition, the profile was constructed after omitting the jet region and the readout streaks. The final profile contains only about a third of the detected counts within a radius of 23.5 arcsec.

2.2 Radio observations
To complement these X-ray data, we mapped PKS 0521365 using the Australia Telescope Compact Array (ATCA) in its 6D configuration on 4 and 5 April 2000, giving baselines from 77 to 5878 m. Data were obtained at 1.384, 2.496, 4.800, and 8.640 GHz with 128 MHz bandwidth subdivided into 32 channels (of which 16 are independent and only 13 are useful). 10-second integrations were used at all bands. Observations of PKS 0521365 were calibrated for amplitude against the standard southern calibrator PKS 1934638, and PKS 0537-441 was used as the local phase calibrator.
All six antennas of the ATCA were available for most of the observation, although difficulties with the correlator caused some coverage to be lost, and some of the data were taken in bad weather, so that the phase stability was sometimes poor. Phase calibrations were made every 15 minutes to compensate for the unstable conditions, but after basic calibration and data-editing using MIRIAD, a lengthy process of self-calibration (in AIPS) was needed to correct the phases and improve the images. Only a small fraction of the data were lost because of bad amplitudes, interference, or phase jumps. Residual phase errors limit the dynamic range of the final image to about .

Fig. 1 shows contours of the 8.6-GHz, 1-arcsec resolution radio map of PKS 0521365 superimposed on an image of the 0.3-7.0 keV X-ray counts derived from our Chandra ACIS-S data. The radio map shows an unresolved component at the core of PKS 0521365, a clear jet to the north-west dominated by a knot about 1.5 arcsec from the core, and a compact hotspot to the south-east. A Gaussian fit to the hotspot measures a FWHM of 0.4 arcsec. This result will be important in Sec. 3.4.
Much low-surface-brightness emission does not appear on Fig. 1 at these contour levels, but is revealed on a lower-resolution map of PKS 0521365, made with our ATCA 2.5-GHz data, and shown in Fig. 2. The diffuse, extended, radio emission associated with the source is seen to surround the radio core and the hotspot to the south-east. Only a slight extension of the radio core to the north-west betrays the presence of the radio jet.

The distorted radio morphology of PKS 0521365 evident in these maps is characteristic of radio-selected BL Lac objects, but PKS 0521365 is somewhat unusual in showing the bright jet typical of FR I radio galaxies to the north-west combined with a hotspot, typical of FR II radio galaxies, to the south-east. FR II-like and FR I-like extended radio morphologies are about equally common in radio-selected BL Lac objects (Rector & Stocke 2001). It is not implausible, therefore, that a BL Lac should show a mixed-morphology radio structure, which may be related to the structures of radio galaxies with luminosities near the FR I/FR II break (Gopal Krishna & Wiita 2000).
3 Analysis
3.1 The core
The X-ray image of PKS 0521365 in Fig. 1 is dominated by a strong core component, responsible for in a 2-arcsec diameter circle. At this count rate the core is strongly piled up, and individual counts frequently correspond to the combined energies of two or three photons that arrived during a single frame. Nevertheless a spectrum was extracted and a spectral fit was attempted, using counts from a region 2.2 arcsec in diameter about the centre of the core and the standard choice of event grades (ASCA grades 0, 2, 3, 4, and 6). The effects of pileup in the resulting spectrum (Fig. 4) are clear from the shallowness of the Ir edge (at about 2 keV) introduced by the mirror coatings. This edge feature is suppressed by the pileup of the high-count 1 keV photons, which correspondingly are depleted in the observed spectrum.
No CIAO task exists to correct for pileup at present, and therefore fits to the core spectrum will be subject to a systematic error in the sense of underestimating the core flux density at low energies and underestimating the spectral index of the core, (defined in the sense that the flux density ). In addition, this early observation was pointed so that the core lies on the junction of two readout nodes of the ACIS-S3 chip. In such a location, it is difficult accurately to estimate the response matrix appropriate for the analysis of the spectrum, and a further systematic error is possible.
Nevertheless, some indication of the properties of the core X-radiation can be deduced from the X-ray spectrum. A fair fit to the data is obtained by fitting to an absorbed power-law spectrum (Fig. 4). The best-fitting spectrum has a spectral index (corresponding to a photon index ), consistent with the spectral index found by Garilli & Maccagni (1990) using EXOSAT, but flatter than the value reported by Hardcastle et al. (1999) based on the ROSAT PSPC data. The effects of pileup and inadequate calibration of the response matrix may cause a systematic error of about on the measured power-law index. The corresponding best-fit 1 keV photon flux density, (), is likely to be a serious underestimate (and, indeed, is a factor below the flux density measured by the ROSAT PSPC). If account is taken of the Galactic column towards PKS 0521365 (; Elvis, Wilkes & Lockman 1989), no absorbing column associated with the AGN is required in this fit (Fig. 5): the upper limit is . Pileup and calibration uncertainties affect the shape of the core spectrum below the peak, but an intrinsic absorbing column significantly larger than this limit would strongly affect the cut-off energy in Fig. 4, so that we believe that the limit on quoted above is reliable, and indicates that we are observing the core emission free from an absorbing column as large as found towards the cores of FRIRGs.
No correction for background was needed in making these spectral fits: a nearby background region with the same area as the source extraction region contained only 4 counts (about 3 of which arise from the wings of the response from the core), compared with the 7900 counts in the spectrum shown in Fig. 4.
3.2 The jet
A close examination of the structure of the X-ray emission from the jet knot (knot A in the notation of Scarpa et al. 1999) appears to show an elongated structure with its long axis lying in position angle . This is roughly perpendicular to the local ridge-line of the radio jet (see Fig. 6), and differs significantly from the position angles of the chip pixelization. The elongation may therefore be real despite appearing exceptionally narrow, and potentially being subject to dither effects and aliasing in the ACIS pixel assignments. Similar narrow, jet-crossing, features have been seen in other radio jets (e.g., 3C 66B; Hardcastle, Birkinshaw & Worrall 2001b), and tend to lie just core-wards of bright jet radio knots.
The emission from this X-ray knot is clearly contaminated by counts from the wings of the response to the AGN. 334 counts at energy are found from knot A, where the counts were extracted from a circular region with diameter 2.2 arcsec centred on the knot. A similar extraction region on the opposite side of the core was used for background, since it was expected to be equally contaminated by counts from the wings of the core. This background region contains 92 counts. Neither the jet knot nor the background region show count rates high enough that pileup is a problem. Thus about a quarter of the counts from the region centred on the jet knot can be attributed to contamination from the core, or emission from the thermal halo. After correcting for this background, we find that the knot is detected by Chandra at in keV.

The spectrum extracted from the jet region including background from the core and thermal halo is shown in Fig. 7. Sufficient counts exist for meaningful fits only in the energy range keV. The fits were performed using SHERPA’s ability to fit source and background simultaneously. The jet emission was modelled as a power-law, absorbed by the Galactic column and a possible excess at the redshift of PKS 0521365. The background was modelled as a simple power-law (found to have a similar photon index to that of the jet knot; Fig. 7), which was expected to be a good representation of the superposition of the peripheral counts from the core of the the AGN and the thermal halo.
The best fit (shown in Fig. 7) involves an intrinsic absorbing column of , but this is not significant (Fig. 8). If the additional column is set to zero, as suggested by the fit to the core spectrum, the jet energy spectral index changes from to ( errors with one interesting parameter). The significant change in the error on the spectral index arises from the strong correlation between the fitted power-law index and the poorly-constrained absorbing column (Fig. 8). The value of at the best fit (, with 23 degrees of freedom) is only slightly less than the value with no absorbing column (, with 24 degrees of freedom). None of the other fitted parameters vary by more than 10 per cent of their errors if it is assumed that there is no intrinsic absorbing column at PKS 0521365.

The 1-keV flux density of the jet knot, from the best fit without intrinsic absorption, is , which corresponds to an keV luminosity of if the emission is isotropic. The spectral energy distribution of this knot is shown in Fig. 9, where flux densities (given in Table 1) are for a nominal 2.2-arcsec diameter aperture centred on the X-ray knot. The solid line drawn on Fig. 9 is calculated as the synchrotron emission from a population of electrons with a broken power-law energy distribution.
On Fig. 9 the radio spectrum appears steeper by about than the model, which has a radio spectral index of (corresponding to an electron energy index ), probably because of a contribution to the lower-frequency flux densities from steeper-spectrum emission from the halo. The X-ray spectrum is significantly steeper, with . This extrapolates back to a good match to the R-band optical flux measured by Scarpa et al. (1999), and implies that the spectrum must break by in the infra-red. For the equipartition magnetic field strength of (estimated assuming that the knot is moving non-relativistically, has an angular diameter of , is completely filled by magnetic fields and relativistic electrons of energies , and that there is a negligible contribution to the total energy from protons), this break lies at an electron energy of about .
| Frequency (Hz) | Flux density | Reference |
|---|---|---|
| this work | ||
| this work | ||
| Scarpa et al. (1999) | ||
| Scarpa et al. (1999) | ||
| this work |
The amplitude of the break in the spectrum corresponds to a change in electron energy power-law index . Such a large break is unexpected from simple synchrotron ageing arguments, and suggests that there is a change in efficiency of the electron acceleration process at about . In the shape of the inferred electron energy distribution and the value of the equipartition magnetic field, this knot is very similar to that in 3C 66B.

Also plotted on Fig. 9 are the expected levels of inverse-Compton emission from the electrons scattering the microwave background radiation and the jet’s own synchrotron emission, assuming that the population of electrons in the jet is given by equipartition arguments. The turndown in the predicted inverse-Compton emission from scattering the microwave background radiation occurs because of the assumed lower energy limit of for the electron population. Neither scattering process can be responsible for as much as of the X-ray emission seen under the assumption that the jet is non-relativistic.
If the jet speed is highly relativistic, then the level of inverse-Compton emission from scattering the microwave background is higher than modelled in Fig. 9, with a Lorentz factor being sufficient to produce the observed X-ray brightness. However, even in this case the predicted spectrum would be too flat to match the steep X-ray spectrum measured by Chandra unless there is a substantial population of low-energy electrons (which must emit radio synchrotron radiation only at frequencies below ). An additional photon source, for example beamed emission from the nucleus, can also add extra inverse-Compton X-ray emission, but again the predicted spectrum would be a poor match to the data unless a low-energy electron population is present.
Thus, since the X-ray spectrum produced by inverse-Compton X-ray emission would have (the same spectral index as the source photons, which are upscattered principally from the radio and mm-wave bands), while the observed spectrum has , we conclude that the jet X-ray emission in PKS 0521365 arises from synchrotron radiation, as it does in FRIRGs (Hardcastle et al. 2001b; Worrall et al. 2001). The appearance of the spectral energy distribution from PKS 0521365 (Fig. 9) also strongly resembles that seen in FRIRGs.
3.3 The halo
Hardcastle et al.’s (1999) analysis of the ROSAT HRI data implied a bright X-ray halo about PKS 0521365. At the best-fit halo brightness, and assuming that the temperature of gas responsible for the halo is we would have expected Chandra to detect about 10 times as many counts from the halo in Fig. 1 as were found in the ROSAT image. However, the radial profile (Fig. 3) shows a much fainter level of emission. At 10 arcsec from the core, where the excess above the PRF wings is strongest, the halo contributes about . The earlier fits to the ROSAT HRI data showed a best-fit brightness at 10 arcsec of about , which would suggest an ACIS brightness of , four times brighter than the halo that appears in Fig. 3.

However, the error on the brightness of the halo derived from the HRI image analysis was considerable, since excess counts above those expected for a bright point source were seen only in the angular range arcsec, with the wings dominating further out and the core response dominating close in. If a slightly altered HRI point response function (based on more recent calibrations than were available at the time of the Hardcastle et al. analysis) is used, the best fit changes dramatically, from to , core radius to arcsec, and halo brightness at 10 arcsec of to . While these results are even less consistent with the Chandra data, the strong change in the fit based on a small variation in the HRI calibration indicates that large systematic errors are possible in the HRI-derived halo parameters. Furthermore, when account is taken of the range of models allowed by the HRI data, the error on the 10-arcsec count rate is about 50 per cent.
If the radial profile in Fig. 3 is fitted using a standard point response for the core, and the central region is excluded because of the misfit anticipated because of pileup, it is found that the best-fitting model halo has structural parameters and core radius arcsec, strikingly similar to the values found by Hardcastle et al. (1999). Adopting the new Chandra normalization of the halo, however, has the effect of reducing the halo brightness by about an order of magnitude from the value reported based on the ROSAT data: the implied total X-ray emission from the halo of about in , corresponds to a bolometric X-ray luminosity (using a temperature of for the halo gas), or in the band, about a factor fainter than was measured by ROSAT (Hardcastle et al. 1999).
A spectral analysis of the halo was attempted by extracting the counts from a region between 5 and 20 arcsec from the core, excluding the readout streaks, and background from 20 to 27 arcsec from the core. The halo extraction region contains 554 counts, while the background region contains 212 counts of which about 27 (based on the best-fitting structural model) arise from the outer halo. Roughly 40 counts in the halo region arise from the wings of the response to the AGN. This complicated situation was dealt with by making a simultaneous fit to the halo and background spectra, with the background represented by two power-law spectra: a flat component that models the particle background, and a steep component that models the soft X-ray background. This representation of the background is consistent with the spectra seen in other regions of the S3 chip. A good fit (Fig. 10) is found with the halo emission arising from a (Raymond-Smith) thermal plasma with temperature , abundance solar ( errors with 2 interesting parameters, see Fig. 11), and 1-keV flux density . No additional absorbing column is needed. A thermal spectrum for the halo, with and 35 degrees of freedom, is superior to a power-law fit ( with 36 degrees of freedom). Adding a power-law component to the halo model, to correct for counts from the wings of the AGN’s PRF, has no significant effect on the goodness of fit or the best-fit parameters.

The halo temperature and luminosity are similar to the values seen from the atmospheres of FRIRGs and lie close to the correlation between these quantities described by Worrall & Birkinshaw (2000). Thus the properties of the halo of PKS 0521365 are consistent with the unification hypothesis, that BL Lac sources and FRIRGs are from the same population seen at different orientations.
3.4 The hotspot
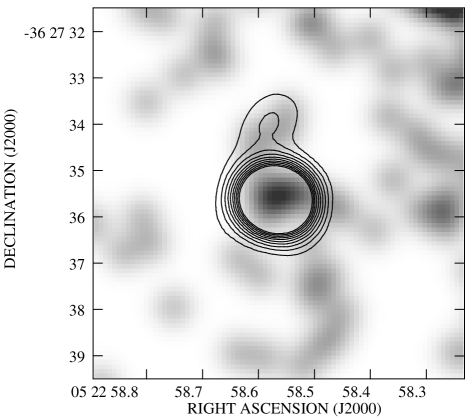
An excess of counts is seen within the 20 mJy contour of the radio map of Fig. 1. This is better represented in the convolved image of Fig. 12, where a clear X-ray peak is associated with the radio hotspot. We find 5 counts within 1 arcsec of the centre of the hotspot, while the local background implies that only 1 count would be expected by chance. This corresponds to a significant detection of the hotspot, although its flux, of about in , is poorly determined.
The corresponding 1 keV flux density of the hotspot is about 0.4 nJy. If we model it as an 0.4-arcsec diameter sphere (consistent with its extension on the 8.6-GHz ATCA map, Fig. 1), and assume it to be completely filled with a uniform magnetic field and a relativistic electron-proton plasma whose energetics are dominated by the electrons, then assuming equipartition and electron energy limits , the predicted synchrotron self-Compton X-ray flux density from the hotspot is about 0.2 nJy.
While the significance of the detection is low, the reasonable agreement between the observed and predicted X-ray count rates from the hotspot is consistent with the hotspot being close to equipartition between its population of relativistic electrons and magnetic energy. Inhomogeneities in the structure of the hotspot, the presence of electrons with different energy distributions, or small departures from equipartition are sufficient to match the observed X-ray flux density more closely. Similar results have now been seen in a number of other radio hotspots (e.g., 3C 123; Hardcastle, Birkinshaw & Worrall 2001a).
4 Conclusions
Our observation of PKS 0521365 has confirmed the existence of an X-ray emitting halo around the AGN, but at a lower luminosity than suggested by the ROSAT HRI data. The brightness of the halo, as seen with Chandra is consistent with the halo brightnesses seen around FRIRGs, supporting the idea that this BL Lac is an FRIRG seen in a favourable orientation, and that BL Lac objects do not have unusual X-ray atmospheres.
The detection of an X-ray bright region near the radio knot in the jet, though initially surprising, is again consistent with recent Chandra results on FRIRGs. Indeed, the spectral energy distribution of emission from the knot strongly resembles that from the inner jet region of 3C 66B (Hardcastle et al. 2001b) or M 87 (Böhringer et al. 2001), and can be fitted well as synchrotron emission with a broken power-law spectrum. However, the break that we infer in the spectrum is larger than the value that would occur in a continuous-injection model for the relativistic electrons, and is also inconsistent with a single-injection aged spectrum, which would have an exponential cut-off above some maximum energy. The flattened appearance of the knot X-rays, their slight offset from the radio peak, and the analogy with FRIRGs, suggests that we are seeing evidence of energy-dependent electron acceleration.
There is evidence that X-rays are being detected from the hotspot of PKS 0521365 at a level consistent with equipartition of relativistic electron and magnetic field energy densities in this structure. This is consistent with recent results for the hotspots in many FR II radio galaxies.
Further study of the intriguing emission structure in the radio jet demands better optical, near-IR, and sub-mm data to constrain the shape of the spectral energy distribution and confirm our inference about the location of the break, but could also benefit from a longer X-ray exposure to acquire better statistics on the shape of the emission region in the X-ray. A longer X-ray exposure would also check our tentative detection of the hotspot.
Clearly it would be of great interest to discover whether the results seen for PKS 0521365, which suggest that it is a beamed radio galaxy as required by unification schemes, are common to a sample of BL Lac objects rather than a peculiarity of this single source. PKS 0521365 is in some ways an unusual BL Lac. Its radio structure displays characteristics of both FR I and FR II sources oriented close to the line of sight. Although radio-selected (and hence a Radio BL Lac), it has been described as a flat-spectrum radio quasar on the basis that it has a spectral energy distribution peaking at high energies (like the X-ray selected BL Lac objects: more strictly, the high-energy peaked class rather than the low-energy peaked class) and a rather steep X-ray spectrum (Donato et al. 2001). Furthermore, its spectrum has both broad and narrow emission lines above a strong blue continuum, plus emission from the stellar component of the underlying elliptical galaxy (Danziger et al. 1979), and so has some resemblance to a low-power, flat radio-spectrum, quasar, although these emission lines are relatively weak and the overall appearance of the spectrum is very similar to that of the well-known BL Lac 3C 371 (Angel & Stockman 1980), in which Chandra has also mapped jet X-ray emission (Pesce et al. 2001). It is therefore important that more low-redshift BL Lac objects selected to cover a range of properties, be well-imaged by Chandra to see whether similar X-ray jets and halos can be found.
Acknowledgments
MB and DMW are grateful to the staff of the ATCA for their assistance during the observing run. The Australia Telescope is funded by the Commonwealth of Australia for operation as a National Facility, managed by CSIRO.
References
- [1] Angel, J.R.P., Stockman, H.S., 1980, ARAA, 18, 321
- [2] Antonucci, R.R.J., Ulvestad, J.S., 1985, ApJ, 294, 158
- [3] Böhringer, H. et al. 2001, A&A, 365, L181
- [4] Canosa, C.M., 2000, PhD thesis, University of Bristol
- [5] Canosa, C.M., Worrall, D.M., Hardcastle, M.J., Birkinshaw, M., 1999, MNRAS, 310, 30
- [6] Danziger, I.J., Fosbury, R.A.E., Goss, W.M., Ekers, R.D., 1979, MNRAS, 188, 415
- [7] Donato, D., Ghisellini, G., Tagliaferri, G., Fossati, G., 2001, A&A, 375, 739
- [8] Elvis, M., Wilkes, B.J., Lockman, F.J, 1989, AJ, 97, 777
- [9] Garilli, B., Maccagni, D., 1990, A&A, 229, 88
- [10] Gopal-Krishna, Wiita, P., 2000, A&A, 363, 507
- [11] Hardcastle, M.J., Birkinshaw, M., Worrall, D.M., 2001a, MNRAS, 323, L17
- [12] Hardcastle, M.J., Birkinshaw, M., Worrall, D.M., 2001b, MNRAS, 317, 623
- [13] Hardcastle, M.J., Worrall, D.M., Birkinshaw, M., 1999, MNRAS, 305, 246
- [14] Hardcastle, M.J., Worrall, D.M., Birkinshaw, M., Canosa, C.M., 2001, MNRAS, submitted
- [15] Keel, W.C., 1985, AJ, 90, 2217
- [16] Keel, W.C., 1986, ApJ, 302, 296
- [17] Macchetto, F., et al. 1991, ApJ, 369, L55
- [18] Morris, S.L., Stocke, J.T., Gioia, I.M., Schild, R.E., Wolter, A., Maccacaro, T., della Ceca, R., 1991, ApJ, 380, 49
- [19] Padovani, P., Urry, C.M., 1990, ApJ, 356, 75
- [20] Perlman, E.S., Stocke, J.T., 1993, ApJ, 406, 430
- [21] Pesce, J.E., Falomo, R., Treves, E., 1996, AJ, 110, 1554
- [22] Pesce, J.E., Sambruna, R.M., Tavecchio, F., Maraschi, L., Cheung, C.C., Urry, C.M., Scarpa, R., 2001, ApJ, 556, L79
- [23] Rector, T.A., Stocke, J.T., 2001, AJ, 122, 565
- [24] Scarpa, R., Urry, C.M., Falomo, R., Treves, A., 1999, ApJ, 526, 643
- [25] Tingay, S.J. et al. 1996, ApJ, 464, 170
- [26] Ulrich, M.-H., 1989, in ‘BL Lac Objects’, 45; eds. Maraschi, L., Maccaccaro, T., Ulrich, M.-H.; Springer-Verlag
- [27] Urry, C.M., Padovani, P., 1995. PASP, 107, 803
- [28] Worrall, D.M., Birkinshaw, M., 1994, ApJ, 427, 134
- [29] Worrall, D.M., Birkinshaw, M., 2000, ApJ, 530, 719
- [30] Worrall, D.M., Birkinshaw, M., Hardcastle, 2001, MNRAS, 326, L7