The Crab pulsar and its environment.
Jesper Sollerman (ESO, Stockholm Observatory) and Veronica Flyckt (ESO, Luleå University of Technology)
1 Introduction
The Crab Nebula is a supernova remnant. The supernova exploded in 1054 AD, and was monitored by contemporary Chinese astronomers (see e.g., Sollerman, Kozma, & Lundqvist 2001). Today the nebula offers a spectacular view, with a tangled web of line emitting filaments confining an amorphous part ghostly shining in synchrotron light. The beauty of the Crab makes it repeatedly appear in PR pictures, even from a southern observatory like the VLT (Fig. 1).
At the heart of the nebula resides the energetic 33-ms Crab pulsar. This m object actually powers the whole visible nebula. The Crab nebula and its pulsar are among the most studied objects in the sky. This astrophysical laboratory still holds many secrets about how supernovae explode and about how pulsars radiate and energize their surrounding nebulae.
A main theme for pulsar research has been to understand the emission mechanism for the non-thermal pulsar radiation. This is still to be accomplished. No comprehensive model exists that can explain all the observed features of the radiation. Observationally, only recently was a broad range UV-optical spectrum of the pulsar published (Sollerman et al. 2000). We have now extended the study into the infrared (IR).
But even if most of the research on the Crab pulsar has concerned the radiation mechanism, almost all of the spin-down energy actually comes out in the particle wind. This is the power source of the Crab nebula. The stunning image of the pulsar environment obtained with CHANDRA (Fig. 2) captures a glimpse of the energetic processes at work. Direct evidence of the pulsar activity have long been seen in the system of moving synchrotron wisps close to the pulsar itself.
The detailed study of the wisps was started by Scargle (1969) using observations obtained before the authors of this article were born. Hester et al. (1995) used the HST to study the wisps at higher resolution, and presented their observations as the spectacular ’The Crab Movie’111http://oposite.stsci.edu/pubinfo/pr/1996/22.html, where the constant activity in the region around the pulsar is highlighted.
The most stunning discovery in these HST images was the knot sitting just 0.6 arcseconds from the pulsar. At 2 kpc this amounts to a projected distance of only 1000 AU. Hester et al. interpreted this feature as a shock in the pulsar polar wind. Our IR observations also allowed us to have a look at these manifestations of the magnetic relativistic wind from the pulsar.
2 IR photometry, reductions and results
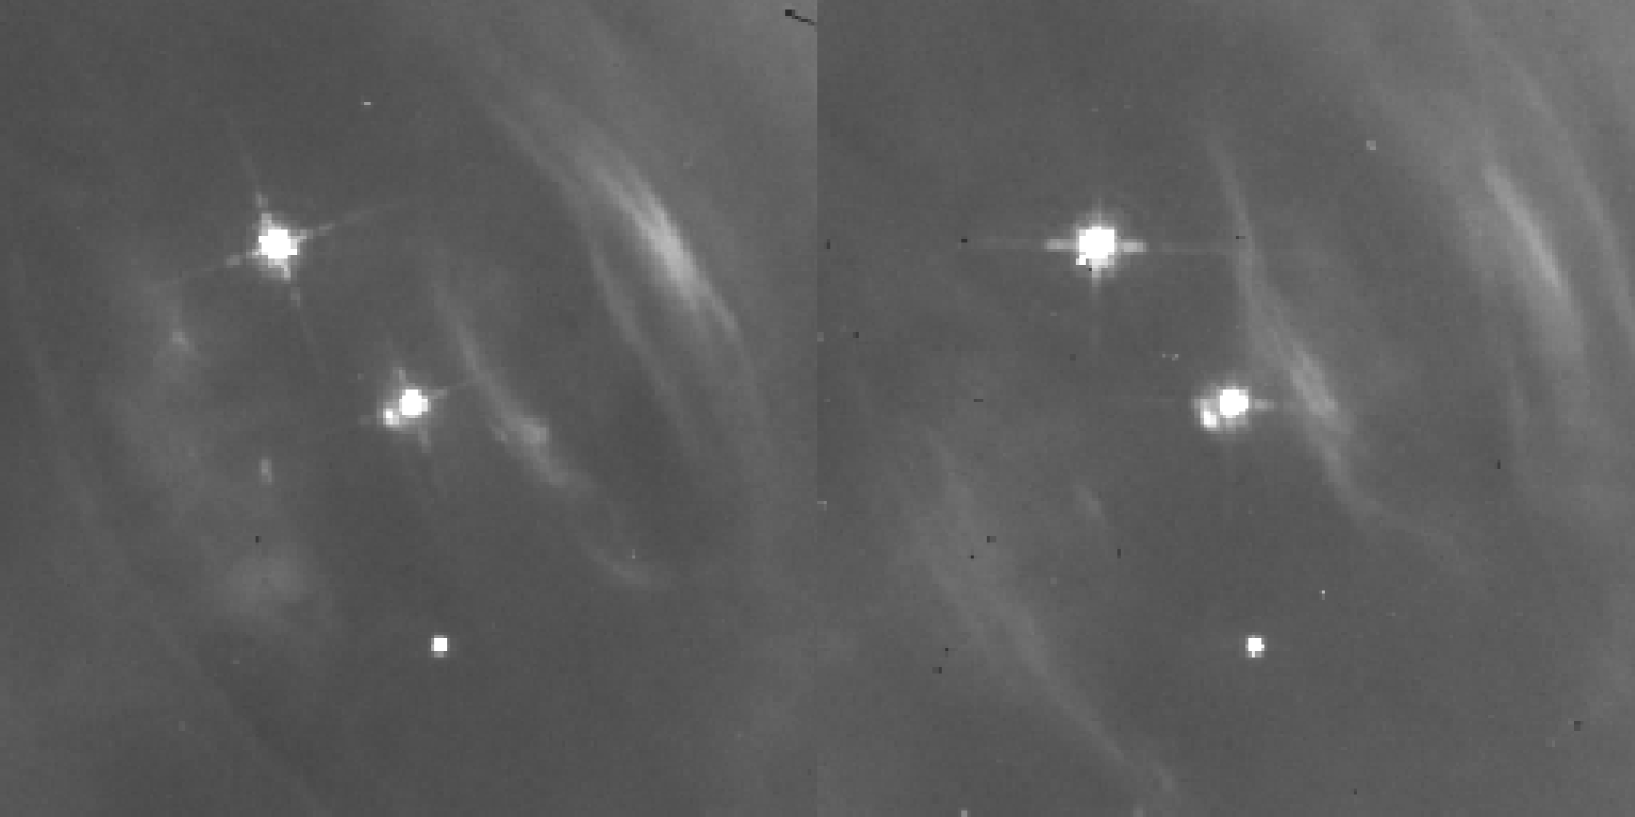
IR imaging in the short wavelength (SW) mode of ISAAC was obtained in service mode on VLT on October 13, 2000. The exposures were taken in s, and s with a total exposure time of 156 seconds per band. The main goal of these short exposures was to properly calibrate our IR spectroscopy. However, the image quality provided by Paranal also allowed a detailed view of the central region of the Crab nebula. The near-IR images are displayed next to each other in Figure 3.
Photometry was obtained of the Crab pulsar and some of the stars in the field using PSF-fitting (DAOPHOT). We estimate that our magnitude measurements of the pulsar are correct to about 0.05 magnitudes.
In Figure 4 we plot our measurements as de-reddened fluxes together with the optical-UV data from Sollerman et al. (2000). We note that our IR fluxes deviate significantly from the most recent results published by Eikenberry et al. (1997). Our measurements give a fainter pulsar by some 0.3 magnitudes.
The pulsar magnitudes of Eikenberry et al. agree with those in the 2MASS point source catalogue. As our relatively isolated standards in the field show good agreement with 2MASS, we do not think the difference in pulsar magnitudes is due to an offset in the zero-point. Instead, our measurements of the Crab pulsar agree well with previous time-resolved photometry of the Crab (Penny 1982; Ransom et al. 1994). Such measurements generally use a large aperture and simply assume any non-varying contribution to be due to the background. By integrating under the pulsar light curve, they measure only the pulsating contribution of the flux. Our ISAAC photometry has excellent signal and image quality. In the complex region around the pulsar, this significantly improves the background subtraction. In particular, PSF subtraction excludes contributions from the wisps and the nearby knot. We believe that the difference with 2MASS is simply a matter of resolution, and that we are now able to subtract virtually all background from the pulsar.
The 3-color image of the central parts of the Crab (Fig. 5) is color coded with s=blue, =green and s=red. In an attempt to keep some physical information in this image, the individual frames were scaled to make an object with a flat de-reddened Fν spectrum appear white.
This image shows the well known features of the inner Crab. The wisps are clearly visible in higher detail than previously obtained in the IR. Some filaments are also seen, most strongly in the s band. This is most likely due to the [Fe II] m emission line. The s band is instead dominated by amorphous synchrotron emission (Fig. 3). With suitable cuts the pulsar image appears slightly elongated. This is due to the presence of the knot first identified by Hester et al. (1995) on a HST image. To reveal this structure in our images we constructed and subtracted a PSF from the stellar images. After subtraction, the knot is clearly revealed in all three bands. A color image made out of the PSF subtracted frames is shown in Figure 6. The image directly gives the impression that the knot is redder than for example the wisps.
Quantifying this we have estimated the magnitudes of the knot as well as of the nearby wisp 1. The knot was measured within an aperture of 0.9 arcseconds and the wisp was simply measured with an aperture of 1.2 arcseconds. The spectral energy distribution of the knot is shown in Figure 4. It is clearly red. In the s-band the flux from the knot amounts to about of the flux of the pulsar. The stationary wisp appears to have a flatter spectrum in this regime.
3 Optical data from VLT and HST
To extend the wavelength region over which to derive the spectral characteristics of the inner Crab components, several optical images are available in the ESO and HST data archives.
The VLT PR image (Fig. 1) was taken with FORS2 on 10 November 1999, just two weeks after first light. On the five minute -band and the one minute -band exposures, we could PSF-subtract the pulsar to reveal the knot. The knot appears clearly in both frames, and amounts to a few percent of the pulsar light at these wavelengths.
Data on the Crab pulsar are also available in the HST archive. Most of the observations are from Jeff Hester’s comprehensive monitoring programme of the inner parts of the nebula, which has shown just how active the Crab nebula really is. These frames allow a detailed study of both the spectral and temporal properties of the knot. In August 1995 the region was observed in three filters (F300W, F574M, F814W). We measured the de-reddened spectral index for the knot to be , which agrees well with our IR data (Fig. 4).
Furthermore, a wealth of data in the F574M filter allows a study of the temporal behaviour (Figure 7). First of all we note that the knot is indeed present in all frames. It thus appears quasistationary for more than six years, although the position appears to vary at the 0.1 arcsecond level. The de-reddened flux of the knot (Fig. 4) is measured to be ergs s-1 cm-2 Hz-1 but variations of the flux by at least are observed.
4 Discussion and Implications
For the pulsar itself we have added new information in the IR. Together with the optical-UV data in Sollerman et al. (2000) this significantly revises the observational basis for the pulsar emission mechanism. In fact, most of the theoretical efforts have been based on the old optical data from Oke (1969) and the IR continuation of Middleditch, Pennypacker, & Burns (1983). Our new results call for a fresh look on the emission mechanism scenarios for young pulsars.
For the knot, we have shown that the structure is indeed quasi-stationary, and that the emission has a red spectrum. Few models are available for the knot. Lou (1998) presented a formation scenario in terms of MHD theory, while Shapakidze & Machabeli (1999) argue for a plasma mechanism. None of these scenarios predict a very red spectral distribution.
Another area where caution may be required is in the recent claims of weak and red off-pulse emission from the Crab pulsar in the visible (Golden, Shearer, & Beskin 1999). It is clear that the knot close to the pulsar has to be seriously considered in these kinds of studies.
5 Future plans
The Crab pulsar and its environment continue to be the prime astrophysical laboratory for the study of the pulsar emission mechanism and the spin-down powering of pulsar nebulae. Although much observational effort has been put into this object, a modern re-investigation is likely to clean up the many contradictory measurements. Optical imaging in good seeing would require only a few minutes with VLT, and would directly determine the knot-subtracted spectral energy distribution. ISAAC in the LW range can in less than 3 hours clarify if the knot is significantly contributing to the emission at these frequencies, and would establish if the IR drop of the pulsar is real.
Most interesting is the possibility to monitor the very central parts of the pulsar environment with NAOS/CONICA. With a resolution superseding HST we will be able to monitor the structures close to the pulsar, with 2 pixels corresponding to merely 50 AU. This would provide an unique opportunity to study the structure and dynamics of the inner pulsar wind and its interaction with the surroundings.
References
-
Eikenberry, S. S., Fazio, G. G., Ransom, S. M., Middleditch, J., Kristian, J., & Pennypacker, C. R. 1997, ApJ, 477, 465
-
Golden, A., Shearer, A., & Beskin, G. M. 2000, ApJ, 535, 373
-
Hester, J.J, Scowen, P. A., Sankrit, R., et al. 1995, ApJ, 448, 240
-
Lou, Y.-Q. 1998, MNRAS, 294, 443
-
Middleditch, J., Pennypacker, C., & Burns, M. S. 1983, ApJ, 273, 261
-
Oke., J. B. 1969, ApJ, 158, 90
-
Penny, A. J. 1982, MNRAS, 198, 773
-
Ransom, S. M., Fazio, G. G., Eikenberry, S. S., Middleditch, J., Kristian, J., Hays, K., & Pennypacker, C. R. 1994, ApJ, 431, 43
-
Scargle, J. D. 1969, ApJ, 156, 401
-
Shapakidze, D. & Machabeli, M. 1999, ptep.proc, 371
-
Sollerman, J., Lundqvist, P., Lindler, D., et al. 2000, ApJ, 537, 861
-
Sollerman, J., Kozma, C., & Lundqvist, P. 2001, A&A, 366, 197