Optical spectroscopy of the M 15 intermediate velocity cloud ††thanks: Based on observations made with the Apache Point Observatory 3.5-m, U.S.A., Very Large Telescope, Chile, and William Herschel Telescope, La Palma, Spain.
We present echelle spectrograph observations in the Na D lines, at resolutions of 6.28.5 km s-1, for 11 stars located in the line-of-sight to the M 15 intermediate velocity cloud (IVC), which has a radial velocity of +70 km s-1 in the Local Standard of Rest. This cloud is a part of IVC Complex gp. The targets range in magnitude from =13.314.8. Seven of the observed stars are in the M 15 globular cluster, the remaining four being field stars. Three of the observed cluster stars are located near a peak in intensity of the IVC H i column density as observed at a resolution of 1 arcmin. Intermediate velocity gas is detected in absorption towards 7 stars, with equivalent widths in Na D2 ranging from 0.090.20Å, corresponding to log10( cm-2) 11.812.5, and Na i/H i column density ratios (neglecting the H ii component) ranging from (13)10-8. Over scales ranging from 30 arcsec to 1 arcmin, the Na i column density and the Na i/H i ratio varies by upto 70 per cent and a factor of 2, respectively. Combining the current sightlines with previously obtained Na i data from Kennedy et al. (1998b), the Na i/H i column density ratio over cluster sightlines varies by upto a factor of 25, when using H i data of resolution 21 arcmin. One cluster star, M 15 ZNG-1, was also observed in the Ca i (=4226.728Å) and Ca ii (=3933.663Å) lines. A column density ratio (Ca i)/(Ca ii) 0.03 was found, typical of values seen in the warm ionised interstellar medium. Towards this sightline, the IVC has a Na i/Ca ii column density ratio of 0.25, similar to that observed in the local interstellar medium. Finally, we detect tentative evidence for IV absorption in K i (=7698.974Å) towards 3 cluster stars, which have (K i)/(H i) ratios of 0.5310-9.
Key Words.:
ISM: clouds – ISM: abundances – ISM: individual objects: M 15 IVC – ISM: individual objects: Complex gp1 Introduction
Fine-scale structure in low velocity interstellar gas, over scales ranging from tens to hundreds of thousands of AU, has been found by many different workers using a variety of techniques, including observations of pulsars, globular clusters and binary stellar systems that act as tracers of the interstellar medium (e.g. Frail et al. 1994; Kennedy et al. 1998a; Andrews et al. 2001). The presence of this structure implies dense clumps of gas in otherwise diffuse sightlines, and large overpressures with respect to the interstellar thermal pressure of 3000 cm-3 K (Welty & Fitzpatrick 2001). Regardless of whether such clumps exist or are simply an illusion caused by geometric effects (Heiles 1997), the small-scale structures must be explained by any model of the interstellar medium.
For gas at intermediate and high velocities, fewer studies of small-scale structure exist, due to the difficulty in finding relatively bright, closely-spaced probe objects at distances greater than the absorbing material. One obvious location for probe stars is globular clusters. Hence Kerr & Knapp (1972) performed an absorption-line survey towards many such objects, in particular finding an intermediate-velocity cloud towards M 15, a globular cluster that lies at a distance of 10 kpc (Carretta et al. 2000). This cloud is a part of the IVC Complex gp (Wakker 2001), a cloud complex located in the line-of-sight towards the HVC Complex GP. Parts of Complex gp are likely to lie at a distance exceeding 0.8 kpc (Little et al. 1994). The distance towards the M 15 IVC is uncertain, although is likely to be less than 3kpc (Smoker et al. 2001). The study of parts of this cloud is the subject of the current paper.
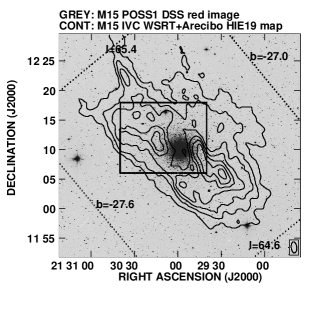
Previous optical observations of the M 15 IVC include low-resolution Ca ii K (=3933.663Å) and Na i D (=5889.950Å and =5895.924Å) absorption-line spectroscopy (Lehner et al. 1999) towards 12 cluster stars, which found that the equivalent widths of the IV component in Ca ii K range from 0.05 to 0.20 Å, although any variation from star-to-star appeared random and is close to the error in the measurement. Langer et al. (1990) also found variations in IVC Na i D equivalent widths of a factor 3 over the cluster face for a handful of stars. Fibre-optic array mapping in the Na i D absorption lines towards the cluster centre (Meyer & Lauroesch 1999) also found structure visible on scales of 4 arcsec at a velocity resolution of 16 km s-1. Using empirical relationships between the Na and H i column densities, Meyer & Lauroesch (1999) derived values of the H i column density towards the cluster centre of 51020 cm-2, which imply a volume density of 1000 cm-3. This compares with the IVC H i column density towards this point, at a resolution of 21 arcmin, of 41019 cm-2, measured by Smoker et al. (2002) using a combined Arecibo-Westerbork Synthesis Radio Telescope map. This H i map, shown in Fig. 1, demonstrates that the IV H i column density is actually quite small towards the cluster centre, with a stronger IV column density, still relatively near to the cluster centre, being at R.A. 21h29m40s, Dec. 12∘09′20′′. One of the aims of the current study is thus to determine the Na i column density (and variations over small scales), in areas of the IVC where the H i is strong. Additionally, the H i observations show indications of multicomponent structure in velocity, perhaps indicative of cloudlets. Hence it was decided to search for such structure using higher spectral resolution observations than those employed by Meyer & Lauroesch (1999).
Candidate stars were chosen from the simbad astronomical database where they are all listed as being cluster members. However, a-priori a radial velocity measurement was only available for about half of the stars, and, after analysis of the data, it was found that 4 of the objects were field stars in the line-of-sight towards M 15. The majority of the sample are listed in Battistini et al. (1985), although also included are the single objects KGSY 121 (Kadla et al. 1988), M 15 ZNG-1 (Zinn et al. 1972), and BRO 24 (Brown 1951). The locations of the sample stars are depicted in Fig. 2. Three cluster stars (group ‘A’ in Fig. 2) lie near a peak in the IVC H i column density, with four cluster stars (group ‘B’) at positions where the IVC H i column density is approximately half of this value.

2 Observations
The observations towards the M 15 IVC were taken during three sessions in June-August 2001, using echelle spectrometers mounted on the Apache Point Observatory 3.5-m (APO3.5), 8.2-m Very Large Telescope (UT2; Kueyen), and 4.2-m William Herschel telescope (WHT). The post-AGB star whose spectrum was obtained with the VLT, M 15 ZNG-1, was observed in order to obtain its stellar abundance (Mooney et al. 2002), with the interstellar absorption components described here being detected serendipitously. In order to determine the contribution from the night-sky spectrum to the observed data, frequent observations of rapidly-rotating B-type stars were taken which acted as the telluric standards. For the APO3.5 and WHT observations, arc line spectra were taken frequently during the night, and hence the derived velocities are accurate to better than 0.5 km s-1, being 3 times the root mean square error on the polynomial fit to the arc-line wavelength calibration. For the VLT-observed star, arcs were only taken at the start and end of each night, thus the wavelength accuracy depends on the stability of the spectrometer. The stellar sample and observing details are listed in Table 1.
| Star | R.A. | Dec. | Tel./Instr. | Obs. Date | Res. | Time | SNR | M 15 | ||
|---|---|---|---|---|---|---|---|---|---|---|
| hhmmss.s | ′ ′′ | (mag.) | (km s-1) | (s) | (cm-2) | star? | ||||
| BBFP 493 | 212942.2 | +120814 | 14.27 | APO/ARC | 9 Jun 2001 | 8.5 | 1400 | 30 | 12 | No |
| BBFP 456 | 212943.8 | +120833 | 14.46 | APO/ARC | 9 Jun 2001 | 8.5 | 3000 | 45 | 13 | Yes |
| BBFP 394 | 212944.2 | +120917 | 13.61 | APO/ARC | 9 Jun 2001 | 8.5 | 1400 | 40 | 14 | No |
| BBFP 438 | 212945.8 | +120845 | 13.81 | APO/ARC | 8 Jun 2001 | 8.5 | 4285 | 45 | 12 | Yes |
| BBFP 437 | 212947.9 | +120845 | 13.83 | APO/ARC | 9 Jun 2001 | 8.5 | 1800 | 30 | 11 | Yes |
| BBFP 442 | 212950.0 | +120843 | 12.66 | WHT/UES | 4 Aug 2001 | 6.8 | 6000 | 40 | 8 | No |
| BBFP 39 | 212954.9 | +121323 | 12.83 | WHT/UES | 2 Aug 2001 | 6.2 | 2400 | 45 | 6 | Yes |
| BBFP 67 | 212955.6 | +121242 | 13.44 | WHT/UES | 2 Aug 2001 | 6.2 | 2400 | 30 | 6 | Yes |
| KGSY 121 | 212956.2 | +121234 | 13.02 | WHT/UES | 2 Aug 2001 | 6.2 | 2400 | 35 | 6 | Yes |
| M 15 ZNG-1 | 212958.1 | +121144 | 14.80 | VLT/UVES | 3 Jul 2001 | 7.5 | 21600 | 80 | 5 | Yes |
| BRO 24 | 213038.0 | +121709 | 13.3 | WHT/UES | 2 Aug 2001 | 6.2 | 3600 | 40 | 5 | No |
| Star | (D2) | EWstar(D2) | EWIVC(D2) | log(D2) V, D | (D2) V | ||
|---|---|---|---|---|---|---|---|
| Group | (km s-1) | (D1) | EWstar(D1) | EWIVC(D1) | log(D1) V, D | (D1) V | |
| (km s-1) | (mÅ) | (mÅ) | (log10( cm-2)) | (km s-1) | () | ||
| BBFP 493 | 243 | – | – | 50 | 11.48, – | – | 0.3 |
| (A) | – | – | – | –, – | – | – | |
| BBFP 456 | 92.60.5 | +68.40.3 | – | 15030 | 12.13, 12.00 | 3.50.8 | 1.0 |
| (A) | +68.30.3 | 13615 | 15030 | 12.33, 12.26 | 5.40.6 | 1.6 | |
| BBFP 394 | 27.51.0 | – | – | 40 | 11.35, – | – | 0.2 |
| (A) | – | – | – | –, – | – | – | |
| BBFP 438 | 99.00.5 | +66.20.2 | – | 19030 | 12.30, 12.25 | 5.60.3 | 1.7 |
| (A) | +65.90.1 | 19318 | 20020 | 12.55, 12.50 | 5.50.3 | 3.0 | |
| BBFP 437 | 102.30.5 | +68.50.4 | – | 20020 | 12.27, 12.24 | 5.70.5 | 1.7 |
| (A) | +68.10.4 | 21320 | 19030 | 12.56, 12.47 | 5.30.6 | 3.3 | |
| BBFP 442 | +195 | – | – | 35 | 11.33, – | – | 0.3 |
| (A) | – | – | – | –, – | – | – | |
| BBFP 39 | 100.00.5 | +63.70.4 | 25112 | 976 | 12.000.03, 12.020.03 | 4.80.3 | 1.7 |
| (B) | +64.30.3 | 23012 | 939 | 12.060.04, 12.090.04 | 5.30.4 | 1.9 | |
| BBFP 67 | 101.00.5 | +63.00.3 | 22614 | 13112 | 12.020.04, 11.930.04 | 3.60.2 | 1.7 |
| (B) | +63.40.4 | 22214 | 768 | 11.980.05, 11.940.05 | 4.00.4 | 1.6 | |
| KGSY 121 | 96.50.5 | +61.00.3 | 25613 | 12910 | 11.990.03, 12.000.03 | 4.70.4 | 1.6 |
| (B) | +60.90.3 | 24515 | 796 | 12.060.03, 12.030.03 | 3.70.4 | 1.9 | |
| M 15 ZNG-1 | 100.01.0 | +64.40.2 | – | 875 | 11.800.04, 11.790.04 | 3.80.4 | 1.3 |
| (B) | +63.50.3 | 214 | 434 | 11.790.04, 11.790.04 | 3.70.4 | 1.2 | |
| BRO 24 | +225 | – | – | 35 | 11.33, – | – | 0.4 |
| – | – | – | – | –, – | – | – |
| Transition | EW | (log10( cm-2)) V, D | V | ||
|---|---|---|---|---|---|
| (km s-1) | (km s-1) | (mÅ) | (km s-1) | ||
| Ca ii K (3933Å) | 100.01.0 | 52.70.6 | 61 | 11.160.07, – | 0.64.0 |
| 64.90.1 | 1224 | 12.400.02, 12.360.02 | 5.30.2 | ||
| Ca i (4226Å) | – | 20 | 10.9, – | – |
3 Data reduction and analysis
The APO3.5 and WHT data were reduced using standard methods within iraf111 iraf is distributed by the National Optical Astronomy Observatories, U.S.A.. This included debiasing, wavelength calibration and extraction of the individual orders using doecslit. No flatfielding was performed. For the APO3.5 observations, the limited height of the slit (3.0 arcsec) precluded sky subtraction, and hence we performed a single 750-s exposure on the dark sky to estimate the contribution of the full moon to the night sky brightness. This added between 1020 per cent to the continuum level for our targets, and was subtracted before the extraction was performed.
For the VLT-observed star, we used data products obtained from the pipeline-calibration which includes wavelength calibration, sky subtraction and flatfielding. The extracted spectra were imported into dipso (Howarth et al. 1996), shifted to the Dynamical Local Standard of Rest (LSR) using values obtained from the starlink programme rv (Wallace & Clayton 1996), and normalised by fitting low-order polynomials to the continuum. The radial velocities of the stars were determined by use of the two stellar Na D lines for the cluster objects, and where possible using Ca i (=6717.681Å) for the field stars, with the exception of M 15 ZNG-1 for which we used the Si iii features (=4552.622Å, 4567.840Å). The broader H and H lines were used as a check on the derived velocity. Finally, the normalised spectra were analysed using both the apparent optical depth (AOD) method (Savage & Sembach 1991) and standard Voigt profile fitting within dipso using the elf and is programs, for which we used oscillator strengths of 0.6340, 0.318, 0.6306 and 0.33919 for the Ca K, Na D1, Na D2 and K i (=7698.974Å) lines, respectively (Welty et al. 1999). The derived fits were convolved with an instrumental -value of 0.6006 times the FWHM shown in Table 1. The errors on the derived equivalent widths (EWs) were estimated from a combination of the baseline uncertainty plus the photon noise, and those on the column densities from the EW error, assuming a linear curve of growth.
4 Results
Figures 3 and 5 show the Na D spectra towards the 11 sample stars. Inspection of the telluric spectra indicate that the only possible contaminating features caused by atmospheric absorption are at 5896.46Å and 5893.83Å, which have equivalent widths of 5 mÅ, compared to 90200 mÅ for the IV Na D2 equivalent widths. Additionally, for both the APO3.5 and WHT spectra, there is some narrow emission present at the wavelengths of the Na D doublet (5889.950Å and 5895.924Å), presumably caused by street lights. This ranged in LSR velocity from +20 to +35 km s-1, so was just far enough removed in velocity so as not to contaminate the IV absorption-line at 65 km s-1.
The spectra are composite, and in 7 cases show a stellar component at 100 km s-1, low-velocity (LV) components centred upon 0 km s-1 and intermediate-velocity (IV) components at +6070 km s-1. Velocities of the M 15 cluster stars range from 93 to 102 km s-1, and, at their radial distance from the centre, are each within the range of velocities observed towards M 15 by Drukier et al. (1998): the cluster having a mean LSR velocity of 97.1 km s-1 and velocity dispersion that changes with distance from the centre. For the M 15 cluster stars (excepting M 15 ZNG-1, which is a pAGB), we measure Na i D1 equivalent widths of between 140 and 250 mÅ, corresponding to AF spectral types (Gratton & Sneden 1987; Jaschek & Jaschek 1987).
Tables 2 and 3 show the results of the profile-fitting to the IV interstellar spectra for the Na D and Ca K lines, respectively. This yields the central velocities, -values and column densities of the IV components. For the three cluster stars in group ‘A’ (near a peak in the IVC H i column density), the derived column densities in the Na D1 line are 0.25 dex higher than those obtained for the Na D2 line, indicating that saturation is occurring in these sightlines, and that the derived column densities are lower limits.
Towards the non-detections, we estimated a 10 limiting equivalent width that would be detected using the current data, EWlim, thus;
| (1) |
where is 1/(continuum signal-to-noise ratio) and is the instrumental full width half maximum (FWHM) in Å. The limiting values of the Na i column densities were estimated by using the EWlim values estimated above, and -values corresponding to the nearest star for which there were an IV gas detection, assuming that we are on the linear part of the curve of growth. Towards M 15 ZNG-1, the above equation was also used to derive upper limits to the column densities of Fe i (=3859.9111Å), Al i (=3944.0060Å) and K i (=4044.143Å). The 10 upper limits of log10( cm-2) of these species of 12.6, 11.9 and 13.1 are high, and are not discussed further in this paper.
Figure 4 shows the K i spectra of the five stars observed with the APO3.5 (the other two observing runs not covering this wavelength region). In three of the sightlines, there are indications of IV absorption in K i. Although the signal-to-noise of the data are low, we believe that the intermediate-velocity absorption detected towards the cluster stars is likely to be interstellar in nature because; (1) There are no telluric features at the same wavelength as the IV absorption, either in the two field stars or telluric standards; (2) The features are unlikely to be stellar because the centres of two nearby lines (blueshifted by the stellar velocity) of Nb i (=7703.33Å) and Cl i (=7702.829Å) would be more than 4 km s-1 away from the IV absorption peak (at least for the stars BBFP 438 and BBFP 456); (3) The FWHM velocity widths of the IV absorption of 710 km s-1 (uncorrected for instrumental broadening: the components are unresolved) are somewhat narrower than the Na D1 stellar profiles which have uncorrected FWHM velocity widths from 1316 km s-1. As a species, K i tends to have narrow velocity components, the median width FWHM of 54 Galactic sightlines observed by Welty & Hobbs (2001) being 1.2 km s-1. Equivalent widths, velocities, and column densities of the IV K i components are shown in Table 4.


| BBFP 437 | BBFP 438 | BBFP 456 | |
| (km s-1) | 68.71.0 | 67.00.5 | 66.61.0 |
| EWIVC (mÅ) | 288 | 185 | 248 |
| log10() | 11.200.30 | 11.100.30 | 11.150.30 |
| (10-9) | 1.4 | 1.0 | 1.1 |
5 Discussion
5.1 The distance to the M 15 IVC
We note that in principle the fact that we have obtained non-detections towards 4 field stars in Na D could enable us to determine a lower-distance limit to this part of the IVC, if the distances to the objects were known. Of the three field stars, two (BBFP 394 and BBFP 493), have magnitudes in the range delineated by the cluster stars in the current paper (see Buonanno et al. 1983), with BBFP 442 being towards the bright end of the cluster star magnitude range (=12.46). The ( and colours of the field stars are 0.20.3 mag and 0.20.6 mag. bluer, respectively, than the median values for our sample of cluster stars. With the current data, due to the difficulty in ascribing a luminosity class for the field stars, we have not estimated their distances. Additionally, we note that a recent compilation of IVC and HVC Na D column densities by Wakker (2001) has indicated that to be sure of detecting an interstellar absorption in Na D towards an IVC with =1019 cm-2, a signal-to-noise ratio (SNR) exceeding 10002000 is required. Hence, even though the IV H i column densities exceed 1020 cm-2 towards three of our field-star sightlines, the observed SNRs of 3040 in the stars without an IVC detection preclude us from making any statements about the distance to this part of the IVC.
5.2 Two-component velocity structure
The presence of two-component velocity structure in IVCs and HVCs indicates the presence of cloudlets, collisions between which have been postulated as a mechanism for star formation in the halo of the Galaxy (Dyson & Hartquist 1983, although see Christodoulou et al. 1997 and Ramspeck et al. 2001). One of our observed stars, BRO 24, was chosen as a target as it lies near to a position in the IVC H i map where there are indications of two-component structure (Smoker et al. 2002). Unfortunately, this star turned out to be a field star. However, towards the object M 15 ZNG-1, we did detect two components (at +53 and +64 km s-1), in both Ca K and Na D, depicted in Fig. 5, indicating overlapping velocity components in the line-of-sight.

5.3 Na i and H i column densities and small-scale variations
Wakker (2001) has summarized the presently-existing absorption-line data for all species reported towards H i clouds, finding that, for LV gas, there is a mean Na i/H i column density ratio of 510-9, but with a large range exceeding a factor of 10. Some IVCs (such as the LLIV arch) have similar values to this mean, with others, such as previous measurements towards the M 15 IVC (Complex gp) showing somewhat higher values, ranging from (10160)10-9 (Langer et al. 1990; Kennedy et al. 1998b; Meyer & Lauroesch 1999). The Na i/H i column density ratios for the current dataset (based upon H i data of resolution 12 arcmin), vary from (13)10-8, and by as much as a factor of 2 in sightlines only separated by 30 arcsec.
Towards the 7 M 15 cluster stars, we derive logarithmic column densities ( in cm-2), log10(), of between 11.812.5, the latter value being a lower limit due to saturation. This corresponds to a factor 6 variation in column density between parts of group ‘A’ and ‘B’, which compares to a variation in Na i IVC column density of 16 over less than an arcminute towards the centre of the cloud (Meyer & Lauroesch 1999).
For the ‘A’ group of 3 stars, within the errors, two (BBFP 437, 438) have the same value of Na i column density, with BBFP 456 (separated by 30′′ from BBFP 438), having a value 70 per cent lower than the other two. A rough estimate of the volume density can be made using these data. Assuming that the IVC is at a distance of 1 kpc, the separation between BBFP 456 and the other two stars is 0.15 pc and the approximate transverse cloud size at full width half maximum column density is thus 0.3 pc. Following Shaw et al. (1996) and Kennedy et al. (1998b), if this part of the cloud is spherically symmetric, and assuming a (Na i)/(H i) ratio of 410-9 appropriate to high-latitude clouds (Ferlet et al. 1985), the resulting volume density for log(Na i cm-2))=12.55 is 1000 cm-3. Clearly if there is sheet-like structure in the IVC, this volume density is an upper limit, and hence we emphasize that given the difficulty in determining the (Na i)/(H i) ratio and unknown cloud geometry, this implied volume density is very uncertain.
Within the ‘B’ group, three of the stars display similar Na i column density values, apart from M 15 ZNG-1, which is deficient by 50 per cent, being separated by 1 arcmin from its closest observed companion, KGSY 121. Towards the stars ARP IV-38 and ARP II-75 (Arp 1955), Kennedy et al. (1998b) found (Na i) values of 1.61012 cm-2 and 2.51013 cm-2. Using our IVC H i data of resolution 21 arcmin, these correspond to (Na i)/(H i) values of 410-8 and 2.510-7, respectively. The latter value is some 25 times greater than observed towards M 15 ZNG-1 and is typical of large variations (often exceeding a factor of 10) that can occur in IVCs/HVCs (Wakker 2001). Possible reasons for this are discussed in Meyer & Lauroesch (1999).
5.4 Cloud conditions towards the M 15 ZNG-1 sightline
Towards the PAGB star M 15 ZNG-1, the H i column density observed at a resolution of 21 arcmin is =51019 cm-2. Our echelle data of SNR 80 cover Ca i (=4226.728Å), Ca ii K and the Na i D lines, thus providing some information on the properties of the IV gas by use of these unsaturated features. We determine logarithmic column density values for Ca ii, Ca i and Na i of 12.4, 10.9 and 11.8, respectively. The Ca i/Ca ii column density ratio is 0.03. We note that this value is consistent with the composite standard model of the photoionised warm interstellar medium of Sembach et al. (2000) (their Table 5), that gives the ionisation fraction Ca i/Ca ii 0.02.
Our derived value of (Ca ii)/(H i) 510-8 for the IVC is within the range found for the high Galactic latitude clouds studied by Albert et al. (1993), namely (0.3–30)10-8 cm-2. However, using the observed H i column density in combination with the correlation plot of the Ca ii abundance against H i column density for IVCs/HVCs from Wakker & Mathis (2000), a predicted Ca ii column density of 110-8 cm-2 is obtained. This is 5 times smaller than the observed value. Our derived value of (Ca ii)/(H i) 510-8 implies a depletion of 1.6, given a Solar calcium abundance of 2.1010-6 and assuming that Ca ii is the dominant ionisation species. However, the model of the photoionised warm interstellar medium of Sembach et al. (2000), predicts that the Ca ii/Ca iii fraction is 0.26. This implies that the Ca iii ion is likely to be dominant, particularly as the detection of H emission from the cloud (Smoker et al. 2002) indicates that the gas is partially ionised (although perhaps by collisions and not photoionisation; Sembach 1995).
The (Na i)/(H i) ratio of 1.310-8 towards this sightline compares with the value derived using the correlation for IVCs/HVCs from Wakker & Mathis (2000) of 0.710-8. Combined with the Ca result, this again indicates that this part of Complex gp has high ratios of these elements with respect to H i when compared with other HVCs and IVCs (c.f. Wakker 2001). Part of this ‘overabundance’ may be due to the fact that the cloud is partially ionised: Smoker et al. (2002) find that the M 15 IVC has an H flux exceeding 1 Rayleigh, which, using a reasonable value for the size of the cloud and the calculated emission measure, produces a H ii/H i ratio of 12, where is the filling factor of H ii in the IVC.
Towards this sightline, the IVC Na i/Ca ii column density ratio is 0.250.03. Within the interstellar medium, the range of observed values is from 0.1100; high ratios being found in dense, cold clouds where Ca is depleted onto dust, and low values occurring in the local warm interstellar medium, where heating of dust grains, for example by shocks, causes grain destruction and a mean Na i/Ca ii ratio of 0.22 (Bertin et al. 1993). In the local ISM, some 1525 per cent of H i clouds with anomalous velocities exceeding 20 km s-1 show such low ratios (see Bertin et al. 1993 and references therein). Grain destruction by shocks is consistent with the observation of strong H emission, perhaps caused by collisional ionisation. However, grain destruction does not appear to be total, as Smoker et al. (2002) showed that the 60 IRAS map and IVC H i column density map show spatial correspondence, tentatively indicating the presence of some dust in the M 15 IVC. Additionally, large variations in the Na i/Ca ii ratio have been found to occur in components separated by only a few km s-1, and hence Welty et al. (1996) caution against using this ratio as an indicator of either cloud physical conditions or calcium depletions.
5.5 Tentative K i detections
There are few observations of K i (=7698.974Å) in IVCs and HVCs (Wakker 2001). Because of its relatively low abundance compared with Ca or Na, combined with a low ionisation potential, K i is normally used to probe relatively dense and cool areas of the interstellar medium. Radio-line H i observations towards the peaks of the M 15 IVC imply upper limits to the kinetic temperature (in the absence of turbulence and averaged over 1 arcmin squared) of less than 500 K (Smoker et al. 2002), and H i column densities exceeding 1020 cm-2. Hence a priori there was some hope that K i would be detected, given the fact that Na and Ca are relatively abundant in the cloud.
The only previously-known detections of K i in IVCs are towards SN 1993J (Vladilo et al. 1994) and towards the M 15 IVC by Kennedy et al. (1998b). The latter found log10((K i) cm-2) 11.4 for the cluster star M 15 ARP II-75. Using our high-resolution H i map, which has (H i) 11020 cm-2, this corresponds to (K i)/(H i) 2.510-9. Towards another cluster star, M 15 ARP II-38, towards which our H i IVC column density map has (H i) 41019 cm-2, Kennedy et al. (1998b) obtained an upper limit to log10((K i) cm-2) 10.6, or (K i)/(H i) 110-9.
These results are similar to our K i/H i column density ratios of 0.5310-9 (taking into account the large uncertainty in the measurements) for three closely-spaced stars. Based on the uncertainty in our IVC K i detections, we choose not to over-interpret our results. However, we note that both the current data, and that of Kennedy et al. (1998b), display (K i)/(H i) values more than 10 times greater than (K i)/(Htot) ratios (where (Htot)=H i + 2 H2) observed towards Galactic sightlines (Fig. 17 of Welty & Hobbs 2001). This may be due to a combination of different halo/disc depletions for K, ionisation of the H i in the IVC (and possible H2 content?), and the fact that our H i value is derived from data of poorer spatial resolution than the K i data. Finally, we note that the N(K i)/N(Na i) values are less than 3 times as large in the IVC as compared with the Galactic results of Welty & Hobbs (2001), indicating that the high (K i)/(H i) value may be caused by one of the factors listed above.
6 Summary and Conclusions
At a resolution of 6.28.5 km s-1, we have observed absorption in Na i D at intermediate velocities towards 7 stars within the globular cluster M 15. One of these sightlines was also observed in Ca ii K, and three in K i. The Na i and Ca ii to H i column density ratios lie within the range previously observed in high latitude clouds, although both are in the upper echelons of the observed distribution for IVCs and HVCs, perhaps partly caused by ionisation of H. Variations in the Na i column density of between 0 to 70 per cent towards the IVC have been detected on scales of 30 arcsec (or 0.15pc, assuming a cloud distance of 1 kpc). Over the whole cloud, the Na i/H i column density ratio varies by as much as a factor of 25.
The Na i/Ca ii column density ratio of 0.25 is typical of gas in the local warm interstellar medium. This, and the presence of strong H emission towards this sightline, raises the possibility that shock ionisation and grain destruction is occurring in the IVC, although the presence of weak IRAS flux implies that grain destruction is not total. Three cluster stars also show tentative detections of K i (7698.974Å), with (K i)/(H i) ratios of 0.5310-9.
Future observations should concentrate on determining the distance to this part of IVC Complex gp, via spectroscopy of field stars located towards regions of strong IVC H i column density. Towards the H i peaks, a signal-to-noise exceeding 20 in Ca K would be sufficient at a 10 level to interpret a non-detection as being a lower-distance limit, allowing for a factor of 5 variation in the (Ca ii)/(H i) ratio and with a resolution of 0.1Å. Finally, UV observations towards the IVC would much better constrain the gas parameters in the IVC. Although the faintness of the M 15 stars precludes this with currently-existing space-based facilities, progress may be possible using the planned Cosmic Origins Spectrograph on the Hubble Space Telescope.
Acknowledgements.
Based on observations obtained with the Apache Point Observatory 3.5-meter telescope, which is owned and operated by the Astrophysical Research Consortium, U.S.A., the William Herschel Telescope, operated by the Isaac Newton Group of Telescopes, La Palma, Spain, and at the European Southern Observatory, Cerro Paranal, Chile (programme ID 67.D-0010A). We would like to thank an anonymous referee for useful comments. JVS is grateful to pparc for financial support and starlink for providing computer facilities.References
- (1) Albert, C. E., Blades, J. C., Morton, D. C., et al. 1993, ApJS, 88, 81
- (2) Andrews, S. M., Meyer, D. M., & Lauroesch, J. T. 2001, ApJ, 552, 73
- (3) Arp, H. C. 1955, AJ, 60, 317
- (4) Bertin, P., Lallement, R., Ferlet, R., & Vidal-Madjar, A. 1993, A&A, 278, 549
- (5) Battistini, P., Bregoli, G., Fusi Pecci, F., Lolli, M., & Epps Bingham, E. A. 1985, A&AS, 61, 487
- (6) Brown, A. 1951, ApJ, 113, 344
- (7) Buonanno, R., Buscema, G., Corsi, C. E., Iannicola, G., Fusi-Pecci, F. 1983, A&AS, 51, 83
- (8) Carretta, E., Gratton, R. G., Clementini, G., & Fusi Pecci, F. 2000, ApJ, 533, 215
- (9) Christodoulou, D. M., Tohline, J. E., & Keenan, F. P. 1997, ApJ, 486, 810
- (10) Drukier, G. A., Slavin, S. D., Cohn, H. N., et al. 1998, AJ, 115, 708
- (11) Dyson, J. E., & Hartquist, T. W. 1983, MNRAS, 203, 1233
- (12) Ferlet, R., Vidal-Madjar, A., & Gry, C. 1985, ApJ, 298, 838
- (13) Frail, D. A., Weisberg, J. M., Cordes, J. M., & Mathers, C. 1994, ApJ, 436, 144
- (14) Gratton, R. G., Sneden, C. 1987, A&AS, 68, 193
- (15) Heiles, C. 1997, ApJ, 481, 193
- (16) Howarth, I. D., Murray, J., Mills, D., & Berry, D. S. 1996, starlink, User Note SUN 50, Rutherford Appleton Laboratory/CCLRC
- (17) Jaschek, C., & Jaschek, M. 1987, The classification of stars, Cambridge University Press
- (18) Kadla, Z. I., Gerashchenko, A. N., Strugatskaya, A. A., & Iablokova, N. V. 1988, Izv. Glav. Astron. Obs., 205, 114
- (19) Kennedy, D. C., Bates, B., & Kemp, S. N. 1998a, A&A, 336, 315
- (20) Kennedy, D. C., Bates, B., Keenan, F. P., et al. 1998b, MNRAS, 297, 849
- (21) Kerr, F. J., & Knapp, G. R. 1972, AJ, 77, 354
- (22) Langer, G. E., Prosser, C. F., & Sneden, C. 1990, AJ, 100, 216
- (23) Little, J. E., Dufton, P. L., Keenan, F. P., Conlon, E. S., & Davies, R. D. 1994, ApJ, 427, 267
- leh (99) Lehner, N., Rolleston, W. R. J., Ryans, R. S. I., et al. 1999, A&AS, 134, 257
- (25) Meyer, D. M., & Lauroesch, J. T. 1999, ApJ, 520, 103
- (26) Mooney, C. J., Rolleston W. R. J., Keenan F. P., et al. 2002, submitted to MNRAS
- (27) Ramspeck, M., Heber, U., & Moehler, S. 2001, A&A, 378, 907
- (28) Savage, B. D., & Sembach, K. R. 1991, ApJ, 379, 245
- (29) Sembach, K. R. 1995, ApJ, 445, 314
- (30) Sembach, K. R., Howk, J. C., Ryans, R. S. I., & Keenan F. P. 2000, 528, 310
- (31) Shaw, C. R., Bates, B., Kemp, S. N., et al. 1996, ApJ, 473, 849
- (32) Smoker, J. V., Lehner, N., Keenan, F. P., et al. 2001, MNRAS, 322, 13
- (33) Smoker, J. V., Haffner, L. M., Keenan, F. P., Davies, R. D., & Pollacco D. L. 2002, MNRAS, submitted
- (34) Vladilo, G., Centurion, M., de Boer, K. S., et al. 1994, A&A, 291, 425
- (35) Wakker, B. P., & Mathis, J. S. 2000, ApJ, 544, 107
- (36) Wakker, B. P. 2001, ApJS, 136, 463
- (37) Wallace, P., & Clayton, C. 1996, RV, starlink, User Note SUN 78, Rutherford Appleton Laboratory/CCLRC
- (38) Welty, D. E., Morton, D. C., & Hobbs, L. M. 1996, ApJS, 106, 533
- (39) Welty, D. E., Hobbs, L. M., Lauroesch, J. T., et al. 1999, ApJS, 124, 465
- (40) Welty, D. E., & Hobbs, L. M. 2001, ApJS, 133, 345
- (41) Welty, D. E., & Fitzpatrick, E. L. 2001, ApJ, 551, 175
- (42) Zinn, R. J., Newell, E. B., & Gibson J. B. 1972, A&A, 18, 390