Can Any “Invariants” Be Revealed in Quasi-periodic Phenomena Observed From Sco X-1?
Abstract
Using large number of Rossi X-ray Time Explorer observations of Sco X-1 we present a detailed investigation of the transition layer (TL) and the relativistic precession (RP) models. These models predict the existence of the invariant quantities: an inclination angle of the magnetospheric axis with the normal to the disk for the TLM and a neutron star (NS) mass for the RPM. Theoretical predictions of both models are tested and their self-consistency is checked. We establish that: (i) The inferred value is . Correlation of the values with the horizontal branch oscillation (HBO) frequency is rather weak. (ii) There is a strong correlation between an inferred and the HBO frequency in the RPM frameworks. (iii) We infer for different assumptions regarding the relations between the HBO frequency and the nodal frequency . We find that the inferred cannot be consistent with any EOS of NS matter. We conclude that RPM fails to describe the data while TLM seems to be compatible.
Received 2002 February 25; Accepted 2002 April 19 \journalinfoThe Astrophysical Journal, 571:L000, 2002 June 1
1 Introduction
Kilohertz quasi-periodic oscillations (QPOs) have been discovered by the Rossi X-ray Timing Explorer (RXTE) in a number of low mass X-ray binaries (Strohmayer et al. 1996, van der Klis et al. 1996). The presence of two observed peaks with frequencies and in the upper part of the power spectrum became a natural starting point in modeling the phenomena. Attempts have been made to relate and and the peak separation with the neutron star (NS) spin. In the beat frequency model (Miller, Lamb & Psaltis 1998) the kHz peak separation is considered to be close to the NS spin frequency and thus is predicted to be constant. In other words is an “invariant” which does not vary when the kHz QPOs frequencies change. However observations of kHz QPOs in a number of binaries (Sco X-1, 4U 1728-34, 4U 1608-52, 4U 1702-429 and etc) show that the peak separation decreases systematically when kHz frequencies increases (see a review by van der Klis 2000, hereafter VDK). For Sco X-1 VDK found that the peak separation of kHz QPO frequencies changes from 320 Hz to 220 Hz when the low peak changes from 500 Hz to 850 Hz. The lower frequency part of the power spectrum, contains two horizontal branch oscillation (HBO) frequencies Hz and Hz (presumably the second harmonic of ) which slowly increase with increase of and (van der Klis et al. 2000). Any consistent model faces a challenging task of describing the dependences of the peak separation and HBO frequency on and .
1.1 QPO model description
There are two other QPO models in the literature which infer the relations between , and .
The transition layer model (TLM) was introduced by Titarchuk, Lapidus & Muslimov (1998), hereafter TLM98, to explain the dynamical adjustment of a Keplerian disk to the innermost sub-Keplerian boundary conditions (e.g. at the NS surface). TLM98 argued that a shock should occur where the Keplerian disk adjusts to the sub-Keplerian flow. It was suggested by Osherovich & Titarchuk (1999), hereafter OT99, that the radial oscillations of the fluid element that bounced from the disk shock region (presumably at the adjustment radius) would be seen as two independent oscillations in the radial and the vertical directions due to the presence of a Coriolis force in the magnetospheric rotational frame of reference. Simultaneous measurements of the frequencies of the two kHz QPOs and HBO harmonics in a wide frequency range allow one to derive the angle . Titarchuk & Osherovich (2001, hereafter TO01), claim that for the sources GX 340+0, Sco X-1, 4U 1702-42 and 4U 0614+09 the inferred angle , (see Eq 1 in TO01) stays the same over significant range of the observed QPO frequencies. The low branch frequency , the Kepler frequency and the hybrid frequency , as they are introduced by OT99 are eigenfrequencies of the oscillator. However these frequencies are revealed in the observations as the resonance frequencies , and which are broadened as a result of the (radiative) damping in the oscillator (see TLM98, Eq. 15). Furthermore, the resonance frequencies , , are shifted with respect to the eigenfrequencies , , . The frequency shift and random errors of the eigenfrequencies depend on the damping rate of oscillations (see details in §2). One should keep in mind that the systematic and random errors in the centroid frequency determination due to this resonance shift can be a factor of a few larger than the statistical error in the determination of the centroid frequency. In the present data analysis (as the first approximation) we assume that , and . We discuss the results of this analysis in §2.
The relativistic precession model (RPM) is related to high speed particle motion in strong gravitational fields, leading to oscillations of the particle orbits. Bardeen, Press & Teukolsky (1972), Okazaki, Kato & Fukue (1987), Kato (1990) and later Stella et al. (1999) studied precession of the particle orbit under influence of a strong gravity due to the GR effects. In order to generate these oscillations one should assume that the particle orbit is not precisely in the equatorial plane of the compact object. The inclination angle between the particle orbit plane and the equatorial plane can be infinitesimal. For a nonrotating configuration of the central body (in the Schwarzchild’s treatment) the angular velocity is calculated using a classical Kepler’s formula. In the general case, when the intrinsic angular momentum, the azimuthal frequency is expressed in units , as follows (Bardeen et al., 1972; Stella et al., 1999)
| (1) |
Hereafter, we consider a corotating neutron star and a probe particle, namely with and . An epicyclic frequency along with determine the orbital periastron rotation . A precession frequency of the node line is calculated using and a frequency of oscillations in the direction which is perpendicular to the orbital plane, , namely . Formulas for and :
| (2) |
| (3) |
have been obtained by Okazaki, Kato, & Fukue (1987) and Kato (1990). In the framework of the RPM (e.g. Stella et al., 1999) a frequency of Keplerian rotation is related to the higher kHz peak , and a frequency of the periastron precession is related to a lower kHz peak 111In the Kerr’s geometry (for the Schwarzchild’s case with a dimensionless angular momentum these frequencies coincide ).. The HBO frequency is related to the nodal precession . Stella et al. (1999) proposed that can be an even harmonic of . Thus equations (1)-(2) allow one to find the neutron star mass and using the observable frequencies , and .
The goal of this Letter is to test the invariant predictions of the TLM and the RPM using extensive RXTE observations of QPO phenomena. The Letter reports the results of the detailed data analysis from Sco X-1 collected by RXTE during 4 years of observations from 1996 to 1999. In §2, we describe the RXTE data which we use to construct the power spectra in the frequency range from Hz to Hz. In §2 we also give details of the resonance effect on the eigenfrequency restoration using the observed QPO frequencies and present comparisons of the predictions of the QPO models with the RXTE observations. Summary and conclusions are drawn in §3.
2 Observations and Data Analysis
We used data of from the RXTE proportional counter array (PCA) instrument (Jahoda et al. 1996) retrieved from the high energy astrophysics archive of NASA/GSFC. Sco X-1 was observed by RXTE during 11 observations (10056, 10057, 10059, 10061, 20053, 20426, 30035, 30036, 30406, 40020, 40706) in 1996–1999. Data were collected from either energy channels 0-87 ( keV) or 0-249 ( keV) at resolutions of s or higher. For observations when “double-event” data222Two events detected within 6s at two different anodes of detector are due to charged particles and high count rate from very bright sources like Sco X-1. In this case the part of the source flux dominates in double-events data. were available, we combined them with single-event to increase statistics. We constructed the power density spectra (PDS) in the frequency range from 0.03125 Hz to 2048 Hz to analyze the Sco X-1 variability. The features of the low frequency and high frequency variability were investigated in the range Hz and Hz respectively. The PDS was fit by a constant (due to dead time effect, see details in Vihlinin et al. 1994) and a few Lorentzians to determine QPO frequencies and we added the following term to our model to approximate low-frequency noise component.
2.1 HBO frequencies and its harmonics
Among all analyzed spectra where a kHz QPO pair was detected we selected only those for which an HBO was detected as well and at a significance more than 4 . The second harmonic is present for nearly all of these . It is worth noting that the significance of the HBO peaks decrease with the frequency which is a well known effect for quite a few sources noted by VDK. Because of this, we cannot find HBO harmonics for HBO frequencies higher than 48 Hz ( Hz) with reliable level of significance. Ratio , on the average, is slightly below than 2, namely . The observational appearance of the HBO harmonics is presumably a combination frequency effect along with a resonance in weakly nonlinear oscillation system (Landau & Lifshitz 1965, hereafter LL).
2.2 Resonance effect
The resonance in weakly nonlinear systems occurs at the eigenfrequencies of the system when the frequency of the driving force is and , are integers (LL). The main peak resonance power (for and ) is the strongest among all the harmonics because the peak power diminishes very quickly with the increase of and (LL). The maximum of the main resonance amplitude for the linear and nonlinear oscillations is not precisely at the eigenfrequency , but rather it is shifted to the frequency . For a linear oscillator depends on the damping rate (see LL and and TLM98, Eq. 15 for the power of the forced oscillations), i.e. and thus the frequency shift
| (4) |
From Eq. (3) it follows that
when .
LL also shows that the half-width of the resonance curve
for .
Taking a differential from the left and right hand sides of the formula for
one can derive a formula for the random error of the eigenfrequency
determination due to the resonance effect:
.
Now one can estimate the ratio of the systematic shift and random
error to . They are and for
frequencies presented by Jonker et al. (2002) in Tables 2 and 4
333Jonker et al (2002) presented the analysis of the
of the TLM. They found that and
for GX 5-1 and GX 17+2 respectively. But
they pointed out the very large and
for GX 5-1 and GX 17+2 respectively. Their
calculations include the statistical error only but do not
account for the systematic resonance shift and for the random
resonance error ..
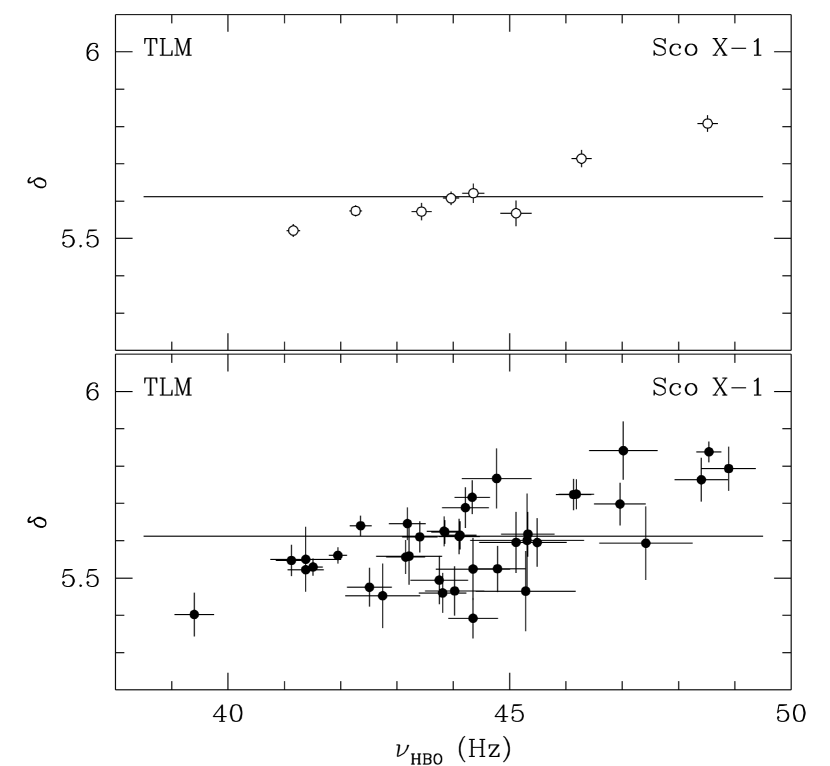
![[Uncaptioned image]](/html/astro-ph/0204456/assets/x2.png) Figure 2: Dependence of the inferred angle on the HBO frequency,
. Low
panel: for a particular observation with a duration 3 ks.
Upper panel: that presented in upper panel is averaged over 5 HBO
frequencies. The best fits of the values are shown by solid
lines.
We can conclude that Jonker’s et al. for the mean
would be significantly reduced if this effect were taken into account.
Figure 2: Dependence of the inferred angle on the HBO frequency,
. Low
panel: for a particular observation with a duration 3 ks.
Upper panel: that presented in upper panel is averaged over 5 HBO
frequencies. The best fits of the values are shown by solid
lines.
We can conclude that Jonker’s et al. for the mean
would be significantly reduced if this effect were taken into account.
In the nonlinear case the systematic and random shifts are also affected by the amplitude of the driving force and the relative weights (coefficients) of the nonlinear terms (LL). It is not by chance that our observed values of differ from 2, since the apparent observed resonance frequency is shifted with respect to the eigenfrequency . This realization is particularly important when one compares the observationally identified frequencies , and and those predicted by the QPO models. In order to lessen the uncertainty in determining the real eigenfrequency value as well as to decrease the systematic error caused by this nonlinear effect, we use two values for the low-frequency identification: and . The second value is a mean of , calculated using the main resonance frequency and the second harmonic frequency . The average PDS and the main frequencies (and also ), and were used for the analysis of the TLM and RPM.
2.3 Transition Layer Model (TLM)
For each set of , and we obtained the value using formula (1) in TO01, where , and are identified with , and respectively. In Figure 1 the dependence of the angle between a normal to the disk and a magnetospheric axis on is shown. We establish that the strongest dependence of on the QPO peak frequencies involves . Thus we investigated this dependence only. The model invariants should be kept the same, independent of the QPO frequency branch where it is verified. In Table 1 the approximation of by constant are present for two cases: (see Fig. 1 the lower panel) and (in the latter case the second harmonic is taken into account for determination). For each case we provide a reduced . The rms and the standard deviations are also present in Table 1. We repeated the same procedure for vs when . In Figure 1 these results are present. In order to reduce the possible stochastic scattering in the data, which always dominates relative to the statistical scattering, we implement an averaging of for a given HBO frequency (see the upper panel of Fig. 1). We repeated the same procedure for vs when . In Figure 2 these results are present. Whereas some correlation of vs are clearly seen in Figure 1, points are almost scattered along the horizontal line in Figure 2 (see the upper panel).
2.4 Relativistic Precession model (RPM)
Now we investigate the RPM invariant, the NS mass as a
function of or as a function of
. The deduced dependences of
on the HBO frequencies are stronger than for the kHz frequencies
(similar to the case with for the TLM). In Table 2 and in
Figs. 3–4 we present a mean value of , and
. It is seen that values are a factor of
3-6 bigger than that in Table 1 for . But the relative
deviation of , is also 2% as for
.
The linear correlation of the values on HBO frequencies
is clearly seen in Fig. 3 and gets even stronger for
(Fig. 4).
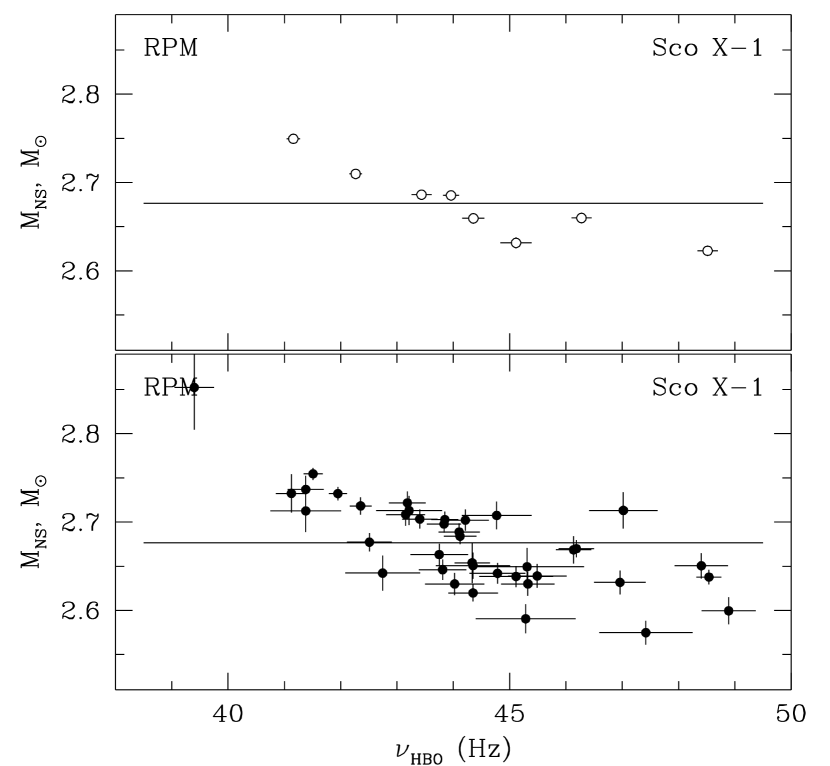
![[Uncaptioned image]](/html/astro-ph/0204456/assets/x4.png) Figure 4: Dependence of the inferred neutron star mass on the HBO frequency,
. The used data are the same as for Fig. 2.
Approximations by a constant and linear trend are shown by dashed and
solid lines respectively
drops from 2.8 to 2.6 with
increase of from 39.5 Hz to 46.5 Hz444As it is
expected from the probability theory, the statistical mean and the statistical deviation converge to the real values of
the mean and the standard deviation with increase of a number of
points for a given HBO frequency.. In RPM the mean are
scattered along the oblique line whereas in the TLM are
scattered along the horizontal line.
Table 1:
Parameter
5.6120.007
5.5450.006
5.53
2.94
5.6000.114
5.5550.086
0.567
0.359
210-4
310-2
, bins
39
39
0.738
0.595
3.710-2
1.210-1
, bins
8
8
See caption for Figs. 1-2: , is the best–fit
parameter,
Figure 4: Dependence of the inferred neutron star mass on the HBO frequency,
. The used data are the same as for Fig. 2.
Approximations by a constant and linear trend are shown by dashed and
solid lines respectively
drops from 2.8 to 2.6 with
increase of from 39.5 Hz to 46.5 Hz444As it is
expected from the probability theory, the statistical mean and the statistical deviation converge to the real values of
the mean and the standard deviation with increase of a number of
points for a given HBO frequency.. In RPM the mean are
scattered along the oblique line whereas in the TLM are
scattered along the horizontal line.
Table 1:
Parameter
5.6120.007
5.5450.006
5.53
2.94
5.6000.114
5.5550.086
0.567
0.359
210-4
310-2
, bins
39
39
0.738
0.595
3.710-2
1.210-1
, bins
8
8
See caption for Figs. 1-2: , is the best–fit
parameter,
2.5 Statistical evaluation of the suggested invariants for the TLM and the RPM
In order to check the consistency of the TLM and the RPM we use the Spearman’s non-parametric test for evaluation of the correlation of and with HBO frequencies. If the correlation coefficients , then there is a perfect linear correlation between two values. In the general case . For each case we also calculate a probability that the derived correlation is a result of the statistical fluctuations 555Particularly, this test is useful for comparison whether one of the correlations is stronger than another.. Table 2: Parameter 2.6800.002 2.6750.002 14.3 16.3 2.6770.050 2.6740.053 , cm 1.367 0.002 1.3580.002 8.2 13.7 , bins 39 39 -0.715 -0.789 310-7 210-9 -0.929 -1.000 8.610-4 0.0 , bins 8 8 See caption for Figs. 3-4: , , is best–fit parameter, .
From Table 2 it is seen that the RPM is inconsistent with data (, there is a perfect linear correlation between and ) and the proposed parameter is not invariant with respect to the observed QPO frequencies. It is worth noting that inclusion of the second HBO component into the determination of the HBO peak leads to a weakening of the correlation for vs HBO frequencies while the opposite effect is seen for the correlation between vs HBO frequencies. In Figs. 2, 4 it is shown that the averaging leads to a decrease in the scattering of the inferred parameters along the best-fit line. For the TLM (see Fig. 2) is practically a constant, with while for the RPM (Fig. 4) strongly correlates with and is inconsistent with a constant. It should be pointed out that in the Table 1 are affected by the aforementioned underestimation of the systematic and random resonance shift (see Introduction and §2.2). Thus, the is artificially high because it takes into account only statistical errors, and ignores this effect.
3 Conclusions
Using the thorough data analysis of RXTE data for Sco X-1 we have presented a detailed investigation of the transition layer (TL) and the relativistic precession (RP) models. These models predict the existence of the invariants: for the TLM and for the RPM. We establish that: (1) The inferred value is is consistent with a constant. Correlation of the values with the HBO frequency is rather weak. (2) There is a strong correlation between an inferred neutron star mass and HBO oscillation frequency in the RPM frameworks, (3) The inferred NS mass cannot be consistent with any EOS of NS matter.
We are grateful the referee for the useful suggestions and the valuable corrections. L.T. acknowledges the fruitful discussions with Chris Shrader, Charlie Bradshaw, Vladimir Krasnopolski and Paul Ray.
References
- Bardeen et al. (1972) Bardeen, J.M., Press, W.H., Teukolski, S.A. 1972, ApJ, 178, 374
- Jahoda et al. (1996) Jahoda, et. al. 1996, Proc. SPIE, 2808, 59
- Jonker et al. (2002) Jonker, P.J., et al. 2002, MNRAS, in press (astro-ph/0202420)
- Kato (1990) Kato, S. 1990, PASJ, 42, 99
- Landau & Lifshitz (1965) Landau, L.D. & Lifshitz, E.M. 1965, Mechanics, New York: Pergamon Press (LL)
- Miller et al. (1998) Miller, M.C., Lamb, F.K., Psaltis, D. 1998, ApJ 508, 791.
- Okazaki et al. (1987) Okazaki, T., Kato, S., & Fukue, J. 1987, PASJ, 39, 457
- Osherovich & Titarchuk (1999) Osherovich, V., & Titarchuk, L. 1999, ApJ, 522, L113 (OT99)
- Stella et al. (1999) Stella, G., Vietri, M., & Morsink, S.M. 1999, ApJ, 524, L66
- Strohmayer et al. (1996) Strohmayer, T.E., et al. 1996, ApJ, 469, L9
- Titarchuk, Lapidus & Muslimov (1998) Titarchuk, L.G., Lapidus, I.I. & Muslimov, A. 1998, ApJ, 499, 315 (TLM98)
- Titarchuk, & Osherovich (2001) Titarchuk, L., & Osherovich, V. 2001, ApJ, 555, L55
- van der Klis (2000) van der Klis, M. 2000, ARA&A, 38, 717
- van der Klis et al. (1996) van der Klis, et al. 1996, ApJ, 469, L1
- Vikhlinin et al. (1994) Vikhlinin, A., Churazov, E., & Gilfanov M. 1994, A&A, 287, 73