Measurement of the Solar Neutrino Capture Rate
by the Russian-American Gallium Solar Neutrino Experiment
During One Half of the 22-Year Cycle of Solar Activity
Abstract
We present the results of measurements of the solar neutrino capture rate in gallium metal by the Russian-American Gallium Experiment SAGE during slightly more than half of a 22-year cycle of solar activity. Combined analysis of the data of 92 runs during the 12-year period January 1990 through December 2001 gives a capture rate of solar neutrinos with energy more than 233 keV of (stat.) (syst.) SNU. This represents only slightly more than half of the predicted standard solar model rate of 128 SNU. We give the results of new runs beginning in April 1998 and the results of combined analysis of all runs since 1990 during yearly, monthly, and bimonthly periods. Using a simple analysis of the SAGE results combined with those from all other solar neutrino experiments, we estimate the electron neutrino flux that reaches the Earth to be /(cm2-s). Assuming that neutrinos oscillate to active flavors the neutrino flux emitted in the solar fusion reaction is approximately /(cm2-s), in agreement with the standard solar model calculation of /(cm2-s).
pacs:
26.65.+t, 96.60.-j, 95.85.Ry, 13.15.+gI Introduction
There has been outstanding progress in solar neutrino research in the last several years. The large water Cherenkov detectors SuperKamiokande (SK) KAM01 and the Sudbury Neutrino Observatory (SNO) MAC00 have begun to measure the high-energy solar neutrinos from 8B decay in real time with a high counting rate. The results from these two neutrino telescopes of a new generation add significant information to the existing results from the chlorine CLE98 and gallium ABD99 ; HAM99 radiochemical experiments and the Kamiokande experiment FUK96 . The elastic scattering results of SK combined with the charged current results from SNO indicate that, in addition to electron neutrinos, active neutrinos of other flavors are reaching the Earth from the Sun. The combined analysis of results of all these experiments gives convincing evidence that part of the electron neutrinos formed in thermonuclear reactions in the Sun change their flavor on their way to the Earth.
Further measurement of the details of flavor conversion for solar neutrinos requires a new generation of neutrino telescopes that will be sensitive to the spectrum below 2 MeV, a region that contains the proton-proton and CNO continua as well as the 7Be and lines. Although there are many promising ideas for real-time low-energy neutrino detectors LONU , at the present time only the radiochemical gallium experiments are able to measure and monitor this part of the solar neutrino spectrum. The 233-keV threshold of the reaction 71GaGe KUZ65 enables one to measure the neutrinos, the principal component of the solar neutrino spectrum. If we exclude exotic hypotheses, the rate of the reaction is directly related to the solar luminosity and is insensitive to alterations in the solar models that influence the subsequent reactions in the solar fusion chain.
The neutrino capture rate in 71Ga predicted by the Standard Solar Model (SSM) BAH00 is SNU, with the main contribution of 69.7 SNU from the neutrinos 1111 SNU = 1 interaction/s in a target that contains 1036 atoms of the neutrino absorbing isotope.. Contributions by 7Be and 8B neutrinos are 34.2 SNU and 12.1 SNU, respectively. The insensitivity of Ga to variation in the solar model is seen in the independently calculated result of 127.2 SNU TUR98 for the total capture rate.
From the results of the SNO and SK experiments we now have a high accuracy measurement of the 8B flux that reaches the Earth and its electron neutrino component. In the near future it is expected that the KamLAND experiment Kamland will greatly restrict the range of possible electron neutrino mixing parameters. This data, combined with results from the Borexino experiment Borexino , will give us a good measurement of the 7Be flux from the Sun. By subtracting the 7Be and 8B components from the total signal in the Ga experiment, we will obtain a measurement of a fundamental astrophysical parameter — the neutrino flux from the proton-proton fusion reaction. There will be a slight contamination from the CNO and neutrinos but this can be removed with the information from the Cl experiment. A rough estimate of the neutrino flux using the information that we have now is presented in the next to last section. Since in the immediate future only the Ga experiments provide this measurement, it is very important that both SAGE ABD99 and GALLEX’s successor GNO GNO00 continue to operate so as to improve the accuracy of their results.
The experimental layout and procedures, including extraction of germanium from gallium, counting of 71Ge, and data analysis, are described in detail in our article “Measurement of the solar neutrino capture rate with gallium metal” in Physical Review C ABD99 . That article gives the SAGE results for the period January 1990 through December 1997. Since it contains a complete description of the experiment and the analysis techniques, we refer the reader who wishes further detail to that publication. Here we briefly discuss the main principles of the experiment, give the statistical analysis of the data from 1998–2001, present new results for some systematic uncertainties, and conclude with the current implications of the SAGE result for solar and neutrino physics.
II Overview of the SAGE Experiment
II.1 The Laboratory of the Gallium Germanium Neutrino Telescope
The SAGE experiment is situated in a specially built deep underground laboratory GGNT at the Baksan Neutrino Observatory (BNO) of the Institute for Nuclear Research of the Russian Academy of Sciences in the northern Caucasus mountains. It is located 3.5 km from the entrance of a horizontal adit excavated into the side of Mount Andyrchi. The main chamber of the laboratory is 60 m long, 10 m wide, and 12 m high. The rock gives an overhead shielding equivalent to 4700 m of water and reduces the muon flux by a factor of . The measured muon flux is /(cm2-s) muonflux . To reduce neutron and gamma backgrounds from the rock, the laboratory is entirely lined with 60 cm of low-radioactivity concrete with an outer 6 mm steel shell. The flux of neutrons with energy (1–11) MeV is less than /(cm2-s) neutronflux . All facilities required by the experiment are in this underground area, with additional rooms devoted to chemistry, counting, and a low-background solid-state Ge detector. Subsidiary measurements are made in a general laboratory building outside the adit.
II.2 Experimental Procedures
The gallium target used at the present time for measurements is about 50 t. It is in the form of liquid metal and is contained in 7 chemical reactors. A measurement of the solar neutrino capture rate, which we call a “run”, begins by adding to the gallium a stable Ge carrier. The carrier is a Ga-Ge alloy with a known Ge content of approximately 350 g and is distributed equally among all reactors. The reactor contents are stirred thoroughly to disperse the Ge throughout the Ga mass. After a typical exposure interval of 4 weeks, the Ge carrier and 71Ge atoms produced by solar neutrinos and background sources are chemically extracted from the Ga using procedures described elsewhere ABD99 ; ABD94 . The final step of the chemical procedure is the synthesis of germane (GeH4), which is used as the proportional counter fill gas with an admixture of (80–90)% Xe. The total efficiency of extraction is the ratio of mass of Ge in the germane to the mass of initial Ge carrier and is typically in the range of (80–90)%. The systematic uncertainty in this efficiency is 3.4%, mainly arising from uncertainties in the mass of added and extracted carrier. Each extraction dissolves 0.1% of the gallium. Ga metal is regenerated from the accumulated extracted solutions, purified, and subsequently will be returned to the target.
The proportional counter is placed in the well of a NaI detector that is within a large passive shield and is counted for a typical period of 4–6 months. 71Ge decays via electron capture to 71Ga with a half-life of 11.43 d. Low energy - and -shell Auger electrons and x rays from electron shell relaxation produce a nearly point-like ionization in the counter gas, resulting in a fast rise time for the pulse from the counter. In contrast, most background events leave an extended trail of ionization, producing a slower rise time. A candidate 71Ge event must thus have an energy within a window around an or peak and must also have a rise time consistent with point-like ionization. In addition, since 71Ge decays without gamma emission, this event must not be coincident with an event in the NaI detector.
| Mean | Exposure | Ga | |||||||||
|---|---|---|---|---|---|---|---|---|---|---|---|
| Exposure | exposure | time | mass | Extraction | Counter | Pressure | Percent | Operating | -peak | -peak | Peak |
| date | date | (days) | (t) | efficiency | name | (mm Hg) | GeH4 | voltage | efficiency | efficiency | ratio |
| Apr. 98 | 1998.225 | 44.9 | 48.05 | 0.85 | A13 | 695 | 1480 | 0.243 | 0.219 | 1.01 | |
| May 98 | 1998.347 | 30.0 | 51.17 | 0.91 | LY4 | 690 | 1366 | 0.238 | 0.245 | 1.00 | |
| July 98 | 1998.477 | 45.6 | 51.06 | 0.90 | A12 | 680 | 1414 | 0.235 | 0.237 | 1.00 | |
| Aug. 98 | 1998.611 | 45.7 | 50.93 | 0.89 | LA51 | 660 | 1356 | 0.234 | 0.244 | 1.04 | |
| Oct. 98 | 1998.745 | 45.8 | 50.81 | 0.92 | A13 | 680 | 1404 | 0.244 | 0.212 | 1.00 | |
| Nov. 98 | 1998.883 | 45.8 | 50.68 | 0.92 | LY4 | 680 | 1322 | 0.238 | 0.244 | 1.00 | |
| Jan. 99 | 1999.014 | 44.7 | 50.54 | 0.92 | A12 | 700 | 1398 | 0.239 | 0.241 | 1.00 | |
| Feb. 99 | 1999.130 | 38.7 | 50.43 | 0.89 | LA51 | 705 | 1194 | 0.248 | 0.234 | 1.05 | |
| Apr. 99 | 1999.279 | 51.7 | 50.29 | 0.89 | A13 | 665 | 1206 | 0.253 | 0.231 | 1.05 | |
| June 99 | 1999.417 | 46.7 | 50.17 | 0.87 | LY4 | 670 | 1140 | 0.246 | 0.239 | 1.00 | |
| July 99 | 1999.551 | 45.7 | 50.06 | 0.90 | LA116 | 635 | 1164 | 0.243 | 0.244 | 1.03 | |
| Sep. 99 | 1999.685 | 45.7 | 49.91 | 0.91 | LA51 | 660 | 1172 | 0.242 | 0.238 | 1.05 | |
| Oct. 99 | 1999.801 | 38.7 | 49.78 | 0.90 | A13 | 665 | 1186 | 0.254 | 0.202 | 1.01 | |
| Jan. 00 | 2000.035 | 28.8 | 49.59 | 0.91 | LA51 | 700 | 1224 | 0.324 | 0.310 | 1.05 | |
| Feb. 00 | 2000.127 | 30.7 | 49.48 | 0.83 | LY4 | 646 | 1130 | 0.320 | 0.316 | 1.01 | |
| Mar. 00 | 2000.207 | 28.8 | 49.42 | 0.91 | A13 | 665 | 1206 | 0.332 | 0.329 | 1.10 | |
| May 00 | 2000.359 | 30.7 | 49.24 | 0.92 | LA116 | 705 | 1244 | 0.329 | 0.315 | 1.03 | |
| June 00 | 2000.451 | 33.7 | 49.18 | 0.84 | LA51 | 652 | 1160 | 0.317 | 0.314 | 1.03 | |
| July 00 | 2000.540 | 32.0 | 49.12 | 0.92 | LY4 | 670 | 1182 | 0.321 | 0.316 | 1.01 | |
| Aug. 00 | 2000.626 | 31.3 | 49.06 | 0.73 | A13 | 707 | 1176 | 0.343 | 0.321 | 1.08 | |
| Sep. 00 | 2000.704 | 27.7 | 49.00 | 0.89 | A12 | 690 | 1224 | 0.324 | 0.312 | 1.00 | |
| Oct. 00 | 2000.796 | 30.7 | 48.90 | 0.84 | LA116 | 734 | 1188 | 0.337 | 0.303 | 1.03 | |
| Nov. 00 | 2000.876 | 28.7 | 48.84 | 0.93 | LA51 | 680 | 1196 | 0.345 | 0.330 | 1.03 | |
| Dec. 00 | 2000.958 | 30.7 | 48.78 | 0.93 | LY4 | 697 | 1174 | 0.327 | 0.312 | 1.02 | |
| Feb. 01 | 2001.122 | 29.8 | 41.11 | 0.87 | LA116 | 687 | 1144 | 0.330 | 0.314 | 1.04 | |
| Mar. 01 | 2001.214 | 33.4 | 48.53 | 0.92 | LA51 | 635 | 1180 | 0.314 | 0.317 | 1.02 | |
| Apr. 01 | 2001.290 | 22.7 | 48.43 | 0.90 | YCT1 | 695 | 1210 | 0.344 | 0.333 | 1.00 | |
| May 01 | 2001.373 | 31.7 | 48.37 | 0.88 | YCT2 | 625 | 1178 | 0.332 | 0.342 | 1.00 | |
| June 01 | 2001.469 | 31.7 | 48.27 | 0.92 | YCT3 | 678 | 1190 | 0.342 | 0.334 | 1.00 | |
| July 01 | 2001.547 | 23.7 | 48.17 | 0.93 | LA116 | 690 | 1196 | 0.328 | 0.315 | 1.03 | |
| Aug. 01 | 2001.624 | 28.7 | 48.11 | 0.59 | A12 | 768 | 1148 | 0.340 | 0.302 | 1.00 | |
| Sep. 01 | 2001.701 | 27.7 | 48.06 | 0.90 | YCT1 | 665 | 1204 | 0.338 | 0.337 | 1.00 | |
| Oct. 01 | 2001.793 | 30.7 | 47.96 | 0.88 | YCT2 | 758 | 1210 | 0.354 | 0.326 | 1.00 | |
| Nov. 01 | 2001.887 | 34.8 | 47.91 | 0.92 | YCT3 | 685 | 1210 | 0.342 | 0.335 | 1.00 | |
| Dec. 01 | 2001.955 | 22.8 | 47.86 | 0.86 | YCT4 | 685 | 1176 | 0.344 | 0.333 | 1.00 |
The data acquisition electronics have evolved over the course of SAGE. During the first two years a hardware measure of the pulse rise time was used — the amplitude of the differentiated pulse (ADP) technique. This method suffices well in the peak (10.4 keV) but was found to be inadequate for the peak (1.2 keV), which is more sensitive to electronic drifts and has higher background. In 1992 an 8-channel counting system with a 1-GHz digital oscilloscope was implemented, which permits off-line analysis of the event waveforms. The digitized pulse is fit to a functional form ELL90 which gives the energy deposited during the event and the time duration over which the ionization arrives at the anode wire. All -peak results and the vast majority of -peak results are obtained from this waveform analysis.
After filling, counters are calibrated with an 55Fe source (5.9 keV) through a window in the Fe cathode. Typically, they are again calibrated after 3 days of operation and approximately every two weeks subsequently. Calibrations are also made with a 109Cd source whose gamma rays penetrate the counter wall and fluoresce the length of the Fe cathode, thus giving the x-ray peak from Fe at 6.4 keV. This allows correction of the 71Ge peak position due to the accumulation of polymer deposits on the anode wire which may occur after prolonged operation. A 109Cd +Se source, which gives peaks at 1.4 keV and 11.2 keV, is also occasionally used to check linearity.
The measure of energy is the integral of the pulse waveform for 800 ns after pulse onset. The 71Ge peak position is based on the 55Fe calibration adjusted for polymerization and the energy window (two full widths at half maximum) is set by the 55Fe resolution. If the calibration centroid shifts between two calibrations, the window for energy selection is linearly shifted in time between the two calibrations. Typical gain shifts are of the order of a few percent which leads to a calculated uncertainty in the counting efficiency of no more than -3.1%.

To determine the rise time windows for 71Ge events, proportional counters filled with 71GeH4 are measured in each of the counting channels. All events inside the energy windows of the and peaks are selected, and the rise time of each event is calculated ELL90 . The rise time values are arranged in ascending order and limits are set such that 5% of the events are excluded. For a counter filled with 30% GeH4 this leads to - and -peak event selection limits on of 0.0 ns to 18.4 ns and 0.0 ns to 10.0 ns, respectively. The upper limits are reduced to 13.2 ns and 9 ns for the and peaks, respectively, when the GeH4 concentration is in the range of 7% to 15%. The variation with counter filling and electronics channel results in an uncertainty in the efficiency of about 1%. The small loss in counting efficiency associated with this cut leads to a significant reduction in the number of background events.
Table 1 gives the parameters of the 35 runs from 1998–2001 that are used for solar neutrino measurement.
III Statistical Analysis of Solar Data
The selection criteria result in a group of events from each extraction that are candidate 71Ge decays. These events are fit to a maximum likelihood function CLE83 , assuming that they originate from an unknown but constant-rate background and the exponentially decaying rate of 71Ge.
Two time cuts are made on the counting intervals to reduce the effect of radon and radon daughters, which can give pulses that mimic 71Ge. To minimize the effect of Rn that enters the interior of the passive shield when it is opened for counter calibration, we delete the first 2.6 h of counting time in the and peaks after shield openings. Another very dangerous background occurs if even a few atoms of 222Rn enter the counter during filling. Most decays of Rn inside the counter give slow pulses at a saturated energy beyond the 71Ge peaks, but approximately 8% of the pulses from Rn and its daughters make fast pulses that are indistinguishable from those of 71Ge. Since the radon decay chain takes on average 50 min to reach the long-lived isotope 210Pb, deleting 15 min before and 3 h after each saturated pulse removes most of these internal Rn events.
| Number of | Number | ||||||
|---|---|---|---|---|---|---|---|
| Exposure | candidate | fit to | Best fit | 68% conf. | Prob. | ||
| date | events | 71Ge | (SNU) | range (SNU) | (%) | ||
| Apr. 98 | 26– | 0.052 | |||||
| May 98 | 10– | 0.051 | |||||
| July 98 | 24– | 0.065 | |||||
| Aug. 98 | 5– | 0.039 | |||||
| Oct. 98 | 4– | 0.028 | |||||
| Nov. 98 | 28– | 0.101 | |||||
| Jan. 99 | 15– | 0.036 | |||||
| Feb. 99 | 0– | 0.114 | |||||
| Apr. 99 | 5– | 0.105 | |||||
| June 99 | 123– | 0.048 | |||||
| July 99 | 49– | 0.118 | |||||
| Sep. 99 | 43– | 0.099 | |||||
| Oct. 99 | 80– | 0.066 | |||||
| Jan. 00 | 23– | 0.060 | |||||
| Feb. 00 | 63– | 0.058 | |||||
| Mar. 00 | 78– | 0.046 | |||||
| May 00 | 0– | 0.143 | |||||
| June 00 | 0– | 0.179 | |||||
| July 00 | 33– | 0.088 | |||||
| Aug. 00 | 39– | 0.086 | |||||
| Sep. 00 | 64– | 0.093 | |||||
| Oct. 00 | 8– | 0.020 | |||||
| Nov. 00 | 0– | 0.208 | |||||
| Dec. 00 | 43– | 0.062 | |||||
| Feb. 01 | 43– | 0.088 | |||||
| Mar. 01 | 14– | 0.120 | |||||
| Apr. 01 | 43– | 0.074 | |||||
| May 01 | 90– | 0.088 | |||||
| June 01 | 57– | 0.025 | |||||
| July 01 | 0– | 0.033 | |||||
| Aug. 01 | 38– | 0.065 | |||||
| Sep. 01 | 0– | 0.139 | |||||
| Oct. 01 | 44– | 0.082 | |||||
| Nov. 01 | 0– | 0.084 | |||||
| Dec. 01 | 34– | 0.063 | |||||
| Combined | 60– | 0.080 | |||||
For each individual extraction, the best estimate of the 71Ge production rate is found by maximizing the likelihood function. The statistical uncertainty in the production rate is found by integrating the likelihood function over the background rate to give a function of production rate only, and then finding the minimum range in this rate that includes 68% of the area under the curve. This procedure is done separately for events in the and peaks. The small variation in the Earth-Sun distance (no greater than 3%) due to the eccentricity of the Earth’s orbit is taken into account. The best estimate for a combination of runs (and also for the combination of a single run) is obtained by multiplying the individual likelihood functions, requiring that the production rate per unit mass of Ga be equivalent but allowing the background rate to be different for each component of the function. The global maximum of the product function is then found and the 68% confidence region for the production rate is set by finding where the function has decreased from its value at the maximum by the factor 0.606, all other variables being maximized. The results of the combined analysis of recent extractions are given in Table 2 and the results of all runs of SAGE are plotted in Fig. 1.
After publication of Ref. ABD99 , which reported measurements from January 1990 through December 1997, it was found that a faulty data acquisition program was used in the period from June 1996 through December 1999. At the beginning of this period it was necessary to change the hardware that recognized coincidences between the NaI and proportional counters. The new hardware required a modification of the acquisition program which introduced an error in the trigger logic. As a result % of triggers was lost. This error artificially reduced the results of individual runs counting during this period and slightly influenced the overall result. Corrected results were given in GAV00 .
IV Systematic Effects
Table 3 summarizes the systematic effects that may affect the measured solar neutrino capture rate. These uncertainties fall into three main categories: those associated with extraction efficiency, with counting efficiency, and with backgrounds. Some of these effects were mentioned above and the others will be briefly discussed here.
The counting efficiency and its uncertainty was determined by a series of measurements with gas fillings of 71Ge, 37Ar, and 69Ge. The uncertainty contains terms due to volume efficiency, end effects, and gas efficiency. Adding each of these effects in quadrature gives a uncertainty due to the counters.
There exist small contributions to the 71Ge signal by means other than solar neutrinos. Limits on the creation of 71Ge through the reaction on 71Ga and by cosmic-ray muons were obtained by measurement in the Ga chamber of both the fast neutron neutronflux ; Gavrin91b and muon fluxes muonflux . Limiting values on the U and Th concentration in the Ga, which can also make 71Ge, have been determined by low background counting in a Ge detector GAV86 and by glow discharge mass spectrometry Evans . The inferred 71Ge production rate from the combination of all of these processes is no more than 1 SNU.
Rn decay in the vicinity of the proportional counters or inside the counters themselves can also give events that mimic 71Ge decay. To reduce such events Rn is purged from the volume near the counters by a constant flow of gas from boiling liquid nitrogen and special anti-Rn procedures are applied to purify the gas mixture at the time of counter filling. The influence of residual Rn was quantified by studies in which Rn was added inside the counter intradon and the response of the counter to external gamma-rays was measured extgamma . The systematic uncertainties on the 71Ge production rate for Rn that remains after the time cuts were determined to be 0.2 SNU for internal Rn and 0.03 SNU for external Rn.
| Extraction efficiency | Ge carrier mass | 1.5 |
| Extracted Ge mass | 1.8 | |
| Residual carrier Ge | 0.6 | |
| Ga mass | 0.2 | |
| Counting efficiency | Counter effects | 1.3 |
| Gain shifts | +2.2 | |
| Resolution | -0.4,+0.5 | |
| Rise time limits | 0.7 | |
| Lead and exposure times | 0.6 | |
| Backgrounds | Neutrons | -0.02 |
| U and Th | -0.7 | |
| muons | -0.7 | |
| Internal radon | -0.2 | |
| External radon | 0.0 | |
| Other Ge isotopes | -0.7 | |
| Total | -3.2,+3.7 |
68Ge and 69Ge can be produced by background processes and their decays can be misinterpreted as 71Ge. 68Ge is of special concern as it decays solely by electron capture giving events that are identical to those from 71Ge. It is mainly produced by cosmic-ray muons and we can estimate the rate by scaling the predicted 71Ge rate of atoms/day in 60 t of Ga ABD99 ; Gavrin87 by the measured cross section ratio for 68Ge to 71Ge production with 280-GeV muons of Cribier97 . This gives atoms of 68Ge produced by muons per day in 50 t of Ga. Since the 68Ge half life is 271 d, considerably longer than the usual total counting time, these pulses will be distributed almost uniformly during the counting period, but there will be a small excess during the early part of counting. Using typical values for exposure time of 30 d, Ga mass of 50 t, extraction efficiency of 0.9, counting efficiency of 0.6 in the sum of and peaks, 150 d of counting, and our average background rate of 0.175/day, simulations show that a true 68Ge production rate of 0.022/day leads to a false 71Ge production rate of 0.0085/day, which is equivalent to 0.05 SNU.
The isotope 69Ge can be produced from Ga by several processes, including the interaction of cosmic rays, 8B solar neutrinos, and protons on 71Ga, where the protons are secondaries either from particles from internal radioactivity or from neutrons from the surrounding rock. The total 69Ge production rate in 60 t of Ga is estimated to be 0.21 atoms/day ABD99 with an uncertainty of approximately 50%. Because most 69Ge decays are accompanied by gamma rays which are rejected by the NaI veto with an efficiency of 90%, and counting usually begins 1.5 d after extraction, a time comparable with the 69Ge half life of 1.6 d, we calculate that only 0.045 69Ge decays will be observed in a typical run ABD99 , a factor of 100 less than the average number of detected 71Ge decays. The background effect of 69Ge is thus no more than 0.7 SNU.
These estimates of the counting rate of 68Ge and 69Ge can be checked by searching for these isotopes in the large set of 71Ge counting data that we now have from solar runs. The procedures and efficiencies for selecting candidate events are described in Ref. Gorbachev . The 68Ge production rate determined in this way is atoms/day in 60 t of Ga. The central value is a factor of 7 more than the estimate given above, but within the large error range the rates determined by the two methods are in agreement. Since the result from the cosmic-ray production rate of 71Ge and the cross section ratio has the smaller uncertainty, we use it for our estimate of the 68Ge background. There is some concern though that the predicted cosmic-ray production rate of 71Ge may be underestimated; a more direct measurement would be desirable and this is considered briefly in Gorbachev . A similar search for 69Ge events shows that the production rate in 60 t of gallium is less than 0.49 atoms/day, in agreement with the value given above.
V Results
The global best fit capture rate for all data from January 1990 to December 2001 (92 runs and 158 separate counting sets) is SNU, where the uncertainty is statistical only. In the windows that define the and peaks there are 1723 counts with 406.4 assigned by time analysis to 71Ge (the total counting live time is 29.5 years). If one considers the -peak and -peak data independently, the results are SNU and SNU, respectively. The agreement between the two peaks serves as a strong check on the robustness of the event selection criteria. The total systematic uncertainty is determined by adding in quadrature all the contributions given in Table 3. Our overall result is thus SNU. For comparison, the latest result of the GNO experiment (including GALLEX) is SNU GNO00 . If we combine the SAGE statistical and systematic uncertainties in quadrature, the result is SNU.
V.1 Tests of 71Ge Extraction Efficiency
The validity of this result relies on the ability to chemically remove with a well known efficiency a few atoms of 71Ge produced by neutrino interactions from atoms of Ga. To measure this efficiency about 350 g of stable Ge carrier is added to the Ga at the beginning of each exposure, but even after this addition, the separation factor of Ge from Ga is still 1 atom in 1011. We have performed several auxiliary measurements which confirmed that the technology of our experiment has the capability to extract 71Ge at this level.
An initial test was carried out in which Ge carrier doped with a known number of 71Ge atoms was added to a reactor holding 7 t of Ga. Three successive extractions were made, and the number of 71Ge atoms in each extraction was determined by counting. The results ABD94 showed that the extraction efficiency for the natural Ge carrier and the 71Ge atoms did not differ.
A second experiment addressed the concern that the 71Ge atom from inverse beta decay may be created in an excited or ionized state which results in the 71Ge being tied up in a chemical form from which we cannot efficiently extract. A set of measurements designed to test directly this question was carried out by observing the beta decay of radioactive Ga isotopes in liquid Ga. These measurements ABD94 showed that the expected isotopes are formed in the amounts anticipated at the 10% level.
A test of all the experimental procedures including the chemical extraction, counting, and the analysis technique was performed using a 19.1 PBq (517 kCi) 51Cr neutrino source. The result, expressed as the ratio of the measured 71Ge production rate to that expected due to the source strength, is ABD96 ; ABD98 . This value provides strong verification that the experimental efficiencies are as claimed and validates the fundamental assumption in radiochemical experiments that the extraction efficiency of atoms produced by neutrino interactions is the same as that of the natural carrier.
V.2 Tests of Analysis Hypotheses
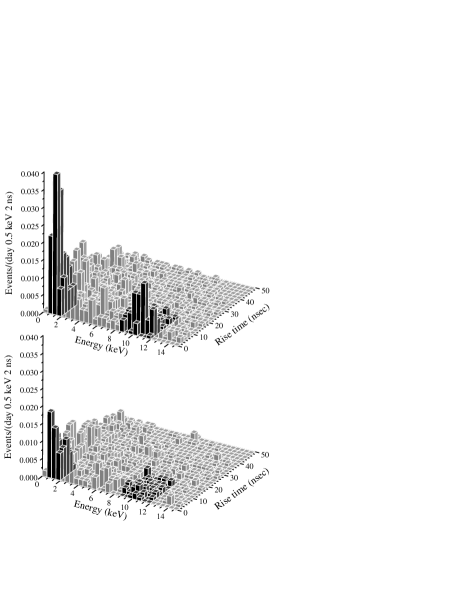
Direct visual evidence that we are really observing 71Ge is in Fig. 2 which shows all events that survive the time cuts and that do not have a NaI coincidence. The expected location of the 71Ge and peaks is shown darkened. These peaks are apparent in the upper panel but missing in the lower panel because the 71Ge has decayed away.
V.2.1 Time sequence

A major analysis hypothesis is that the time sequence of observed events for each run consists of the superposition of events from the decay of a fixed number of 71Ge atoms plus background events which occur at a constant rate. The quantity and the goodness of fit probability inferred from it provide a quantitative measure of how well the data fit this hypothesis. These numbers are evaluated for each data set and given in Table 2. There are occasional runs with low probability of occurrence, but no more of these are observed than are expected due to normal statistical variation.
This method can also be used to determine the goodness of fit for the combined time sequence of all plus events from any combination of runs. For all SAGE runs this test yields , with a goodness of fit probability of . A visual indication of the good quality of this fit is provided in Fig. 3 which shows the count rate for all events in the and peaks vs time after extraction. An additional quantitative indication that 71Ge is being counted can be obtained by allowing the decay constant during counting to be a free variable in the maximum likelihood fit, along with the combined 71Ge production rate and all the background rates. The best fit half-life to all selected events in both and peaks is then days, in agreement with the measured value HAM85 of 11.43 days.
V.2.2 Production rate sequence
Another analysis hypothesis is that the rate of 71Ge production is constant in time. By examination of Fig. 1, it is apparent that, within the large statistical uncertainty for each run, there is no substantial long-term deviation from constancy.
Another way to consider this question is to use the cumulative distribution function of the production rate , defined as the fraction of data sets whose production rate is less than . Figure 4 shows this distribution for all data sets and the expected distribution from simulation, assuming a constant production rate of 70.8 SNU. The two curves parallel each other closely and can be compared by calculating the test statistic CLE982 . This gives = 0.337 whose probability is 11%.


V.3 Temporal Combinations of Data
| Number | Number of | Number | ||||||
| Exposure | of data | candidate | fit to | Best fit | 68% conf. | Probability | ||
| interval | sets | events | 71Ge | (SNU) | range (SNU) | (%) | ||
| 1990 | 2– | 0.260 | ||||||
| 1991 | 82– | 0.120 | ||||||
| 1992 | 59– | 0.047 | ||||||
| 1993 | 62– | 0.199 | ||||||
| 1994 | 51– | 0.027 | ||||||
| 1995 | 77– | 0.041 | ||||||
| 1996 | 34– | 0.067 | ||||||
| 1997 | 48– | 0.057 | ||||||
| 1998 | 39– | 0.064 | ||||||
| 1999 | 66– | 0.068 | ||||||
| 2000 | 55– | 0.102 | ||||||
| 2001 | 55– | 0.050 | ||||||
| January | 37– | 0.082 | ||||||
| February | 44– | 0.045 | ||||||
| March | 79– | 0.043 | ||||||
| April | 37– | 0.072 | ||||||
| May | 59– | 0.051 | ||||||
| June | 58– | 0.175 | ||||||
| July | 37– | 0.091 | ||||||
| August | 60– | 0.058 | ||||||
| September | 54– | 0.035 | ||||||
| October | 57– | 0.080 | ||||||
| November | 44– | 0.034 | ||||||
| December | 84– | 0.040 | ||||||
| January+February | 46– | 0.095 | ||||||
| March+April | 61– | 0.026 | ||||||
| May+June | 63– | 0.111 | ||||||
| July+August | 53– | 0.075 | ||||||
| September+October | 59– | 0.041 | ||||||
| November+December | 66– | 0.042 | ||||||
| February+March | 63– | 0.037 | ||||||
| April+May | 54– | 0.049 | ||||||
| June+July | 50– | 0.081 | ||||||
| August+September | 61– | 0.043 | ||||||
| October+November | 54– | 0.043 | ||||||
| December+January | 70– | 0.059 | ||||||
| February+November | 48– | 0.017 | ||||||
| March+October | 71– | 0.062 | ||||||
| April+September | 52– | 0.043 | ||||||
| May+August | 64– | 0.045 | ||||||
Neutrino oscillations can give a seasonal variation of the capture rate for some values of the mass and mixing angle parameters Berezinsky99 ; Fogli99 . Other phenomena can also yield temporal variations (see, e.g., Akhmedov99 ; Sturrock00 ). We thus give in Table 4 the results of combining the SAGE runs in various ways, monthly, bimonthly, and yearly. There is no compelling evidence for a temporal variation in any of these data divisions. The yearly results are plotted in Fig. 5 which shows that the rate has been more or less constant during the data taking period. Considering only the statistical errors, a test against the hypothesis of the constant rate of 70.8 SNU yields , which, with 11 degrees of freedom, has a probability of 83%.
Day-night effects can also produce large differences in the capture rate between winter and summmer (see, e.g., Fogli99 ). Defining summer as the -year interval centered on 21 June and winter as the rest of the year, the winter minus summer difference in SAGE capture rate is SNU where the stated error is only statistical. In our method of data analysis ABD99 we remove the known change in rate caused by the Earth’s orbital eccentricity, and thus in the absence of neutrino oscillations the expected value for is zero. (If, rather than using the above solstice-based definition, we define summer as the -year interval centered on 5 July, the time of the aphelion, then SNU, also consistent with a null rate.)
VI The Neutrino Flux
One of the main purposes of the Ga experiment is to provide information that leads to the experimental determination of the flux of neutrinos at the Earth. In this Section we indicate the present state of this measurement where we use only information from the various solar neutrino experiments and assume that their reduced capture rate compared to SSM predictions is due to neutrino oscillations. 222Note that the very restrictive luminosity constraint Bahcall02 is not used here.
By combining the results of SAGE, GALLEX, and GNO, the capture rate in the Ga experiment is approximately SNU. This rate is the sum of the rates from all the components of the solar neutrino flux, which we denote by [+7Be+CNO+BGa,exp], where “exp” indicates that this is a measured rate. (We ignore the contribution, as it is a negligible 0.05% of the total in the SSM calculation BAH00 .)
The only one of these flux components that is known is the 8B flux, measured by SNO to be [8BSNO,exp] = electron neutrinos/(cm2-s) MAC00 . Since the shape of the 8B spectrum in SNO and SuperKamiokande is very close to that of the SSM above 5 MeV and the cross section for Ga rises steeply with energy, we can use the SNO flux and the cross section for 8B neutrinos with SSM shape ( cm2 [see BAH97 ; cross for the cross sections used here]) to conclude that the 8B contribution to the Ga experiment is [8BGa,exp] = SNU. Subtracting this measured value from the total Ga rate gives [Be+CNO+Ga,exp] = SNU.
The measured capture rate in the Cl experiment is [7Be+8B+CNO+Cl,exp] = SNU CLE98 . (The contribution will again be neglected as it is only 0.5% of the total in the SSM.) Since the cross section in Cl is dominated by neutrinos above 5 MeV, we can again use the SNO flux and the cross section calculated for the SSM ( cm2), and deduce that the contribution of 8B to the Cl experiment is [8BCl,exp] = SNU. Subtracting this component from the total leaves [7Be+CNO+Cl,exp] = SNU, all of which is due to neutrinos of medium energy.
Neutrino oscillations have the effect of introducing an energy-dependent survival factor to the fluxes predicted by the SSM. For the medium-energy neutrinos this factor for the Cl experiment can be approximated by the ratio of the measured rate to the SSM prediction of [7Be+CNO+Cl,SSM] = SNU. If we assume that the survival factor varies slowly with energy, we find it to be given by [7Be+CNO+Cl,exp]/[7Be+CNO+Cl,SSM] = . Since the 7Be contribution dominates, and it is at a single energy, the error in this factor due to the assumption that it is the same for all of these flux components can be estimated by considering the contribution of the non-7Be components to the total in the SSM, which is 36%. We thus increase the error from 0.17 to
The relative contributions to the capture rate of the medium-energy neutrinos are about the same in Ga as in Cl (75% from 7Be in Ga compared to 64% in Cl). Thus it is reasonable to apply the survival factor determined for Cl to the Ga experiment, i.e., [7Be+CNO+Ga,exp] = [7Be+CNO+Ga,SSM] = SNU. We subtract this contribution from the rate above and get the result for the measured rate in the Ga experiment [Ga,exp] = [Be+CNO+Ga,exp] - [7Be+CNO+Ga,exp] = SNU.
Since the cross section does not change appreciably over the narrow range of Ga response to the neutrinos, (0.23–0.42) MeV, we divide the capture rate by the SSM cross section for electron neutrinos of cm2 and obtain the measured electron neutrino flux at Earth of /(cm2-s). Alternatively, if we divide the capture rate by the cross section multiplied by the survival probability for neutrinos, which is 60% for the favored LMA solution BAH011 assuming no transitions to sterile neutrino flavors, we receive the rate of neutrino emission in the solar fusion reaction of /(cm2-s), in agreement with the SSM calculation of /(cm2-s) BAH00 . The major component of the error in the flux measurement is due to the poor knowledge of the energy-dependent survival factor.
Several approximations were made in arriving at this value, whose nature cannot be easily quantified, so perhaps the error given here is somewhat underestimated. Nonetheless, as mentioned in the Introduction, it will be possible to reduce the error in this flux greatly when the region of mass and mixing angle parameters is better determined, as should be done by the KamLAND experiment, and when the 7Be flux is directly measured, as anticipated by Borexino Bil01 . The dominant error should eventually be due to the inaccuracy of the Ga measurement itself, and hence we are seeking to reduce our statistical and systematic errors.
VII Summary and Conclusions
The methods and analysis of the SAGE experiment have been summarized and results for 92 extractions during 12 years of operation from January 1990 through December 2001 have been presented. The measured capture rate is SNU where the uncertainty is statistical only. Analysis of all known systematic effects indicates that the total systematic uncertainty is SNU, less than the statistical error. Finally we have examined the counting data and shown that there is good evidence that 71Ge is being counted, that the counting data fit the analysis hypotheses, and that the counting data are self-consistent.
The SAGE result of 70.8 SNU represents 55% of SSM predictions BAH00 . Given the extensive systematic checks and auxiliary measurements that have been performed, especially the 51Cr neutrino source experiment ABD96 ; ABD98 , this 6.0 reduction of the solar neutrino capture rate compared to SSM predictions is very strong evidence that the solar neutrino spectrum below 2 MeV is significantly depleted, as has been proven for the 8B flux by the Cl, Kamiokande, and SNO experiments. The SAGE result is even somewhat below the astrophysical minimum capture rate of SNU BAH97 .
Several recent phenomenology papers (see, e.g., BAH012 ; KRA01 ; GON01 ) discuss the combined fit of all solar neutrino experiments. Their conclusion is that the electron neutrino oscillates into other species and the best fit is to the LMA region of Mikheyev-Smirnov-Wolfenstein (MSW) oscillations. To more precisely determine the oscillation parameters in the solar sector will require additional data, especially from experiments sensitive to the low-energy neutrinos. In this vein, SAGE continues to perform regular solar neutrino extractions every four weeks with 50 t of Ga and will continue to reduce its statistical and systematic uncertainties.
Acknowledgments
We thank J. N. Bahcall, M. Baldo-Ceolin, G. T. Garvey, W. Haxton, V. A. Kuzmin, V. V. Kuzminov, V. A. Matveev, L. B. Okun, R. G. H. Robertson, V. A. Rubakov, A. Yu. Smirnov, A. N. Tavkhelidze, and many members of GALLEX and GNO for their continued interest and for stimulating discussions. We greatly appreciate the work of our prior collaborators O. L. Anosov, O. V. Bychuk, M. L. Cherry, R. Davis, Jr., I. I. Knyshenko, V. N. Kornoukhov, R. T. Kouzes, K. Lande, A. V. Ostrinsky, D. L. Wark, P. W. Wildenhain, and Yu. I. Zakharov. We acknowledge the support of the Russian Academy of Sciences, the Institute for Nuclear Research of the Russian Academy of Sciences, the Russian Ministry of Science and Technology, the Russian Foundation of Fundamental Research under grant No. 96-02-18399, the Division of Nuclear Physics of the U.S. Department of Energy under grant No. DEFG03-97ER41020, and the U.S. Civilian Research and Development Foundation under award No. RP2-159. This research was made possible in part by grant No. M7F000 from the International Science Foundation and grant No. M7F300 from the International Science Foundation and the Russian Government.
References
- (1) S. Fukuda et al., hep-ex/0103032, Phys. Rev. Lett. 86, 5651 (2001); hep-ex/0103033, Phys. Rev. Lett. 86, 5656 (2001).
- (2) Q. R. Ahmad et al.,, nucl-ph/0106015, Phys. Rev. Lett. 87, 071301 (2001).
- (3) B. T. Cleveland, T. J. Daily, R. Davis, Jr., J. R. Distel, K. Lande, C. K. Lee, and P. S. Wildenhain, Astrophys. J. 496, 505 (1998).
- (4) J. N. Abdurashitov, V. N. Gavrin, S. V. Girin, V. V. Gorbachev, T. V. Ibragimova, A. V. Kalikhov, N. G. Khairnasov, T. V. Knodel, I. N. Mirmov, A. A. Shikhin, E. P. Veretenkin, V. M. Vermul, V. E. Yants, G. T. Zatsepin,T. J. Bowles, W. A. Teasdale, D. L. Wark, M. L. Cherry, J. S. Nico, B. T. Cleveland, R. Davis, Jr., K. Lande, and P. S. Wildenhain, S. R. Elliott and J. F. Wilkerson, astro-ph/9907113, Phys. Rev. C 60, 055801 (1999).
- (5) W. Hampel, J. Handt, G. Heusser, J. Kiko, T. Kirsten, M. Laubenstein, E. Pernicka, W. Rau, M. Wojcik, Y. Zakharov, R. v. Ammon, K. H. Ebert, T. Fritsch, E. Henrich, L. Stielglitz, F. Weirich, M. Balata, M. Sann, F. X. Hartmann, E. Bellotti, C. Cattadori, O. Cremonesi, N. Ferrari, E. Fiorini, L. Zanotti, M. Altmann, F. v. Feilitzsch, R. Mößbauer, S. Wänninger, G. Berthomieu, E. Schatzmann, I. Carmi, I. Dostrovsky, C. Bacci, P. Belli, R. Bernabei, S. d’Angelo, L. Paoluzi, M. Cribier, J. Rich, M. Spiro, C. Tao, D. Vignaud, J. Boger, R. L.Hahn, J. K. Rowley, R. W. Stoenner, and J. Weneser, Phys. Lett. B 447, 127 (1999).
- (6) Y. Fukuda et al., Phys. Rev. Lett. 77, 1683 (1996).
- (7) See www.sns.ias.edu/jnb/Meetings/Lownu/index.html and www-sk.icrr.u-tokyo.ac.jp/lownu/index.html.
- (8) V. A. Kuzmin, Zh. Eksp. Teor. Fiz. 49, 1532 (1965) (Sov. Phys. JETP 22, 1051 (1966)).
- (9) J. N. Bahcall, M. H. Pinsonneault, and S. Basu, astro-ph/0010346, Astrophys. J. 555, 990 (2001).
- (10) A. S. Brun, S. Turck-Chièze, and P. Morel, astro-ph/9806272, Astrophys. J. 506, 913 (1998).
- (11) A. Piepke, Nucl. Phys. B (Proc. Suppl.) 91, 99 (2001).
- (12) G. Alimonti et al., (BOREXINO collaboration), hep-ex/0012030, Astroparticle Physics 16, 205 (2002).
- (13) M. Altmann, M. Balata, P. Belli, E. Bellotti, R. Bernabei, E. Burkert, C. Cattadori, G. Cerichelli, M Chiarini, M. Cribier, S. d’Angelo, G. Del Re, K. H. Ebert, F. v. Feilitzsch, N. Ferrari, W. Hampel, J. Handt, E. Henrich, G. Heusser, J. Kiko, T. Kirsten, T. Lachenmaier, J. Lanfranchi, M. Laubenstein, D. Motta, W. Rau, H. Richter, S. Wänninger, M. Wojcik, L. Zanotti, hep-ex/0006034, Phys. Lett. 490, 16 (2000).
- (14) V. N. Gavrin, V. N. Kornoukhov, and G. T. Zatsepin, Institute for Nuclear Research of the Academy of Sciences of the USSR Report No. P-0690, 1991.
- (15) V. N. Gavrin, V. E. Gurentsov, V. N. Kornoukhov, A. M. Pshukov, and A. A. Shikhin, Institute for Nuclear Research of the Academy of Sciences of the USSR Report No. P-0698, 1991.
- (16) J. N. Abdurashitov, V. N. Gavrin, A. V. Kalikhov, V. L. Matushko, A. A. Shikhin, V. E. Yants, and O. S. Zaborskaya, to be published in Proceedings of the XIth Int. School on Particles and Cosmology, Baksan, Russia, April 2001.
- (17) J. N. Abdurashitov, E. L. Faizov, V. N. Gavrin, A. O. Gusev, A. V. Kalikhov, T. V. Knodel, I. I. Knyshenko, V. N. Kornoukhov, I. N. Mirmov, A. M. Psukhov, A. M. Shalagin, A. A. Shikhin, P. V. Timofeyev, E. P. Veretenkin, V. M. Vermul, G. T. Zatsepin, T. J. Bowles, S. R. Elliott, J. S. Nico, W. A. Teasdale, D. L. Wark, J. F. Wilkerson, B. T. Cleveland, T. Daily, R. Davis, K. Lande, C. K. Lee, P. S. Wildenhain, M. L. Cherry, and R. T. Kouzes, Phys. Lett. B 328, 234 (1994).
- (18) S. R. Elliott, Nucl. Instrum. Methods Phys. Res. A 290, 158 (1990).
- (19) B. T. Cleveland, Nucl. Instrum. Methods Phys. Res. 214, 451 (1983).
- (20) B. T. Cleveland, Nucl. Instrum. Methods Phys. Res. A 416, 405 (1998).
- (21) V. N. Gavrin, Proceedings of the XIXth International Conf. on Neutrino Physics and Astrophysics, Sudbury, Canada, 16–21 June 2000, ed. by J. Law, R. W. Ollerhead, and J. J. Simpson, Nucl. Phys. B (Proc. Suppl.) 91, 36 (2000).
- (22) V. N. Gavrin, V. N. Kornoukhov, and V. E. Yants, Institute for Nuclear Research of the Academy of Sciences of the USSR Report No. P-0703, 1991.
- (23) V. N. Gavrin, S. N. Danshin, A. V. Kopylov, and V. E. Cherekhovsky, Institute for Nuclear Research of the Academy of Sciences of the USSR Report No. P-0494, 1986.
- (24) Charles Evans Associates report (unpublished).
- (25) V. N. Gavrin, V. V. Gorbachev, and I. N. Mirmov, Yad. Phys. (subm.).
- (26) V. N. Gavrin and V. V. Gorbachev, Yad. Phys. (subm.).
- (27) V. N. Gavrin and Yu. I. Zacharov, Institute for Nuclear Research of the Academy of Sciences of the USSR Report No. P-0560, 1987.
- (28) M. Cribier, B. Pichard, J. Rich, J. P. Soirat, M. Spiro, Th. Stolarczyk, C. Tao, D. Vignaud, P. Anselmann, A. Lenzing, C. Schlosser, R. Wink, and J. K. Rowley, Astropart. Phys. 6, 129 (1997).
- (29) V. N. Gavrin, V. V. Gorbachev, T. V. Ibragimova, and B. T. Cleveland, Yad. Phys. 65, 1309 (2002); Phys. Atomic Nuclei 65, 1276 (2002).
- (30) J. N. Abdurashitov, V. N. Gavrin, S. V. Girin, V. V. Gorbachev, T. V. Ibragimova, A. V. Kalikhov, N. G. Khairnasov, T. V. Knodel, V. N. Kornoukhov, I. N. Mirmov, A. A. Shikhin, E. P. Veretenkin, V. M. Vermul, V. E. Yants, G. T. Zatsepin, T. J. Bowles, J. S. Nico, W. A. Teasdale, D. L. Wark, M. L. Cherry, V. N. Karaulov, V. L. Levitin, V. I. Maev, P. I. Nazarenko, V. S. Shkol’nik, N. V. Skorikov, B. T. Cleveland, T. Daily, R. Davis, Jr., K. Lande, C. K. Lee, P. S. Wildenhain, Yu. S. Khomyakov, A. V. Zvonarev, S. R. Elliott, and J. F. Wilkerson, Phys. Rev. Lett. 77, 4708 (1996).
- (31) J. N. Abdurashitov, V. N. Gavrin, S. V. Girin, V. V. Gorbachev, T. V. Ibragimova, A. V. Kalikhov, N. G. Khairnasov, T. V. Knodel, V. N. Kornoukhov, I. N. Mirmov, A. A. Shikhin, E. P. Veretenkin, V. M. Vermul, V. E. Yants, G. T. Zatsepin, Yu. S. Khomyakov, A. V. Zvonarev, T. J. Bowles, J. S. Nico, W. A. Teasdale, D. L. Wark, M. L. Cherry, V. N. Karaulov, V. L. Levitin, V. I. Maev, P. I. Nazarenko, V. S. Shkol’nik, N. V. Skorikov, B. T. Cleveland, T. Daily, R. Davis, Jr., K. Lande, C. K. Lee, P. S. Wildenhain, S. R. Elliott, and J. F. Wilkerson, hep-ph/9803418, Phys. Rev. C. 59, 2246 (1999).
- (32) W. Hampel and L. Remsberg, Phys. Rev. C 31, 666 (1985).
- (33) V. Berezinsky, G. Fiorentini, and M. Lissia, hep-ph/9904225, Astropart. Phys. 12, 299 (2000).
- (34) G. L. Fogli, E. Lisi, D. Montanino, and A. Palazzo, hep-ph/9910387, Phys. Rev. D 61, 073009 (2000).
- (35) J. Pulido and E. Kh. Akhmedov, hep-ph/9907399, Astropart. Phys. 13, 227 (2000).
- (36) P. A. Sturrock and J. D. Scargle, astro-ph/0011228, Astrophys. J. 550, L101-L104 (2001).
- (37) J. N. Bahcall, hep-ph/0108148, Phys. Rev. C 65 025801 (2002).
- (38) J. N. Bahcall, hep-ph/9710491, Phys. Rev. C 56, 3391 (1997).
- (39) J. N. Bahcall et al., nucl-th/9601044, Phys. Rev. C 54, 411 (1996).
- (40) J. N. Bahcall, M. C. Gonzalez-Garcia, and C. Peña-Garay, hep-ph/0111150, JHEP 0204, 007 (2002).
- (41) After the appearance of our preprint we learned that similar arguments to ours have been used to make predictions for what will be measured by BOREXINO. See S. M. Bilenky, T. Lachenmaier, W. Potzel, and F. v. Feilitzsch, hep-ph/0109200, Phys. Lett. 533, 191 (2002).
- (42) J. N. Bahcall, M. C. Gonzalez-Garcia, and C. Peña-Garay, hep-ph/0106258, JHEP 0108, 014 (2001).
- (43) P. I. Krastev and A. Yu. Smirnov, hep-ph/0108177, Phys. Rev. D 65, 073022 (2002).
- (44) M.C. Gonzalez-Garcia, M. Maltoni, and C. Peña-Garay, hep-ph/0108073.