HI 21cm imaging of a nearby Damped Lyman- system
Abstract
We present Giant Metrewave Radio Telescope (GMRT) HI 21cm emission images of the damped Lyman- (DLA) absorber towards the QSO HS 1543+5921. The DLA has been earlier identified as a low surface brightness galaxy SBS 1543+593 (Reimers & Hagen (1998); Bowen et al. 2001a ) with small ( pc) impact parameter to the QSO line of sight. The extremely low redshift of the absorber allows us to make, for the first time, spatially resolved images of the 21cm emission; besides the HI mass, this also enables us to determine the velocity field of the galaxy and, hence, to estimate its dynamical mass. We obtain a total HI mass of M⊙, considerably smaller than the value of M determined from blind 21cm emission surveys. This continues the trend of low HI mass in all low redshift DLAs for which HI emission observations have been attempted. We also find that the QSO lies behind a region of low local HI column density in the foreground galaxy. This is interesting in view of suggestions that DLA samples are biased against high HI column density systems. Finally, the dynamical mass of the galaxy is found to be M M⊙.
Key Words.:
galaxies: evolution: – galaxies: formation: – galaxies: ISM – cosmology: observations – radio lines: galaxies1 Introduction
Neutral gas at high redshifts is easiest to detect in absorption against bright background sources. Not surprisingly, most of what we know about the content and evolution of neutral gas in the universe comes from the study of absorption lines seen in the spectra of distant QSOs. The number density (per unit redshift) of these absorption lines is a strong function of the column density, with low column density ( atoms cm-2) systems being several orders of magnitude more common than high column density ( atoms cm-2) systems. Nonetheless, the bulk of the neutral gas at high redshift is contained in these rare high HI column density absorbers. It is principally for this reason that these objects (called damped Lyman- systems or DLAs) are obvious candidates for the precursors of today’s galaxies. Further, the gas mass in DLAs at is comparable to the stellar mass in galaxies at (e.g. Storrie-Lombardi et al. (1996); Storrie-Lombardi & Wolfe (2000)), consistent with the idea that the absorbers have converted their gas into stars in the intervening period. Understanding the nature of DLAs at different redshifts is clearly important in tracing the evolution of galaxies; for this reason, the absorbers have been the subject of considerable study over the last two decades.
Unfortunately, since QSOs are point sources, optical absorption studies alone are unable to constrain the transverse size of the absorbers. The typical size and mass of DLAs have hence long been controversial issues. Traditionally, DLAs have been modelled as large proto-spirals (Wolfe et al. (1986)). Some support for this model comes from the shapes and widths of the absorption profiles produced by ions such as SiII (which are associated with neutral HI). The large velocity widths ( km s-1) and the asymmetric shapes of these lines have been successfully modelled as arising from gas in a thick spinning disk (Prochaska & Wolfe (1997), 1998). However, models involving infall or random motions of smaller gas clouds have also been found to succesfully reproduce the observed velocity profiles (Haehnelt et al. (1998); McDonald & Miralda-Escude (1999)).
At low redshifts, the galaxies in which the damped absorption arises can be directly studied by ground-based or HST observations. Contrary to expectations, low redshift DLAs appear to be associated with a wide variety of galaxy types, including dwarf and low surface brightness (LSB) galaxies (e.g. Le Brun et al. (1997); Nestor et al. (2001)) and not exclusively (or even predominantly) with spiral galaxies. Besides this, the majority of DLAs tend to have low metallicities ( solar) at all redshifts, with very little evolution in their metallicity with redshift (Pettini et al. (1999)); further, they also do not show the expected /Fe enrichment pattern expected for spiral galaxies (Centurión et al. (2000)), suggesting a different star formation history than that of spirals. Finally, 21cm absorption studies (Chengalur & Kanekar (2000); Kanekar & Chengalur (2001)) have shown that the majority of DLAs have high spin temperatures ( K), far higher than those observed in the Milky Way or local spirals ( K). All these results indicate that damped absorption is likely to originate in all types of galaxies and not merely in luminous disk systems.
Of course, the above results do not preclude the possibility that the galaxies responsible for the damped absorption are indeed massive gas-rich disks, but have not undergone much star formation and hence have both low luminosities as well as low metallicities. Such low surface brightness systems could well have a larger fraction of the warm phase of neutral HI and hence, a high spin temperature (Chengalur & Kanekar (2000)). However, for systems at low redshift, 21cm emission studies can be used to get direct estimates of the HI mass of the absorbers; one can thus directly test the above hypothesis, that DLAs are massive, low luminosity galaxies. Deep searches for HI emission from two nearby DLAs have resulted in non-detections (Kanekar et al. (2001); Lane (2000)). In both cases, the 3 upper limit to the HI mass is 1/3 the HI mass of an L∗ spiral. Thus, in these two cases at least, the absorption does not arise in an optically faint, but extremely gas rich galaxy.
In this paper, we discuss Giant Metrewave Radio Telescope (GMRT) 21cm emission observations of a third low redshift DLA, the absorber towards the QSO HS 1543+5921. The damped absorption has been identified as arising in a low surface brightness galaxy SBS 1543+593 (Reimers & Hagen (1998); Bowen et al. 2001a ). HI emission has also been detected from this galaxy using the Bonn Telescope (Bowen et al. 2001b ). The extremely low redshift of the absorber allows us to make, for the first time, spatially resolved images of the 21cm emission; besides the HI mass, this also enables us to determine the velocity field of the galaxy and, hence, to estimate its dynamical mass.
2 Observations
SBS 1543+593 was observed on 31 December 2000 using the GMRT. The observing setup gave a total of 128 spectral channels over the total bandwidth of 2 MHz, corresponding to a channel separation of km s-1. The standard calibrators 3C48 and 3C286 were observed at the start and end of the observing run and used to calibrate the visibility amplitudes and the bandpass shape. Phase calibration was done using observations of the nearby continuum sources 1438+621 and 1549+506, one of which was observed once every 35 minutes.
The data were converted to FITS from the raw telescope format and analysed in classic AIPS. The brightest continuum source in the field of view is the steep spectrum source 7C 1543+5920. The flux as measured at GMRT is 42 mJy, in excellent agreement with that obtained in the NVSS (Condon et al. (1998)). The source is at a distance of 2.2 (corresponding to an impact parameter of kpc) from SBS 1543+593. No statistically significant 21cm absorption is seen against this source; the 3 limit to the optical depth after smoothing to a velocity resolution of 10 km s-1 is . This yields column density limits of cm-2 and cm-2 for HI with spin temperatures of 100 K and 1000 K respectively, along this line of sight. As an aside, we note that 7C 1543+5920 has a spectral index of and is, at best, marginally resolved on our longest baselines – the upper limit on its angular size is . Given its relatively high galactic latitude (), it is likely that 7C 1543+5920 is a compact steep spectrum (CSS) source.
The GMRT has a hybrid configuration; 14 of its 30 antennas are located in a central compact array with size km ( k at 21cm) while the remaining antennas are distributed in the three arms of a Y configuration, giving a maximum baseline of km ( k at 21cm). The baselines obtained from antennas in the central square are similar in length to those of the VLA in its D configuration, while the arm antennas provide baselines similar in length to the B array of the VLA. A single observation with the GMRT hence yields information on both large and small angular scales111Note, however, that the VLA in its D array has a larger number of short spacings than the central compact array of the GMRT.. The search for absorption against the compact source 7C 1543+5920 was made using all available baselines. However, the HI emission from SBS 1543+593 is heavily resolved on the longest baselines. To study this emission, cubes were hence made at a variety of UV ranges, viz. 0-5 k, 0-10 k and 0-20 k, corresponding to spatial resolutions of 39, and . The two low resolution cubes were CLEANed, using the AIPS task IMAGR. At the highest resolution, the signal to noise ratio is too low and the emission too diffuse for CLEAN to work reliably. However, at the signal to noise ratio of the map at this resolution, convolution by the dirty beam does not greatly degrade the dynamic range (or image fidelity). The morphology should hence be accurately traced, apart from an uncertainty in the scaling factor (which is discussed in more detail below).
3 Results and Discussion
3.1 Results
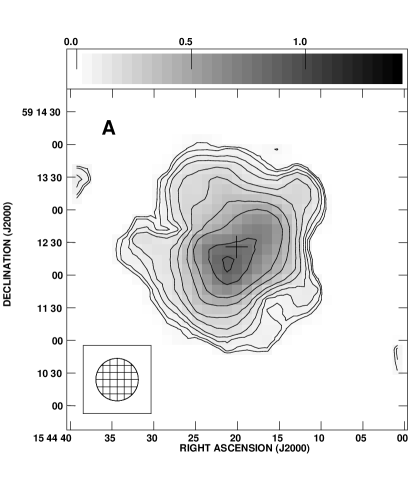
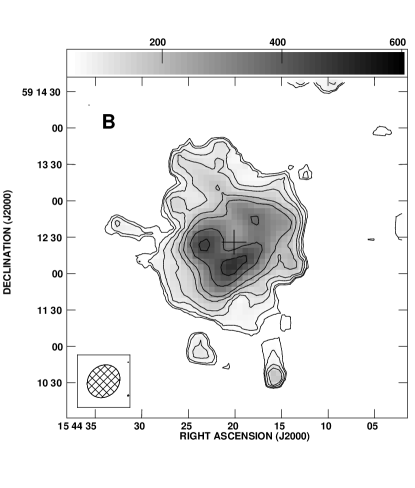
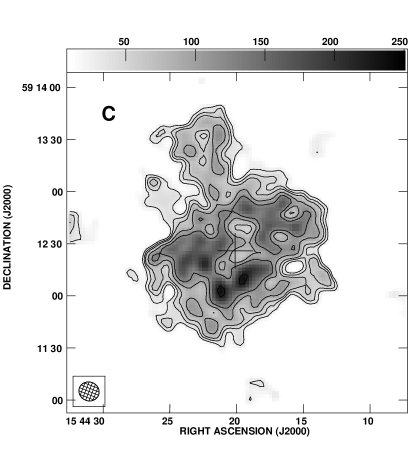

Fig. 1 shows maps of the integrated HI emission (obtained using the AIPS task MOMNT) at the three different resolutions discussed above. The QSO position is marked by a cross in all three maps. The centre of the optical galaxy is very close to the QSO position; the QSO is located only NNE of the galaxy centre (Reimers & Hagen (1998)). The low resolution map shows that the HI distribution is asymmetric with the peak emission displaced to the south-east of the galaxy centre. The higher resolution maps show clearly that the HI distribution is concentrated in a ring-like structure, with HI emission actually being depressed at the centre of the galaxy. The HI ring is coincident with the faint spiral arms seen in the optical images (Reimers & Hagen (1998); Bowen et al. 2001a ). Many of the irregular patches of emission seen in the HST image (Bowen et al. 2001a ) also appear to be associated with peaks of HI emission. The HI concentration at corresponds to the HII region whose spectrum is given in Reimers & Hagen (1998). The velocity we measure at the location of this HII region is km s-1. In addition to the inner HI ring, there are also spurs in the HI emission (see Figs. 1[B] & [C]) towards the north and south; these may mark the beginning of faint outer spiral arms.

Measurement of the integrated flux corresponding to weak extended line emission can be a non-trivial problem (see, for example, Jörsäter & van Moorsel (1995); Rupen 1999 ). However, as a rule of thumb, (apart from serious zero spacing problems), deeply cleaned images give a fairly reliable estimate of the total flux. The integrated fluxes that we get from the cleaned and data cubes are Jy km s-1 and Jy km s-1. These are in excellent agreement with the single dish measurement of Jy km s-1 (Bowen et al. 2001b ). From the area of the clean beam in these two low resolution images, the conversion from 1 Jy Beam-1 km s-1 to atoms cm-2 is atoms cm-2 and atoms cm-2 respectively. Since the highest resolution map (Fig. 1[C]) is uncleaned, there is no obvious way to convert the units from Jy Beam-1 to Jy. If one simply uses the area of the best fit Gaussian to the main lobe of the dirty beam to convert from Jy Beam-1 to Jy, one gets a total flux of Jy km s-1. This must be an overestimate, since it is clear from Fig. 1[C] that a considerable fraction of the smooth emission seen in Fig. 1[A] has been resolved out but the estimated flux in the higher resolution image is higher than that in the lower resolution ones. Given this problem in scaling for the highest resolution image, we estimate the column density at the QSO position only from the two lower resolution maps. The column densities are atoms cm-2 and atoms cm-2 for the and the resolutions, respectively. The integrated emission profile of SBS 1543+593, as derived from the resolution data (smoothed to a velocity resolution of 10 km s-1), is shown in Fig. 1[D]. The systemic velocity as measured from the profile is 2862 10 km s-1. This agrees (within the errors of the two measurements) with the velocity of 2868 2 km s-1measured from the Bonn spectrum by Bowen et al. 2001a .
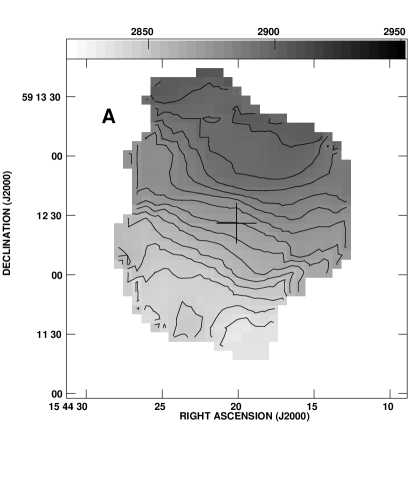
The velocity field of SBS 1543+593 (derived using the AIPS task MOMNT on the resolution cube) is shown in Fig. 2[A]. The iso-velocity contours are asymmetric; they are straight on the approaching side and curved on the receding side. This type of velocity field has been dubbed ‘kinematically lopsided’ (Swaters et al. (1999)). As noted earlier, the galaxy is also morphologically lopsided. The rotation curve was derived separately for the approaching and receding sides using the AIPS task GAL. During these fits, the galaxy centre was kept fixed at the optical centre. The systemic velocity was kept fixed at the value of 2870 km s-1, the inclination at and the position angle (of the receding half of the major axis, measured east of north) at (all of which were obtained from an initial global fit to the velocity field). The inclination and the position angle are in good agreement with our estimates from the optical image presented in Reimers & Hagen (1998).
The derived rotation curves are shown in Fig. 2[B]. As expected from the iso-velocity contours, the rotation curve is almost linear on the approaching side, while it tends to flatten out on the receding side. The maximum (inclination corrected) rotation speed in SBS 1543+593 is km s-1. The rotation curve can be measured out to a radius of , corresponding to a linear distance of 11 kpc. The implied dynamical mass is then M M⊙.
3.2 Discussion
The flux that we measure for SBS 1543+593 corresponds to a total HI mass of M⊙, in excellent agreement with the single dish measurement of Bowen et al. (2001b). This is thus the third DLA whose HI mass is significantly less than that of an L∗ spiral. Besides these, the galaxy NGC 4203 (which lies in front of the QSO Ton 1480, and is likely to be a DLA; Miller et al. (1999)) has also been found to have a low HI mass. Thus, all low redshift DLAs (or candidate DLAs) for which HI emission observations have been attempted have masses less than that of an L∗ spiral.
The derived HI masses are also considerably less than the M ( M⊙) obtained from Schecter function fits to the HI mass function determined in blind HI surveys (Zwaan et al. (1997); Rosenberg & Schneider (2001)). It also follows from these mass functions that large galaxies make the major contribution to the local HI mass density. However, in order to determine the contribution of galaxies of different HI masses to the cross-section for DLA absorption, one also needs to know the typical sizes of their HI disks. Rao & Turnshek (1998) deduced, based on determinations of the typical sizes of HI disks made by Rao (1994), that bright spiral galaxies make the major contribution to the cross-section for DLA absorption. However, more recent determinations of the HI size and mass distribution of galaxies indicate that the cross-section for DLA absorption is, in fact, not dominated by large spiral galaxies (Rosenberg & Schneider (2001); Zwaan et al. (2001)), and that a sample of low redshift DLAs should contain a large variety of galaxy types. This is consistent with the optical and HI observations of low DLAs.
It would be interesting to compare the velocity profiles of low ionization metal lines in the HS 1543+5921 spectrum with the large scale kinematics of SBS 1543+593. Unfortunately, high velocity resolution optical/UV observations are as yet not available for this system. We note, however, that the systemic velocity that we obtain for SBS 1543+593 is in excellent agreement with the value of km s-1 obtained from the single dish HI profile (Bowen et al. 2001b ). Further, the velocity obtained in our observations ( km s-1) for the gas coincident with the HII region (for which an optical emission spectrum exists) is in reasonable agreement with that obtained in the optical ( 2700 km s-1; Reimers & Hagen (1998)), given the poor resolution ( angstroms, i.e. km s-1) of the optical spectrum. Similarly, the velocity we obtain at the QSO location is km s-1, which agrees within the error bars with the velocity of km s-1 obtained from the Ly line (Bowen et al. 2001a ), given the large uncertainty ( km s-1) in the latter measurement (Bowen et al. 2001b ). A high resolution low ionization metal line absorption spectrum of the QSO (and of Ton 1480, which lies behind NGC 4203) would provide interesting spot checks of the reliability in using such absorption lines to probe large scale gas kinematics of the absorbing galaxies (see, for example, Prochaska & Wolfe (1997, 1998)).
It is also interesting to compare the HI column density as obtained from the Ly- spectrum with that obtained from the 21cm emission. The comparison is, however, complicated by the comparatively large size of the GMRT synthesized beam. At a distance of 38 Mpc, corresponds to a linear size of kpc. Given this great disparity in the transverse sizes covered by the HI and UV measurements, the column density of atoms cm-2 obtained from the 21cm map is in reasonable agreement with the estimate of atoms cm-2 obtained from the Lyman- profile.
Comparisons of DLA samples with samples of galaxies selected by blind HI emission are complicated by issues of optical extinction. It has long been suggested that DLA samples could be seriously biased against high HI column density systems, because such absorbers would contain enough dust to substantially dim the background QSO (e.g. Heisler & Ostriker (1988); Fall & Pei (1993); Pei et al. (1999)). Deep optical observations of a radio selected sample of QSOs however suggest that such biases may be modest (Ellison et al. (2001)). It is curious (but, of course, not statistically significant, particularly given the fact that optical depth effects may be less important in LSB galaxies than in normal spirals) that the QSO HS 1543+5921 lies behind a region of low local HI column density in SBS 1543+593. Interestingly, an inspection of the HI maps of the S0 galaxy NGC 4203 presented by van Driel et al. (1988) shows that Ton 1480 also lies behind a region of low column density. Unfortunately, testing the above bias would require 21cm mapping of a statistically significant number of DLAs which is, alas, a task for the next generation radio telescope.
Acknowledgements.
The GMRT observations presented in this paper would not have been possible without the many years of dedicated effort put in by the GMRT staff to build the telescope. The GMRT is run by the National Centre for Radio Astrophysics of the Tata Institute of Fundamental Research. Useful discussions with R. Nityananda are gratefully acknowledged. We also thank the referee, E. Brinks, for several comments which improved both the readability and the content of this paper.References
- (1) Bowen D. V., Tripp T. M., Jenkins E. B., 2001a, AJ, 121, 1456
- (2) Bowen D. V., Huchtmeier W., Brinks E., Tripp T. M., Jenkins E. B., 2001b, A&A, 372, 820
- Centurión et al. (2000) Centurión M., Bonifacio P., Molaro P., Vladilo G., 2000, ApJ 536, 540
- Chengalur & Kanekar (2000) Chengalur J. N., Kanekar N., 2000, MNRAS 318, 303
- Condon et al. (1998) Condon J. J., Cotton W. D., Greisen E. W., et al., 1998, AJ, 115, 1693.
- Ellison et al. (2001) Ellison S. L., Yan L., Hook I. M., et al., 2001, to appear in A&A (astro-ph/0109205)
- Fall & Pei (1993) Fall S. M., Pei Y. C., 1993, ApJ, 402, 479
- Haehnelt et al. (1998) Haehnelt M. G., Steinmetz M., Rauch M., 1998, ApJ, 495, 64.
- Heisler & Ostriker (1988) Heisler J., Ostriker J. P., 1988, ApJ, 332, 543
- Jörsäter & van Moorsel (1995) Jörsäter S., van Moorsel G. A., 1995, AJ, 110, 2037
- Kanekar & Chengalur (2001) Kanekar N., Chengalur J. N., 2001, A&A 369, 42
- Kanekar et al. (2001) Kanekar N., Chengalur J. N., Subrahmanyan R., Petitjean P., 2001, A&A, 367, 46
- Lane (2000) Lane, W., 2000, Ph.D. Thesis, Univ. of Groningen
- Le Brun et al. (1997) Le Brun V., Bergeron J., Boissé P., Deharveng J.-M., 1997, A&A, 321, 733.
- McDonald & Miralda-Escude (1999) McDonald P., Miralda-Escude J., 1999, ApJ, 519, 486.
- Miller et al. (1999) Miller E. D., Knezek P. M., Bregman J. N., 1999, ApJ, 510, L95
- Nestor et al. (2001) Nestor D. B., Rao S. M., Turnshek D. A., et al., 2001, to appear in “Extragalactic Gas at Low Redshift” (astro-ph/0108146)
- Pei et al. (1999) Pei Y. C., Fall S. M., Hauser M. G., 1999, ApJ, 522, 604
- Pettini et al. (1999) Pettini M., Ellison, S. L., Steidel C. C., Bowen D. V., 1999, ApJ 510, 576
- Prochaska & Wolfe (1997) Prochaska J. X., Wolfe A. M., 1997, ApJ, 487, 73
- Prochaska & Wolfe (1998) Prochaska J. X., Wolfe A. M., 1998, ApJ, 507, 113
- Rao (1994) Rao S. M., 1994, Ph.D. Thesis, University of Pittsburgh
- Rao & Turnshek (1998) Rao S. M., Turnshek, D. A., 1998, ApJ, 500, L115.
- Reimers & Hagen (1998) Reimers D., Hagen H.-J., 1998, A&A, 329, L25
- (25) Rupen, M. P., 1999, ASP Conf. Ser. 180: Synthesis Imaging in Radio Astronomy II, 229
- Rosenberg & Schneider (2001) Rosenberg J. L, Schneider S. E., 2001, to appear in “Extragalactic Gas at Low Redshift” (astro-ph/0107495)
- Storrie-Lombardi et al. (1996) Storrie-Lombardi L. J., McMahon R. G., Irwin M. J., 1996, MNRAS, 283, L79.
- Storrie-Lombardi & Wolfe (2000) Storrie-Lombardi L., Wolfe A. M., 2000, ApJ 543, 552
- Swaters et al. (1999) Swaters R. A., Schoenmakers R. H. M., Sancisi R., van Albada T. S., 1999, MNRAS, 304, 330
- van Driel et al. (1988) van Driel W., van Woerden H., Gallagher J. S. III, Schwarz U. J., 1988, A&A, 191, 201
- Wolfe et al. (1986) Wolfe A. M., Turnshek D. A., Smith H. E., Cohen R. D., 1986, ApJS, 61, 249.
- Zwaan et al. (2001) Zwaan M., Briggs F. H., Verheijen M., to appear in “Extragalactic Gas at Low Redshift” (astro-ph/0108498)
- Zwaan et al. (1997) Zwaan M. A., Briggs F. H., Sprayberry D. Sorar E. 1997, ApJ 490, 173