CMB: II. Combined Opportunities in the Cosmic Microwave Background and the Large Scale Structure
Large Scale Structure in an Era of Precision CMB Measurements
Abstract
The advent of high signal-to-noise cosmic microwave background (CMB) anisotropy experiments now allow detailed studies on the statistics related to temperature fluctuations. The existence of acoustic oscillations in the anisotropy power spectrum is now established with the clear detection of the first, and to a lesser confidence the second and the third, peak. Beyond the acoustic peak structure associated with CMB photon temperature fluctuations, we study the possibility for an observational detection of oscillations in the large scale structure (LSS) matter power spectrum due to baryons. We also suggest a new cosmological test using the angular power spectrum of dark matter halos, or clusters of galaxies detected via wide-field surveys of the large scale structure. The standard rulers of the proposed test involve overall shape of the matter power spectrum and baryon oscillation peaks in projection. The test allows a measurement of the angular diameter distance as a function of redshift, similar to the distance to the last scattering surface from the first acoustic peak in the temperature anisotropy power spectrum. The simultaneous detection of oscillations in both photons and baryons will provide a strong, and a necessary, confirmation of our understanding related to the physics during the recombination era. The proposed studies can be carried out with a combined analysis of CMB data from missions such as the MAP and the large scale structure data from missions such as the DUET.
1 Oscillations in CMB
The cosmic microwave background (CMB) is now a well known probe of the early universe. The temperature fluctuations in the CMB, especially the so-called acoustic peaks in the angular power spectrum of CMB anisotropies, capture the physics of primordial photon-baryon fluid undergoing oscillations in the potential wells of the dark matter Huetal97 . The associated physics — involving the evolution of a single photon-baryon fluid under Compton scattering and gravity — are both simple and linear, and many aspects of it have been discussed in the literature since the early 1970s PeeYu70 . The gravitational redshift contribution at large angular scales SacWol67 and the photon-diffusion damping at small angular scales Sil68 complete this description.
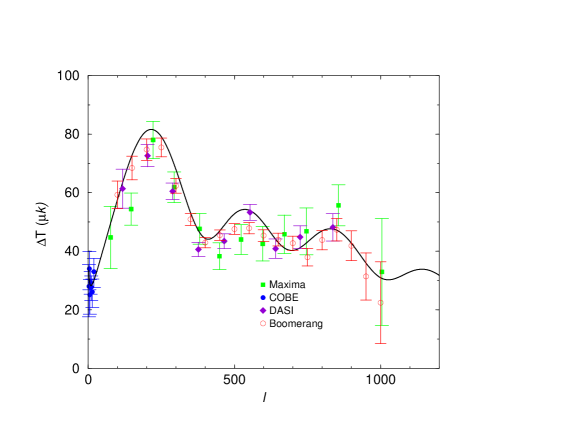
By now, there are at least five independent detections of the first, and possibly the second and the third, acoustic peak in the anisotropy power spectrum Miletal99 ; Haletal01 . We summarize these results in figure 1. Given the variety of experiments that are either collecting data or reducing data that were recently collected, more detections that extend to higher peaks are soon expected. The NASA’s MAP mission111http://map.gsfc.nasa.gov is expected to provide a significant detection of the acoustic peak structure out to a multipole of 1000 and, in the long term, the ESA’s Planck surveyor222http://astro.estec.esa.nl/Planck/, will extend this to a multipole of 2000 with better frequency coverage and polarization sensitivity. A discussion of these recent results and implications for cosmology are presented in the contribution to these proceedings by A. Melchiorri.
An additional important aspect with respect to CMB is that in transit to us, photons are affected by the large scale structure along the way. The modifications come from effects related to gravity, such as through frequency shifts associated with the integrated Sachs-Wolfe effect SacWol67 , and through effects related to scattering such as the Sunyave-Zel’dovich (SZ) effect SunZel80 . We refer the reader to Ref. Coo02 for a discussion of these contributions and their importance for understanding the large scale structure via precision CMB measurements.
2 Oscillations in LSS
The detection of coherent oscillatory features in the CMB temperature anisotropy power spectrum suggests that if our physical description of them is correct, then, the large scale structure at low redshifts should also contain a signature of oscillations. These troughs and peaks are associated with baryons which under went acoustic oscillations with photons as a single photon-baryon fluid prior to recombination333The oscillations in CMB, due to radiation, and the oscillations in LSS, due to baryons, involve similar physics, though they have subtle differences. These include a phase difference, at small wavenumbers, between the radiation and matter oscillatory peaks, due to a velocity term that source the growing mode of matter perturbations. Also, radiation oscillations project the sound horizon at the recombination while baryon oscillations project the sound horizon at the end of the Compton-drag epoch. In principle, these two epochs can be different, but for all purposes, the horizons are similar for currently favorable CDM cosmological models. We refer the interested reader to discussions in HuSug96 ; Meietal99 , and references therein, for further details.. Unlike oscillations in the angular power spectrum of CMB anisotropies, oscillations due to baryons in the matter power spectrum of the large scale structure are highly suppressed due to the low baryon content. They are also easily erased at late times due to the non-linear gravitational evolution of density perturbations Meietal99 . Compared to amplitudes of oscillations in the radiation, which vary by at least a factor of 2, baryon oscillations have amplitudes which are significantly lower with variations at the level of 8% for currently favored CDM cosmologies. These oscillations have effective widths in Fourier space of order h Mpc-1. As we discuss, these issues put several strong observational constraints for a reliable detection of these oscillations.
The verification on the presence of baryon oscillations in the large scale structure, however, is not impossible. Several attempts have already been made with three-dimensional redshift surveys such as the 2dF Galaxy Redshift Survey and information from measurements related to angular clustering Peretal01 , though there is still no significant evidence for the presence of baryon oscillations. The current three-dimensional surveys lack the required volume, with sizes of order h-1 Mpc in all three dimensions, to reliably resolve the oscillations while three dimensional power spectra obtained through an inversion of the angular correlation function should not contain oscillatory features due to the nature of the inversion and the widths of window functions involved, given the expected widths of oscillatory features Coo02a .
While ongoing redshift surveys such as the Sloan Digital Sky Survey (SDSS; Yoretal00 ) allow a strong possibility to detect these oscillations, in future, one can also use projected clustering in Fourier space, such as the angular power spectrum similar to that of CMB anisotropies, to detect baryon oscillations. This is useful given that one does not require precise redshift information but rather spatial information, and estimates of redshift for binning purposes, from wide-field surveys. In addition to galaxy survey data, a number of additional observational efforts are under way or planned to image the large-scale structure of the universe out to redshift of a few. These wide-field surveys typically cover tens to thousands of square degrees on the sky and include the weak gravitational lensing shear observations with instruments such as the SNAP and the Large Aperture Synoptic Survey Telescope, dedicated small angular scale CMB telescopes that will map the SZ effect through instruments such as the South Pole Telescope, and the wide-field X-ray imaging survey using the Dark Universe Explorer Telescope (DUET) mission. The latter was recently proposed to NASA as a Medium Explorer mission.
In addition to their primary science goals, these surveys are expected to produce catalogs of dark matter halos, which in the case of lensing and SZ surveys, such catalogs are expected to be essentially mass selected Witetal01 . In the case of X-ray, using cluster temperature data, one can also construct a mass selected catalog of galaxy clusters. Lensing and other optical surveys are particularly promising in that they will provide photometric redshifts on the member galaxies of a given halo; this will render accurate determination of the halo redshift. Halo number counts as a function of redshift is a well-known cosmological test Haietal01 . We can also consider the additional information supplied by the angular clustering of halos, in particular, a possibility to use them for a detection of the baryon oscillations, and to use clustering information for a new cosmological test.
It is well-known that a feature in the angular power spectrum of known physical scale and originating from a known redshift can be used to measure the angular diameter distance between us and this redshift; this has most notably been applied to the case of CMB anisotropy power spectrum to determine the distance to redshift . Here, one uses the peak location of the first acoustic peak which projects on the multipolar space as , where is the sound horizon at the recombination and the is the associated angular diameter distance in comoving coordinates. Given the location,and a physical model for , one can constrain cosmology using the variation of as a function of cosmological parameters.
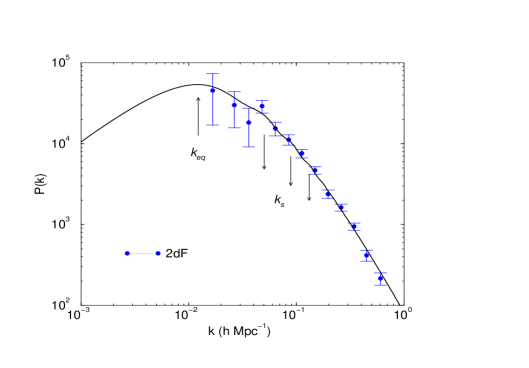
We can apply a similar argument to estimate cosmology using the clustering related to the large scale structure. In figure 2, we show the three-dimensional power spectrum and recent measurements from the 2dF galaxy redshift survey, following the analysis by Tegetal99 . In the case of the large scale structure, there are two prominent features in the linear power spectrum associated with the clustering of matter. These are the horizon at the matter-radiation equality
| (1) |
which controls the overall shape of the power spectrum, including a turn over, and the sound horizon at the end of the Compton drag epoch, ; the latter controls the peak location of oscillations due to baryons in the power spectrum. We denote these features in figure 2. Similar to the projection of the sound horizon at the recombination on to the CMB anisotropy power spectrum, the angular, or multipole, locations of features in the large scale power spectrum shift in redshift as . In Cooetal01 , this allowed us to propose the following test: measure angular power spectrum of projected clustering, , in several redshift bins and, using the fact that scales with , constrain the angular diameter distance as a function of redshift. Unlike the case with CMB, we can use tracers over a wide range in redshift and measure the distance as a function of redshift, or redshift bin. When combined with CMB observations, note that the absolute physical scale of can be directly calibrated as CMB anisotropies provide estimates of parameters such as and accurately. When combined with the large scale structure, one can break degeneracies, such as the one between and , or given sufficient prior information on to constrain information related to and .

To understand the projected clustering, consider the angular power spectrum of a tracer field of large scale structure in a redshift bin. This is simply the projection of the the tracer density power spectrum
| (2) |
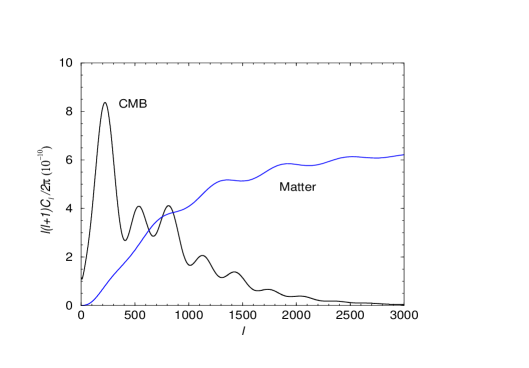
where is the distribution of tracers in a given redshift bin normalized so that , is the Hubble parameter. For comparison, in the bottom panel of figure 2, we show the projected angular power spectrum of matter at the last scattering surface and the angular power spectrum of CMB anisotropies. Note that the acoustic oscillations associated with photons always show as peaks in the anisotropy power spectrum. There is an overall shift in oscillation phases in the projected angular power spectrum of matter at the last scattering surface when compared to those of CMB anisotropy power spectrum. If we have a tracer of the matter clustering near recombination, say, just after the Compton-drag epoch, we should be able to make a comparison similar to the one suggested in the bottom panel of figure 2.
For the purpose of this discussion, we assume a tracer of the large scale structure that correspond to mass selected halos, or galaxy clusters. If these halos trace the linear density field,
| (3) |
where is the mass-averaged halo bias parameter, is the present day matter power spectrum computed in linear theory, and is the linear growth function . A scale-independent halo bias is commonly assumed in the so-called “halo model” CooShe02 and should be valid at least in the linear regime. Equation (2) then becomes
| (4) | |||||
| (5) |
where the function , associated with redshift bin , contains information on the halo bias, the growth function, the power spectrum normalization, and terms involved in the 3-D to 2-D projection (such as a term; see, Eq. (2)). Note that comes directly from the observations of the number counts as a function of redshift.

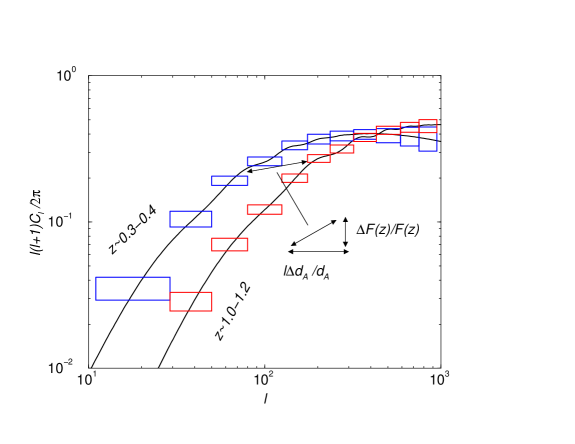
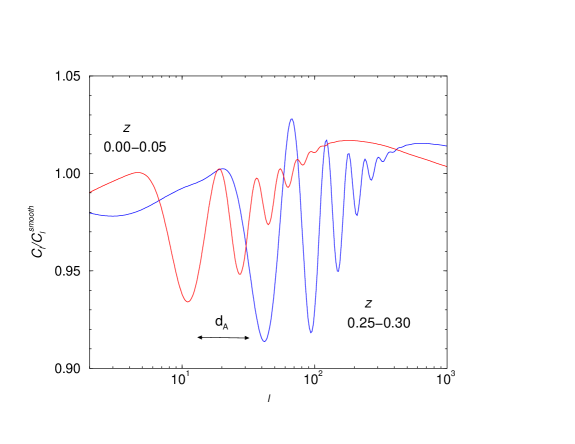
In figure 3, we illustrate the proposed test. The two curves show the halo power spectra in two redshift bins: and . The angular power spectrum corresponding to the higher redshift bin is shifted to the right in accordance to the ratio of angular diameter distances . Much of this shift simply reflects the Hubble law, . Since the physical size of the two features — the overall shape of the spectrum and the baryon oscillations — can be calibrated from the CMB, these measurements can in principle be used to determine the Hubble constant independently of the distance ladder. In figure 4, we remove the smooth curves and focus only on oscillations. It is clear from this figure that peak locations of oscillations shift in multipole space as a function of the redshift, or more appropriately, the comoving distance.
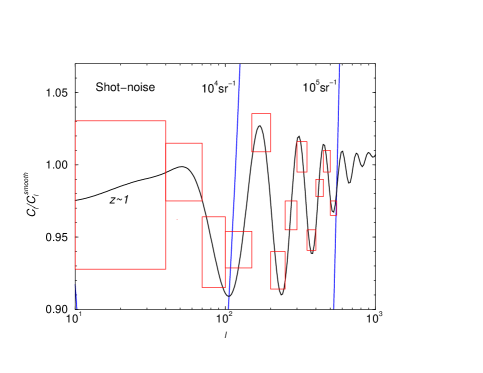
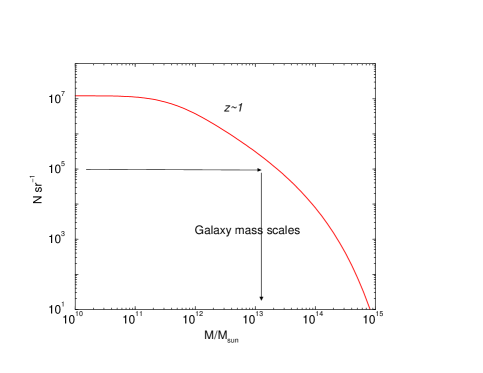
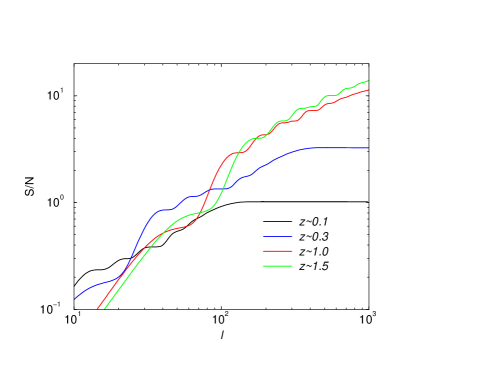
The ability to measure oscillations crucially depend on both the cosmic variance and the shot-noise associated with the tracer number counts. We illustrate this in figure 5. In the top panel we show the associated cosmic variance errors for an all-sky survey that image two-dimensional clustering at . The vertical lines correspond to errors resulting from the finite number of halos. For a reliable detection of the first three baryon oscillations, one needs a survey with a tracer surface density of sr-1 and this surface density corresponds to a mass limit of M⊙ at this redshift. The cumulative signal-to-noise ratios are illustrated in figure 6. These are the values to distinguish oscillations, which we define for this purpose as any deviation about the mean prediction for clustering in the absence of any baryons.
Note that in addition to the horizontal shift due to the change in angular diameter distance, the power spectra in figure 3 are shifted vertically due to the change in (Eq. 5). By ignoring the information contained in , the proposed geometric test in Cooetal01 is robust against uncertainties in the mass selection, mass function and linear bias. Of course, if these uncertainties are pinned down independently, both and the halo abundance in will help measure the growth rate of structure. In Cooetal01 , we discussed in detail cosmological information that can be gained from such a test using halos that will be detected in planned SZ and lensing surveys.
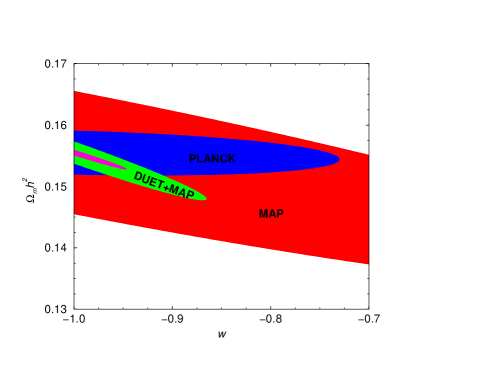
We can perform a similar test with cluster catalogs that are expected to be produced with upcoming wide-field X-ray surveys such as the one planned with the proposed DUET mission. The DUET mission plans to map the -steradians of the SDSS and the SZ deep fields to be observed with the South Pole Telescope. We show expected errors and improvements in cosmological parameters by combining the DUET clustering information with CMB data in figure 7. The DUET mission allows a detection of baryon oscillations in the projected angular power spectra of galaxy clusters at the few sigma level. This, by itself, is enough to break significant degeneracies associated with cosmological parameter measurements from CMB data. Since the combined test measures cosmology through the angular diameter distance at low redshifts, from clustered halos, and at the last scattering, from the CMB acoustic peak, the test allows one to probe not only the curvature but also relative abundances of various energy densities and properties of the dark energy.
The bottom panel of figure 7 shows errors on , the ratio of pressure to density of the dark energy component, and , from MAP and Planck, and improvements on these errors when these CMB data sets are combined with clustering information from the DUET survey. There is at least a factor of 5 improvement in error associated with . Such an improvement clearly demonstrate the need for combined studies involving large scale structure and CMB. We strongly encourage combined approaches such as the one proposed with DUET and CMB data both to understand astrophysics, mainly the presence of baryon oscillations, and cosmology, such as properties of the dark energy.
3 Acknowledgments
We thank Zoltan Haiman, Wayne Hu and Dragan Huterer for collaborative work discussed in this article. The author is grateful to the DUET science team for providing him an opportunity to contribute aspects related to a combined CMB and large scale structure data analysis. The author acknowledges support from the Sherman Fairchild foundation and the Department of Energy and apologizes, before hand, for any missed references.
References
- (1) Hu W., Sugiyama N., Silk J. 1997, Nature 386, 37.
- (2) Peebles, P.J.E. and Yu, J. T. 1970, ApJ, 162, 815; Sunyave, R. A. and Zel’dovich, Ya. B. 1970, Astrop. Space Sci., 7, 3.
- (3) Sachs, R. K., & Wolfe, A. M., 1967, ApJ, 147, 73.
- (4) Silk, J. 1968, ApJ, 151, 459.
- (5) Miller, A. D. et al., 1999, ApJ, 524, L1; de Bernardis, P. et al., 2000, Nature, 404, 955; Hanany, S. et al., 2000, ApJ, 545, L5.
- (6) Halverson, N. W. et al., 2001, preprint, astro-ph/0104489.
- (7) Tegmark, M. 1996, ApJ, 464, 35.
- (8) Netterfield, C. B. et al. 2001, ApJ in press, astro-ph/0104460.
- (9) Lee, A. T. et al. 2001, ApJ, 561, L1.
- (10) Tegmark, M., Hamilton, A.J.S. and Xu, Y. 2001, MNRAS submitted (astro-ph/0111575).
- (11) Sunyaev, R.A. & Zel’dovich, Ya. B. 1980, MNRAS, 190, 413.
- (12) Cooray, A. 2002, in 2001 Coral Gables conference on cosmology and particle physics, Eds. B. Kursunoglu & A. Perlmutter, American Institute of Physics Conference Proceedings (astro-ph/0203048).
- (13) Hu, W. and Sugiyama, N. 1996, ApJ, 471, 542.
- (14) Meiksin, A. White, M. and Peacock, J. A. 1996, MNRAS, 304, 851.
- (15) Percival, W. J. et al. 2001, MNRAS, 327, 1297; Miller, C. J., Nichol, R. C. and Batuski, D. J. 2001, Sci., 292, 2302.
- (16) Cooray, A. et al. 2002, in preparation.
- (17) York, D. G. et al. 2000, AJ, 120, 1579.
- (18) Wittman, D., Tyson, J. A., Margoniner, V. E., Cohen, J. G., Dell’Antonio, I. P. 2001, ApJ, 557, L89; Holder, G. P., Mohr, J. J., Carlstrom, et al. 2000, ApJ, 544, 629.
- (19) Haiman, Z., Mohr, J. J., Holder, G. P. 2001, 553, 545.
- (20) Cooray, A., Hu, W., Huterer, D. and Joffre, M. 2001, ApJ, 557, L7.
- (21) Press, W. H., Schechter, P. 1974, ApJ, 187, 425
- (22) Cooray, A. & Sheth, R. 2002, Physics Reports, submitted.