VLA Observations of H I in the Helix Nebula (NGC 7293)
Abstract
We report the detection of 21-cm line emission from H I in the planetary nebula NGC 7293 (the Helix). The observations, made with the Very Large Array, show the presence of a ring of atomic hydrogen that is associated with the outer portion of the ionized nebula. This ring is most probably gas ejected in the AGB phase that has been subsequently photodissociated by radiation from the central star. The H I emission spreads over 50 km s-1 in radial velocity. The mass in H I is 0.07 M⊙, about three times larger than the mass in molecular hydrogen and comparable with the mass in ionized hydrogen.
1 Introduction
Planetary nebulae (PNe) are known to contain significant amounts of molecular and neutral atomic gas, in addition to the ionized component that characterizes them. Carbon monoxide was first detected in NGC 7027 by Mufson, Lyon, & Marionni (1975), while atomic hydrogen was first detected in NGC 6302 (Rodríguez & Moran 1982). At present there are about 60 PNe detected in the millimeter lines of CO (Huggins et al. 1996) or in near-infrared H2 emission (Kastner et al. 1996). However, only about one dozen PNe have been detected in the 21-cm line (Gussie & Taylor 1995; Rodríguez, Gómez, & López 2000). It is unclear if these non detections imply that atomic hydrogen is less common than molecular hydrogen in PNe, but most likely this is just the result of contamination from line-of-sight galactic H I, confusing the detection of H I in the PNe. Indeed, the PNe detected in H I are usually at relatively high galactic latitudes or have peculiar radial velocities that allow the observer to disentangle the emission associated with the planetary nebula from that of line-of-sight H I features.
The Helix Nebula (NGC 7293, PK 36-57.1) is one of the best studied PNe, with its bright emission from ionized gas having an angular diameter of 15′, that at a distance of 200 pc (Harris et al. 1997) implies a radius of 0.4 pc. Several observations (i. e. O’Dell 1998; Speck et al. 2002) show faint emission extending over twice the angular size of the classical bright nebula. The large angular size makes it an ideal object for the study of the spatial distribution and stratification of the different components (ions, atoms, molecules, and dust) that may be present in and surrounding the PN.
O’Dell (1998) and Henry, Kwitter, & Dufour (1999) propose that the Helix nebula appears to be a thick disk of material with its plane nearly face-on. We will adopt this geometry in our discussion. In their recent study of CO emission from the Helix, Young et al. (1999) conclude that the ionized gas abuts the molecular gas, indicating strong stratification effects in the spatial distribution of the neutral and ionized components.
From the above results, O’Dell, Henney, & Burkert (2000) conclude that the Helix is optically thick to ionizing photons (i. e. ionization bound) in the plane of this disk, whereas it is probably optically-thin to ionizing photons (i. e. density bound) in directions close to its polar axis. In contrast, from observations of molecular hydrogen, Speck et al. (2002) show that the molecular species coexist with the ionized gas on a scale of 0.1-0.3 pc, and note that this requires that the basic structure of the nebula must be due to the strong stratification that occurs within individual, small-scale () inhomogeneities.
In this paper we present VLA observations of the Helix Nebula that indicate associated H I and allow the determination of the spatial distribution and of the total mass in the H I component.
2 Observations
The observations were made on 1995 January 25 using the Very Large Array (VLA) of the National Radio Astronomy Observatory (NRAO)111NRAO is a facility of the National Science Foundation operated under cooperative agreement by Associated Universities, Inc. in the DnC configuration. One IF was used for the continuum observations, with a bandwidth of 12.5 MHz, two polarizations, and centered at 1435.2 MHz. The other IF, also with two polarization, was used for the line observations, centered at the rest frequency of the hyperfine transition of H I (1420.406 MHz), with a total of 127 channels over a total bandwidth of 0.78 MHz (1.29 km s-1 per channel). After Hanning weighting, this resulted in a velocity resolution of 2.58 km s-1 per channel. The observations were centered at 24 km s-1, close to the systemic velocity of the CO emission from the planetary nebula, 23 km s-1 (Young et al. 1999) The data were edited, calibrated, and imaged using the software package Astronomical Image Processing System (AIPS) of NRAO.
2.1 Continuum Observations
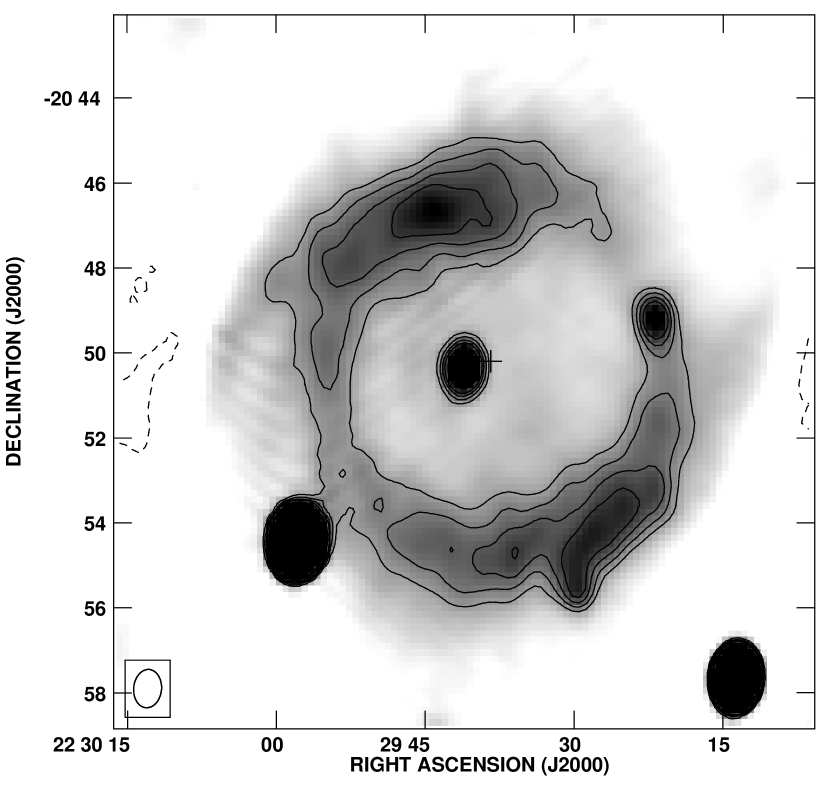
We show in Figure 1 the continuum image of the Helix at 1.4 GHz from the 12.5 MHz IF. The synthesized beam has dimensions of 5439; PA= -50. The familiar ring morphology of the PN is easily recognized. Several bright compact radio sources are also evident in the image. They are most probably background non-thermal objects. The total flux density of the Helix (obtained integrating over the face of the nebula in an image corrected for the primary beam response and with the point sources subtracted) is 0.670.03 Jy. This value seems to be significantly lower than the flux density of 1.40.1 Jy determined by Thomasson & Davies (1970) at approximately the same frequency, but (see below) we are missing flux density in our image. The total flux in H for the Helix is F(H) = 3.37 10-10 ergs cm-2 s-1 (O’Dell 1998). Assuming optically-thin emission at 1.4 GHz and in H, and an electron temperature of 104 K, the radio and optical fluxes are related by
| (1) |
We then expect, from the H flux, S(1.4 GHz)1.1 Jy. This estimate also gives a larger value than our measurement. We believe that the explanation resides in that, given the large extension of the Helix, we may be losing flux density as a result of our lack of data taken with very short baseline separations. Since smooth, extended structures are detected only with very short spacings, this undersampling makes interferometers “blind” to such structures. Indeed, for our observational parameters we expect to start being insensitive to structures larger that 15′, which is the approximate extent of the classic bright ionized nebula. We most probably do not detect very extended, faint structures, such as those reported in H by Speck et al. (2002).
Our continuum image shows that the inner part of the nebula also emits free-free radiation. In Figure 2 we show a slice made with PA = 30∘, that goes through the position of the central star and the brightest parts of the ionized shell. This slice is very similar in shape to the H slice shown by O’Dell (1998). As this and other authors have recently discussed, we find that the central region is not an empty cavity, but does contain ionized gas.
2.2 H I Observations
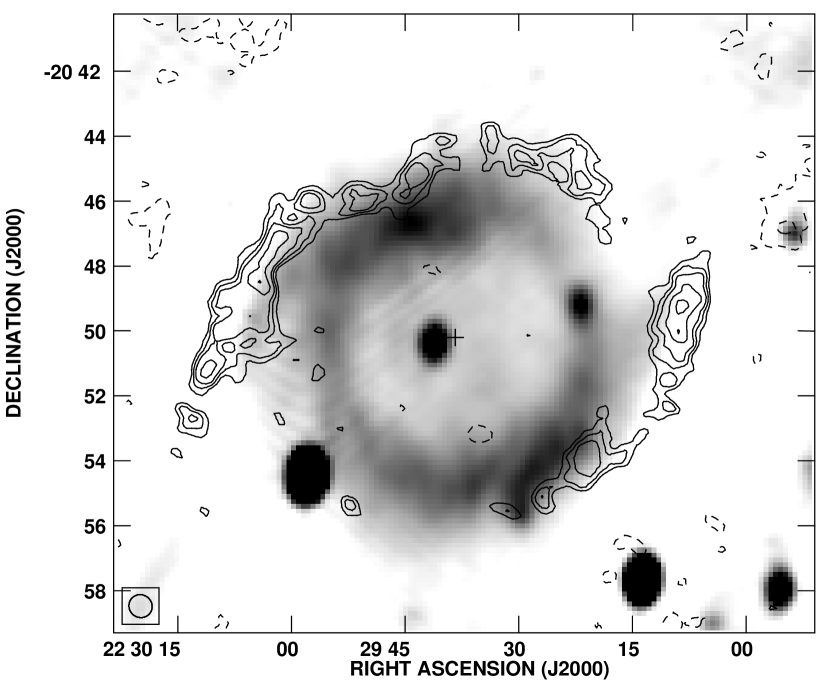
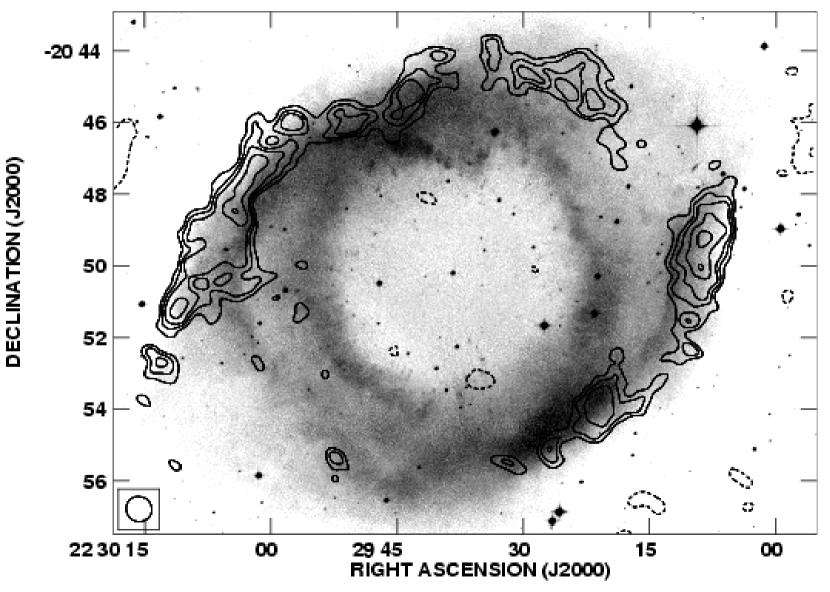
To study the H I emission we produced natural-weight images with the continuum subtracted. The resulting images have a typical rms of about 1 mJy beam-1. We detect H I emission in a region that seems to surround the ionized parts of the nebula. In Figure 3 we show a contour image of the H I emission, integrated in LSR radial velocity from 3.4 to 54.9 km s-1, the interval over which line emission is clearly detected. The synthesized beam of this image has dimensions of 4341; PA= 540). there is probably additional H I emission at LSR velocities below 3.4 km s-1, but contamination from extended H I along the line of sight makes the 3.4 to 8.2 km s-1 range very uncertain. This contour image is overlapped on the 1.4 GHz continuum free-free emission (greyscale). We conclude that the H I delineates the outer parts of the bright H II ring that characterizes NGC 7293. In particular, we do not detect H I in the region between 100′′ and 200′′ from the central star, where most of the cometary knots are located (O’Dell & Handron 1996; Meaburn et al. 1998; López-Martín et al. 2001). The observed H I is most likely the outer atomic envelope of the nebula, most probably photodissociated by the central star. To have a more accurate comparison between the neutral atomic hydrogen and the ionized gas, we made a a comparison of our H I image with the STScI digitized red image of the Second Palomar Observatory Sky Survey (POSS-II). We assumed that this red image is dominated by line emission from ionized species and that approximately traces the ionized gas. The astrometry of the image was made with the task XTRAN of AIPS. The comparison (see Figure 4) indicates that, although there is no detectable H I emission in the bright, inner parts of the ionized nebula, there is faint optical emission that seems to coexist with the H I.
We note here that the presence of continuum emission is not expected to affect our line results. At a given velocity , the brightness temperature of the line emission, , is given by
| (2) |
where is the excitation temperature of the transition, is the background brightness temperature, and is the opacity at the velocity . The largest beam-averaged brightness temperature in the 1.4 GHz image is 3 K, and we can safely assume , since the excitation temperature of H I in similar environments is 60 K.
2.3 H I in absorption
We also searched for H I in absorption toward the continuum sources in the field. Absorption features at v 0 km s-1 were detected toward several of these sources. These features are most probably due to local H I in the line of sight. Only toward the most intense source (with a flux density of 140 mJy), located at the SE of the Helix (at , see Figure 1) were we able to detect a statistically significant feature at velocities away from 0 km s-1. This feature, at a velocity of 11.1 km s-1, is shown in Figure 5. The opacity implied is about 0.03, and it is unclear if this weak absorption is associated with the Helix or with a line of sight component.
3 Discussion
3.1 The Mass in H I
In Figure 6 we show a spatially integrated H I spectrum. Since the largest beam-averaged brightness temperature in the line is 6 K (for a feature at = 15.0 km s-1, see below) and since 60 K, we can safely conclude from the equation above that the H I emission is optically-thin.
Under optically-thin conditions, the mass in H I is given by
| (3) |
where is the distance to the object and is the flux density at velocity . From the spectrum in Figure 6 we obtain = 7.90.8 and thus = 0.070.01 . The mass in ionized gas is estimated to be 0.36 by Young et al. (1999), following Gathier (1987) and assuming a filling factor of 0.75 for the ionized gas. This filling factor is the average value found by Gathier (1987) from a statistical study of PNe. However, such a filling factor is most probably too large for the Helix (thus overestimating the mass in ionized gas). Indeed, a more realistic value for this mass is that given by Boffi & Stanghellini (1994). These authors use electron densities derived from forbidden lines and H flux densities to derive an ionized mass of 0.074 and a filling factor of 0.005. Similar small values of the filling factor have been found for a few PNe (Boffi & Stanghellini 1994) and H II regions (Kantharia, Anantharamaiah, & Goss 1998). The mass in the molecular component is estimated to be 0.025 (Young et al. 1999). We then conclude that the atomic hydrogen mass is a few times the mass in molecular hydrogen and similar to that in ionized hydrogen. This result confirms the suggestion of Young et al. (1997), derived from observations of the 609 m line of neutral carbon toward the west limb of the nebula, that a significant atomic envelope was expected.
In Figure 7 we show a panel with the H I emission at different velocities. For this panel, the data were further smoothed to a velocity resolution of 3.9 km s-1. As it is the case in the CO emission (Young et al. 1999), the H I emission exhibits complex kinematics and is rather clumpy. Unfortunately, the modest signal-to-noise ratio of the H I emission precludes a detailed comparison with the CO data of Young et al. (1999). The H I spectrum shown in Figure 6 is characterized by a wide component ( 40 km s-1) with a narrow ( 3 km s-1) spike at 15 km s-1. This narrow component is located to the NW of the nebula, as can be seen in Figure 7.
3.2 Comparison of the H I with molecular data
The morphology of the H I emission shown in Figure 3 is, in general terms, similar to that observed in CO (see Figure 1 of Young et al. 1999) and in the 2.122 m s(1) line of H2 (see Figure 6 of Speck et al. 2002, reproduced in our Figure 8). In particular, once we account for the different angular resolutions of the images, there is remarkable morphological similarity between the H I and the H2 in the outer parts of the nebula. This can be seen in Figure 8, where we show an overlap of the H I emission on the H2 emission image of Speck et al. (2002).
However, both in CO and H2 there is significant emission from the inner regions of the nebula, where the cometary globules exist. This emission is absent in H I. This result could be due in part to the modest sensitivity of our H I image, but there are features that are strong in CO and H2 but remain undetected in H I. The most evident case is a bright CO and H2 component about 200′′ to the SE of the central star, that has no H I counterpart. A possible explanation for the lack of H I in association with the cometary globules (that are clearly associated with both ionized and molecular gas) is that in these objects, as a whole, there is much less atomic hydrogen than in the outer envelope. Estimates show that, indeed, more H I emission is expected from the outer envelope than from the cometary globules. Photodissociated regions are characterized by a layer of atomic hydrogen that extends to a depth of , that is, a hydrogen column density of (Hollenbach & Tielens 1997). Then, the H I mass in a region around a star will be approximately given by
| (4) |
where is the solid angle subtended by the H I zone with respect to the star and is the characteristic radius of the H I zone with respect to the star.
For the outer H I region we have 0.4 pc. From the geometric model of Meaburn et al. (1998), we estimate that the disk occupies a solid angle of order 1 with respect to the star. However, the medium seems to be clumpy and incomplete (see Figures 3 and 7) and we crudely assume that 10% of this solid angle is actually covered by gas that intercepts the ultraviolet radiation from the star. We then assume 0.1. We then crudely estimate 0.3 , which is larger but of the same order of magnitude that the measured value of 0.07 .
Now, for the location of the cometary globules we take 0.15 pc. The globules have a characteristic diameter of 0.001 pc (Dyson et al. 1989) and it is estimated that there are about 3500 of them in the Helix (O’Dell & Handron 1996). From these numbers, we estimate that 0.01. We then conclude that 0.03 , about ten times less than the value estimated for the outer region and below our detectability limit. More sensitive H I observations would be required to establish how much atomic hydrogen is present in the inner regions of the nebula.
To provide a more quantitative comparison between the spatial distribution of the ionized, atomic, and molecular hydrogen, we made (see Figure 9) a plot of the average intensity of the tracers as a function of distance from the central star. These average intensities are taken in concentric rings, each with a width of 50′′, using the task IRING of AIPS. A positive bias was subtracted from the red and H2 images, assuming that this subtraction also removes, on the average, the contribution of the stars in the fields. All three average intensities were normalized so that their highest value equaled 1. As can be seen in Figure 9, the ionized gas emission is quite bright in the central regions, rising in intensity to reach a peak at 250-300′′ from the central star. After this distance, the intensity has a gradual decline as a function of distance from the center. The plot from the red POSS-II image is consistent with the free-free cut shown in our Figure 2 and with the H slice shown by O’Dell (1998). Both H I and H2 are not detected at the center of the nebula. At more distant radii, the H2 has a first peak at 200-250′′ from the central star and then both H I and H2 peak at a radius of 350′′. The H2 mosaic becomes unreliable beyond 500′′ because of incompleteness and shorter integration times in that outer region and its average intensity is plotted only to a radius of 500′′. The average intensity of all three species drops quickly beyond 400-500′′.
The Helix nebula shows, at the same time, evidence of large scale stratification (i. e. the inner part of the nebula seems to contain only ionized gas), while at the same time showing coexistence of several species (in the outer parts ionized, atomic, and molecular hydrogen are well correlated). We suggest that this situation could be understood in terms of an inhomogeneous envelope, originally formed by a large number of neutral globules. Since the destruction time of identical globules as a result of photoevaporation is roughly inversely proportional to their distance from the central star (Störzer & Hollenbach 1999), the globules in the inner regions will soon become photoionized and form a relatively smooth continuum. At intermediate distances from the central star, there is some evidence that the original prominent inhomogenities will survive, leading to a coexistence of neutral and ionized species in well defined globules. Finally, in the outer parts of the nebula most of the globules could still be present, resulting in a somewhat smoother region where ionized, atomic, and molecular hydrogen contributions are present. The remarkable spatial coincidence of the H I with the CO and H2 in the outer ring, where significant ionization is also still present suggests that most of the observed atomic and molecular emissions arise in PDRs at the surfaces of knots and inhomogenities and not because of the presence of a global ionization front. Our model does not account for the fact that there is also H2 in an inner ring that seems to be separated from the outer molecular ring. Between these rings there is a gap in the molecular emission. It is possible that mass-loss variations during the AGB phase (Vassiliadis & Wood 1993; Steffen, Szczerba, & Schoenberner 1998; Speck, Meixner, & Knapp 2000) could lead to these concentric structures.
4 Conclusions
Our main conclusions can be summarized as follows.
1. We report the detection of 21 cm H I emission from the Helix Nebula. The mass in atomic hydrogen is estimated to be = 0.070.01 , about three times larger than the mass in molecular gas and comparable to the mass in ionized hydrogen. The H I emission covers a range of 50 km s-1 in radial velocity.
2. The H I emission seems to delineate the outer parts of the bright H II ring of ionized gas that characterizes this object. While CO and H2 are found both in this outer region as well as in a region internal to the ionized gas and related to the cometary globules, H I is detected only in the external region. We discuss a possible explanation for this difference. We believe that our observations are consistent with an inhomogeneous envelope, where the different hydrogen species can approximately coexist in some regions and show in these regions the same large-scale morphology. However, there are also significant differences, that we tentatively attribute to variations with distance from the central star, both in the nature of the ensemble of globules and in their exposure to ionizing and photodissociating radiation.
References
- Boffi and Stanghellini (1994) Boffi, F. R., & Stanghellini, L. 1994, A&A, 284, 248
- Condon and Kaplan (1998) Condon, J. J. & Kaplan, D. L. 1998, ApJS, 117, 361
-
Dyson, J. E., Hartquist, T. W., Pettini, M., & Smith, L. J.
1989, MNRAS, 241, 625
- G athier 1987 (3)
Gathier, R. 1987, A&AS, 71, 245 - Gussie and Taylor (1995) Gussie, G. T. & Taylor, A. R. 1995, MNRAS, 273, 801
- Harris et al. (1997) Harris, H. C., Dahn, C. C., Monet, D. G., & Pier, J. R. 1997, in IAU Symp. 180, Planetary Nebulae, ed. H. J. Habing & H. J. G. L. Lamers (Dordrecht: Kluwer), 40
- Henry et al. (1999) Henry, R. B. C., Kwitter, K. B., & Dufour, R. J. 1999, ApJ, 517, 782
- (9) Hollenbach, D. J. & Tielens, A. G. G. M. 1997, ARAA&A, 35, 179
- Huggins et al. (1996) Huggins, P. J., Bachiller, R., Cox, P., & Forveille, T. 1996, A&A, 315, L57
- Kantharia et al. (1998) Kantharia, N. G., Anantharamaiah, K. R., & Goss, W. M. 1998, ApJ, 504, 375
- Kastner et al. (1996) Kastner. J. H., Weintraub, D. A., Gatley, I., Merrill, K. M., & Probst, R. G. 1996, ApJ, 462, 777
- López-Martín et al. (2001) López-Martín, L., Raga, A. C., Mellema, G., Henney, W. J., & Cantó, J. 2001, ApJ, 548, 288
- Meaburn et al. (1998) Meaburn, J., Clayton, C. A., Bryce, M., Walsh, J. R., Holloway, A. J., & Steffen, W. 1998, MNRAS, 294, 201
- Mufson et al. (1975) Mufson, S. L., Lyon, J., & Marionni, P. A. 1975, ApJ, 201, L85
- O’Dell et al. (1996) O’Dell, C. R. & Handron, K. D. 1996, AJ, 111, 1630
- O’Dell (1998) O’Dell, C. R. 1998, AJ, 116, 1346
- O’Dell et al. (2000) O’Dell, C. R., Henney, W. J., & Burkert, A. 2000, AJ, 119, 2910
- Rodríguez and Moran (1982) Rodríguez, L. F. & Moran, J. M. 1982, Nature, 299, 323
- Rodríguez et al. (2000) Rodríguez, L. F., Gómez, Y., & López, J. A. 2000, RevMexA&A, 36, 51
- Speck, Meixner, & Knapp (2000) Speck, A. K., Meixner, M., & Knapp, G. R. 2000, ApJ, 545, L145
- Speck et al. (2002) Speck, A. K., Meixner, M., Fong, D., McCullough, P. R., Moser, D. E., & Ueta, T. 2002, AJ, 123, 346
- Steffen, Szczerba, & Schoenberner (1998) Steffen, M., Szczerba, R. & Schoenberner, D. 1998, A&A, 337, 149
- Störzer & Hollenbach (1999) Störzer, H. & Hollenbach, D. 1999, ApJ, 515, 669
- Thomasson & Davies (1970) Thomasson, P. & Davies, J. G. 1970, MNRAS, 150, 359
- Vassiliadis & Wood (1993) Vassiliadis, E. & Wood, P. R. 1993, ApJ, 413, 641
- Young et al. (1999) Young, K., Cox, P., Huggins, P. J., Forveille, T., & Bachiller, R. 1999, ApJ, 522, 387