The radio galaxy 3C 356 and clues to the trigger mechanisms for powerful radio sources
Abstract
We present deep near-infrared images, taken with Subaru Telescope, of the region around the radio source 3C 356 which show it to be associated with a poor cluster of galaxies. We discuss evidence that this cluster comprises two subclusters traced by the two galaxies previously proposed as identifications for 3C 356, which both seem to harbour AGN, and which have the disturbed morphologies expected if they underwent an interpenetrating collision at the time the radio jets were triggered. We explain the high luminosity and temperature of the diffuse X-ray emission from this system as the result of shock-heating of intracluster gas by the merger of two galaxy groups. Taken together with the results on other well-studied powerful radio sources, we suggest that the key ingredient for triggering a powerful radio source, at least at epochs corresponding to , is a galaxy–galaxy interaction which can be orchestrated by the merger of their parent subclusters. This provides an explanation for the rapid decline in the number density of powerful radio sources since . We argue that attempts to use distant radio-selected clusters to trace the formation and evolution of the general cluster population must address ways in which X-ray properties can be influenced by the radio source, both directly, by mechanisms such as inverse-Compton scattering, and indirectly, by the fact that the radio source may be preferentially triggered at a specific time during the formation of the cluster.
keywords:
galaxies: active – galaxies: clusters: general – galaxies: individual (3C 356) – galaxies: interactions – galaxies: photometry – infrared: galaxies1 Introduction
For a number of years, the radio galaxy 3C 356 has been considered a good test case for understanding the peculiar properties of distant powerful radio galaxies, and for using such objects to find and study distant clusters. The peculiar properties of these objects are typified by the so-called ‘alignment effect’, i.e. the tendency for their optical and radio axes to be aligned (McCarthy et al. 1987; Chambers, Miley & van Breugel 1987). Studies of 3C 356 provided one of the first examples of an alignment effect seen at near-infrared wavelengths (Eales & Rawlings 1990) and the large (4.8 arcsec) separation of the two primary aligned components (denoted ‘a’ and ‘b’ by Eales & Rawlings) made it ideal for ground-based studies. However, the picture is complicated by the fact that both galaxies display radio emission (Fernini et al. 1993) and consequently 3C 356 remains one of the very few 3C objects where the site of the powerful jet-producing central engine has not yet been unambiguously identified with a specific host galaxy. Eales & Rawlings (1990) proposed that the jet-producing engine was housed in component ‘b’ (brighter in both the radio and optical), and favoured a model in which component ‘a’ was a starburst triggered by the advancing radio source. Lacy & Rawlings (1994) extended this hypothesis by suggesting that components ‘a’ and ‘d’ (a further aligned component located on the other side of ‘b’) had undergone two episodes of star formation driven by interactions between gas clouds and precessing antiparallel jets. These ideas were strongly challenged by the detection of broad emission lines in the polarized-light spectrum of 3C 356a (Cimatti et al. 1997), indicating the presence of a bona fide AGN in this component.
The idea that powerful radio galaxies can be used to locate distant clusters of galaxies has its basis in both theory and observations. The luminosities of these objects imply the existence of extremely massive black holes at their centres, which in turn implies the host galaxies themselves are massive (e.g. Haenhelt & Kauffmann 2000; Laor 2001), a result supported by observations of radio galaxies at all redshifts. In addition, the red colours of radio galaxies and the small scatter in the -band Hubble diagram of their hosts (e.g. Eales & Rawlings 1996; Simpson, Rawlings & Lacy 1999) imply that their stellar populations are old and consequently formed at an early epoch and, in models of structure formation, galaxies form first in the most overdense regions. 3C 356 was the first distant radio galaxy to be detected in X-rays (Crawford & Fabian 1993) and when follow-up observations showed this emission to be diffuse, it was assumed that the radio source is embedded in a rich cluster (Crawford & Fabian 1996). Since then, other distant 3C objects have been detected (e.g. Worrall et al. 1994; Crawford & Fabian 1995), including the radio galaxy 3C 294 (Fabian et al. 2001), currently the most distant intracluster medium detected. Statistical studies reveal an excess of faint galaxies around the 3C radio galaxies, consistent with a richness of Abell Class 0 (Best 2000), and therefore similar to the average found for slightly lower-redshift objects (e.g. Hill & Lilly 1991; Wold et al. 2000). Yet despite the moderate number of X-ray detections and the statistical evidence, only 3C 324 has had its location in a rich cluster confirmed (Dickinson 1997), permitting a more detailed study of its environment (e.g. Kajisawa et al. 2000a,b). Nevertheless, it has been suggested (Bremer, Fabian & Crawford 1997) that the cluster environment is important in triggering and fuelling the radio source beyond merely providing a site for a massive elliptical galaxy capable of hosting a powerful radio source. The interplay between powerful radio sources and their environments therefore warrants further investigation, and 3C 356 is once again a suitable test case for such a study.
In this paper, we present (Section 2) new deep, wide-field near-infrared images of 3C 356 and new near-infrared spectra of both the principal components. We combine our imaging data with archival HST WFPC2 images in Section 3 to investigate the clustering environment of the radio galaxy. In Section 4, we reconsider the nature of galaxies ‘a’ and ‘b’. In Section 5 we discuss the X-ray properties of 3C 356 and propose a model for the triggering of powerful radio galaxies, within the framework of which we attempt to explain the properties of other well-studied powerful radio galaxies. Finally in Section 6 we provide a brief summary of our conclusions. Throughout this paper, we adopt km s-1 Mpc-1, , and . For this cosmology, 1 arcsec represents a projected distance of 8.1 kpc at the redshift of 3C 356.
2 Observations and reduction
2.1 Deep near-infrared imaging
Deep near-infrared images at and of 3C 356 were obtained with the Cooled Infrared Spectrograph and Camera for OHS (CISCO; Motohara et al. 1998), mounted at the Nasmyth focus of Subaru Telescope, on the night of UT 2000 June 17. CISCO has a field of view of arcmin square. Eight-point jittered mosaics were taken at each of four locations around the radio galaxy, to cover a square region slightly over 3 arcmin on a side.
The data were dark-subtracted and a flatfield created for each eight-point mosaic from median-filtered, object-masked images. Since the bias level of CISCO does not stabilize immediately after the telescope has nodded to a new position, only the last few images at each position were used to construct the flatfield. An attempt was made to correct for the variable bias level in the following manner. The sky level was estimated and an appropriately scaled version of the flatfield subtracted from the image. An estimate of the residual signal in each column was then determined and subtracted from that column, and the final image flatfielded. The success of this method was determined by fitting a parabola to a log-histogram of the sigma-clipped pixels to estimate the noise in object-free areas of the frame, and the procedure repeated iteratively to minimize this noise. This procedure was extremely successful for the -band data, but failed to produce an acceptable result for the first -band image at each position, and one-eighth of the -band images had to be discarded. All the images taken in each filter (which had already been sky-subtracted by the above procedure) were then mosaicked with bad pixel rejection, using offsets computed from the centroids of the brightest unsaturated objects.
The typical exposure times per point were 2560 s at and 1120 s at , while the central region received the total exposure time which was four times greater. The FWHM of the final images were 0.42 arcsec and 0.55 arcsec in and , respectively. The -band image was aligned with and then smoothed to the poorer resolution of the -band image.
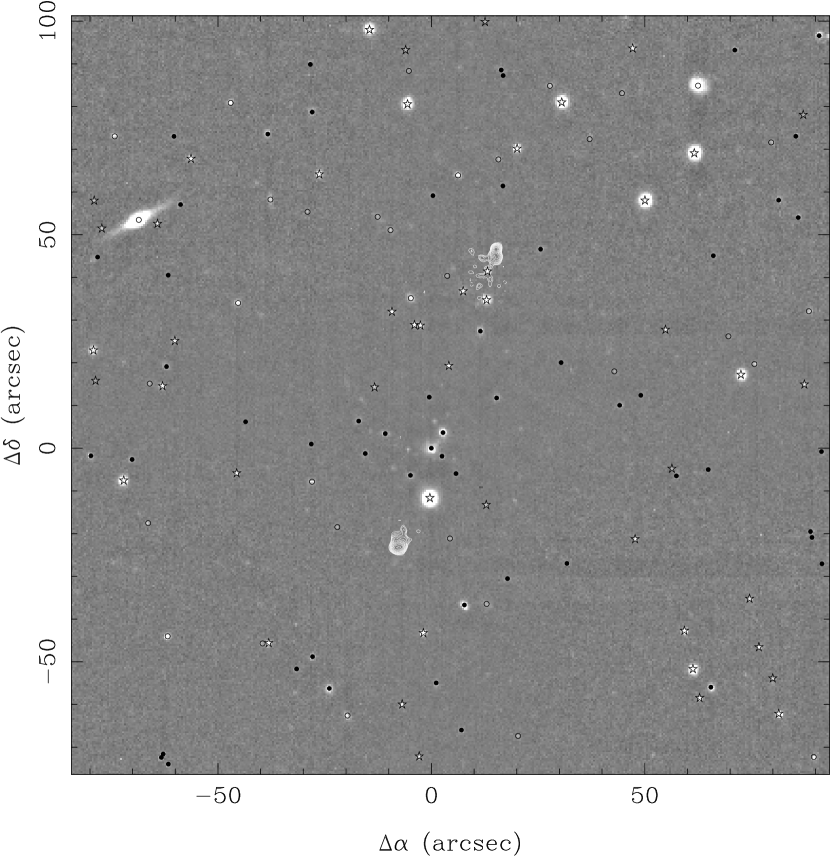
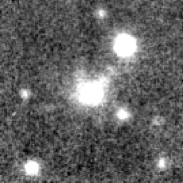
The near-infrared images were flux calibrated using the UKIRT faint standard FS 27 (Hawarden et al. 2001). While FS 27 is much bluer than a galaxy, colour terms for CISCO are negligible compared to the UKIRT photometric system (F. Iwamuro, private communication). The systematic uncertainties in the photometric calibration are mag at and mag at . With our photometric calibration, the limits in a 2-arcsec aperture are and . To ensure a similar detection threshold across the entire image, we consider only that part of the images which received at least the exposure times listed above. The -band image of this field, measuring 8.436 arcmin2 and centered approximately 9 arcsec north of component ‘a’, is shown in Fig. 1.
We also retrieved the Hubble Space Telescope WFPC2 F622W and F814W images presented in Best, Longair & Röttgering (1997) from the HST Data Archive (PID 1070; P.I. Longair). The images were combined and sky-subtracted using the iraf/stsdas task crrej. The wmosaic task was used to correct for geometric distortions so that a simple transformation between the coordinate frames of the HST and Subaru data could be made. During the longer F622W exposure, an object moved across the field of view, leaving a bright track about 2 arcsec wide. Fortuitously, this track passed through the photometric aperture of only one source, which was not affected by cosmic rays in the shorter exposure. We were therefore able to obtain a photometric measurement for this source, although the uncertainty is much larger due to the shorter exposure time.
For consistency with our near-infrared images, we also calibrate the HST images on the Vega magnitude scale, as opposed to the AB scale which is more frequently used. The offsets for the F622W and F814W filters are 0.08 and 0.36 mag, respectively, in the sense that . We do not correct for the small Galactic extinction (; Simpson et al. 1999).
2.2 Near-infrared spectroscopy
We obtained near-infrared spectra of components ‘a’ and ‘b’ on the night of UT 1999 May 13 using the CGS4 spectrograph on UKIRT. A 0.6-arcsec wide slit was used in conjunction with the 40 lines mm-1 grating in second order to provide a resolution of km s-1 at the redshifted wavelength of [O iii] 5007. After peaking up on the bright star to the south of component ‘b’, the autoguider crosshead was offset 11.3 arcsec south and 0.3 arcsec west and this star was reacquired and used for guiding during the observation. A position angle of ensured that both galaxies ‘a’ and ‘b’ were included within the slit. A total of 112 minutes was spent on source, with spectra being taken at two positions along the slit with the usual ‘ABBA’ technique (e.g. Eales & Rawlings 1993). Bad pixel masking and interleaving of the oversampled spectra was performed within cgs4dr and the 2-D spectrum was exported to iraf for further reduction. The flux scale was tied to the UKIRT bright standard HD 162208. A spatial cut of the standard star spectra revealed a FWHM of 2 pixels (1.2 arcsec), although the true seeing would be less than this due to the coarse pixel scale. Spectra were extracted along a 3-pixel (1.8-arcsec) aperture.
The spectra of components ‘a’ and ‘b’ thus extracted are shown in Fig. 2. Both components of the [O iii] 4959,5007 doublet are clearly detected in component ‘a’, but no line emission is seen in ‘b’. The flux of the 5007 line in ‘a’ is W m-2, and it is resolved spectrally with km s-1. Assuming a similar width for the narrow line emission in 3C 356b, we can place a upper limit of W m-2 on the strength of this line in our extraction aperture.
We note that the [O iii] 5007 line flux we measure for component ‘a’ alone is very similar to that determined by Jackson & Rawlings (1997) for ‘a’ and ‘b’ combined. However, Jackson & Rawlings’ spectrum was taken with 3-arcsec pixels, and therefore they had extreme difficulty in separating the line emission from the two components. Our 2-D spectrum clearly shows that all the [O iii] emission arises in component ‘a’.

3 The environment of 3C 356
3.1 Source detection and incompleteness
To investigate the environment of 3C 356, we used SExtractor V2.0.21 (Bertin & Arnouts 1996). We ran the object detection algorithm on the -band image, since this filter samples a rest wavelength of m, and use ‘two-image mode’ to obtain photometry in the other filters. Photometry was performed in 2-arcsec apertures centered on the barycentres. We adopted an object detection threshold of 10 connected pixels which exceeded the local sky level by .
We investigated incompleteness in the standard manner of taking isolated galaxies, reducing their brightnesses, and then adding them back in to the image at random positions. We estimated the completeness as the fraction of these sources which are recovered by the detection algorithm. Our catalogue is 100 per cent complete down to and drops to zero completeness by . The appropriate -correction for a present-day elliptical galaxy is ; we are therefore complete to mag fainter than (Gardner et al. 1997) at . Alternatively, a present-day 13-Gyr-old galaxy would have at , accounting for passive evolution according to the PEGASE models of Fioc & Rocca-Volmerange (1997), and we should therefore be able to detect galaxies as faint as at the redshift of 3C 356.
Since the fractional completeness is not uniform across our image at due to differences in exposure time, we restrict future discussion in this paper to those objects which lie above our completeness limit.
3.2 Star–galaxy separation

Of the 135 objects with , 74 lie within the WFPC2 field of view, and all are readily identifiable in one or both of the HST images. Of these, we classify 30 as stars based on their having a FWHM of pixels or being saturated and displaying diffraction spikes; the other 44 are all resolved. To classify the remaining 61 objects not within the WFPC2 field of view, we computed the inverse second moment of the 132 unsaturated objects, (Kron 1980), from the unsmoothed -band image and plotted this against the colour in Fig. 3. Known stars and galaxies are clearly separated in this Figure, and we classified the other objects according to their locations. Our complete sample thus consists of 88 galaxies and 47 stars.
3.3 The richness of the 3C 356 cluster


We note first the small number of galaxies in our field: the number counts of Gardner, Cowie & Wainscoat (1993) predict 130 galaxies with (approximately the same depth as our complete sample after accounting for aperture losses). This indicates the need to image a moderately wide field to obtain an accurate field correction when attempting to detect an excess of galaxies around a high-redshift object. However, the fraction of red galaxies is large; Elston, Eisenhardt & Stanford (in preparation) find that only 44 per cent of galaxies with have (S. A. Stanford, private communication), whereas we find the fraction is 56 per cent (assuming ), inconsistent at the 99 per cent level. In addition, a plot of the radial distribution of galaxies (Fig. 4a) clearly shows a highly significant excess of objects around the radio galaxy. We choose 3C 356b as the origin for investigating a radial excess as it has the brightest total -band magnitude, and is therefore presumably the most massive component.
The excess of galaxies near 3C 356 is even more significant when only the reddest galaxies are considered (Fig. 4b). We classify as ‘red’ those galaxies with ; this is the colour of a 4.3-Gyr old S0 galaxy at , according to the PEGASE models, and 4.3 Gyr is the elapsed time since a plausible formation redshift of . While the probability of 9 randomly selected galaxies all having is less than 1 per cent, all 9 galaxies within 20 arcsec of 3C 356b are this red. We label the objects above our completeness limit in Fig. 1 with symbols according to their nature.

We interpret the excess of galaxies around 3C 356, which is visible in both panels of Fig. 4, as part of a group or cluster around the radio galaxy. We confirm this in Fig. 5, where it is apparent that the galaxies which are red in are also red in , and so can only be early-type galaxies at . (It is also clear that our star–galaxy separation has worked well.)
We estimate the richness of the cluster using Hill & Lilly’s (1991) statistic. This is the excess of galaxies within 0.5 Mpc (61 arcsec) of the cluster centre and brighter than , where is the magnitude of the brightest cluster member. Hill & Lilly discuss the advantages of this method over measurements which rely on the magnitude of the third brightest cluster member, (e.g. Abell 1958; Bahcall 1981). Using our aperture magnitudes, component ‘a’ is the brighter of the two main components, and hence . Although is therefore slightly fainter than our completeness limit, we do not apply a correction as there are only 3 galaxies with and we estimate the completeness in this range to be per cent. Although Fig. 4 clearly shows an excess of (red) objects within kpc of the radio galaxy, this excess is diluted when considering a 0.5-Mpc radius circle. Based on the mean number density at projected distances greater than 0.5 Mpc, we calculate that (). The shapes of the histograms in Fig. 4 suggest that there are unlikely to be many cluster members at radial distances greater than 0.5 Mpc, which would contaminate our background counts and hence cause us to underestimate the cluster richness.
We therefore conclude (from table 4 of Hill & Lilly 1991) that 3C 356 lies in an environment poorer than Abell richness class 0, although Fig. 4 provides compelling evidence that it is not isolated. This environment is perhaps somewhat poorer than the average of moderate-redshift radio-loud AGN (e.g. Hill & Lilly 1991; Roche et al. 1999; Best 2000; Wold et al. 2000, 2001), but certainly not unusual given the large spread. However, the environment of 3C 356 represents a much poorer cluster than all 14 of the distant () X-ray selected clusters of McNamara et al. (2001), which have similar X-ray luminosities, W, to that detected by Crawford & Fabian (1993). There seems therefore to be a discrepancy between the X-ray and optical/infrared properties of the environment of 3C 356, which we will address later.
4 The nature of galaxies ‘a’ and ‘b’
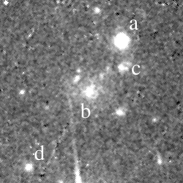
As mentioned in Section 1 there has been considerable debate concerning whether galaxy ‘a’ or galaxy ‘b’ hosts the jet-producing AGN responsible for feeding the large-scale radio emission. We reconsider the location of the radio source’s central engine in this section, and to aid the discussion we show close-ups of the region around the two galaxies in all four filters in Fig. 6.
We first consider the morphologies of both galaxies. Radial surface brightness profiles were constructed in the band and fit using the two-dimensional routine of Simpson, Ward & Wall (2000). The results are shown in Fig. 7, and we obtained half-light radii of 036 (2.9 kpc) and 161 (13.1 kpc) for ‘a’ and ‘b’, respectively. In neither case was a significant nuclear excess required to obtain a good fit. Both galaxies lie on the Kormendy relation for massive ellipticals after accounting for passive evolution in the manner of Best, Longair & Röttgering (1998), and, assuming no further merger activity, will evolve into galaxies by the present epoch. Our radius for ‘a’ is much smaller than the 09 determined by Best et al. (1998); we attribute their result to their much poorer seeing and the use of a one-dimensional fitting algorithm which is extremely sensitive to errors in the sky level and companion objects, and improperly weights the data (see Simpson et al. 2000 and Taylor et al. 1996 for more details). The profile of ‘b’ has an excess at radii , similar to that of a cD galaxy; however, a visual inspection of our image clearly reveals that this excess is not azimuthally-symmetric and is caused by filamentary-like structures emanating from galaxy ‘b’.

4.1 The location(s) of the AGN(s)
While Lacy & Rawlings (1994) favoured ‘b’ as the source of the radio jets and suggested that ‘a’ was the site of a jet–cloud interaction, later spectropolarimetric observations have revealed scattered broad line emission from ‘a’, and energetic arguments indicate that these lines originate locally (Cimatti et al. 1997). Galaxy ‘a’ is therefore a true AGN, whose optical polarization has its electric vector position angle accurately perpendicular to the axis of the galaxy’s ‘dumbbell’ structure (Best et al. 1997). The dumbbell axis is in turn roughly aligned with the radio axis and, of course, the vector joining ‘a’ and ‘b’. Together with the high optical polarization of ‘a’, these facts suggest that much of the blue emission from ‘a’ is reflected from a luminous buried quasar; this also explains the much bluer colour of object ‘a’ (, compared to for ‘b’). The discovery of weak optical polarization with a broadly similar electric vector position angle in ‘b’ could mean that some of this light is being scattered by material associated with ‘b’ (Cimatti et al. 1997). The low excitation [O ii] line emission in ‘b’ could also plausibly be excited by the quasar in ‘a’.
It is the nature of galaxy ‘b’ which is therefore unclear, and we investigate further here. We first briefly revisit the three arguments of Lacy & Rawlings (1994) to favour ‘b’ as the radio galaxy. One was based on the -band magnitudes of the two objects. According to Eales & Rawlings’ (1990) photometry, ‘b’ lay on the – relation for 3C radio galaxies, while ‘a’ was too faint. More recent data indicate that the magnitudes of components ‘a’ and ‘b’ in standard 63.9-kpc apertures are and , respectively (from the UKIRT data of Simpson et al. 1999; the increased accuracy of our Subaru data is outweighed by the uncertainty in the colours), with a small (%) amount of emission-line contamination to the broad-band magnitude of ‘a’. Both are therefore consistent with the – relation for powerful radio galaxies (e.g. Simpson et al. 1999). Lacy & Rawlings (1994) also noted the 15 displacement of ‘a’ from the line joining the radio hotspots, but this is not unusual among powerful radio galaxies (e.g., 3C 55 and 3C 265 from Fernini et al. 1993). The remaining argument of Lacy & Rawlings, which we study in more detail here, is the flat radio spectrum of ‘b’ compared to the steep spectrum of ‘a’ (Fernini et al. 1993).
Powerful jet-producing AGN have traditionally been believed to have flat-spectrum radio cores so the spectrum of ‘b’ seems typical whilst that of ‘a’ between 5 and 8.4 GHz seems unusually steep (, ; Fernini et al. 1993). However, Athreya et al. (1997) studied 12 powerful high-redshift () radio galaxies and found that three have cores at least as steep as that of galaxy ‘a’, Even allowing for the slightly higher rest-frame frequencies probed by their study, this no longer seems to be a strong argument against having ‘a’ as the source of the radio jets. particularly as its spectrum flattens dramatically below 5 GHz (; Fernini et al. 1993).
Having negated the arguments of Lacy & Rawlings (1994) against ‘a’ being the core of the radio source, we note that the observed arm-length asymmetry in 3C 356 favours it. If ‘a’ is the radio galaxy, the fractional separation distance (Bahati 1980) is , while if ‘b’ is the correct ID, . In the sample of 95 FR II 3CRR radio sources (72 radio galaxies and 23 quasars) studied by Best et al. (1995), only 4 radio galaxies and 2 quasars have , while there are 14 radio galaxies and 9 quasars with . We find similar numbers from the slightly larger sample of Arshakian & Longair (2000). We will discuss the arm-length asymmetry further in Section 4.2.2.
We also note that our new near-infrared spectroscopy clearly places ‘a’ on the [O iii]–radio luminosity correlation of Jackson & Rawlings (1997), while our limit for ‘b’ falls far below it and is a factor of below all other upper limits. We therefore reach the opposite conclusion to Eales & Rawlings (1990) and Lacy & Rawlings (1994), namely that ‘a’ not ‘b’ is more likely to be the jet-producing AGN, although only a deeper radio observation revealing jets will provide a conclusive result.
If ‘a’ is the core of the radio source, however, we are left with the problem of explaining the radio emission from galaxy ‘b’, which is several orders of magnitude more luminous than is typical of normal galaxies (e.g. Fabbiano et al. 1987). A flat spectrum suggests optically-thin thermal emission from a starburst, but the brightness temperature at a rest-frame frequency, , of 10 GHz is K, which is too high (cf. Condon et al. 1991). Alternatively, we could be seeing the turnover in a ‘normal’ starburst spectrum (i.e. thermal plus non-thermal emission) where the free–free optical depth is unity at GHz. In such a case, the observed 8.4-GHz flux is approximately equal parts thermal and non-thermal emission (equation 7 of Condon et al. 1991), and the implied production rate of ionizing photons is therefore s-1 (Condon & Yin 1990). This corresponds to a star formation rate of yr-1 (Kennicutt 1982), far in excess of the limits from the H and submillimetre emission (Archibald et al. 2001). A more plausible explanation is offered from the similarity between the ultraviolet–optical spectrum of component ‘b’ (Cimatti et al. 1997 plus our CGS4 data) and that of the LINER NGC 1052 (Gabel et al. 2000). Both are core-dominated, flat-spectrum radio sources (Wrobel 1984), and NGC 1052 is an order of magnitude less luminous in both line and radio emission, suggesting that 3C 356b is simply a scaled-up version of the low-redshift object. The implication is that the radio emission, and potentially the narrow line emission, from galaxy ‘b’ is caused by a second, separate AGN. Although it might seem perverse to demand the presence of a second AGN, very similar systems are known to exist, such as the two flat-spectrum ellipticals near the centre of the low-redshift giant radio galaxy 3C 326 (Rawlings et al. 1990), or the double-nucleus radio galaxy 3C 75 (Owen et al. 1985) and in the next section we describe how they may have been synchronously triggered.
4.2 Evidence that ‘a’ and ‘b’ suffered an interpenetrating collision
Our new deep near-infrared images of 3C 356 (Fig. 6) confirm the impression from the HST data (e.g. Best et al. 1997) that galaxy ‘b’ is highly disturbed; Best et al. suggest that this disturbance is caused by an interaction with the southern radio jet from ‘a’. We argue here that an attractive alternative explanation is that ‘a’ and ‘b’ suffered an interpenetrating collision around the time the jets from 3C 356 were first triggered.
4.2.1 Nature of the debris
Visual inspection of Fig. 6 shows that the 3C356 ‘a’ and ‘b’ system is very reminiscent of a pair of colliding galaxies (see, e.g., fig. 3 of Struck 1999). A ‘bridge’ can clearly be seen pointing from ‘b’ towards ‘a’, and there is additional emission to the north and east of ‘b’, including an arc-like feature which is bright in the optical images and a filament arcing northwards. Component ‘c’ (detected in [O ii] by Lacy & Rawlings 1994) is also between the two main galaxies.
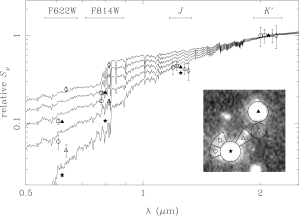
In Fig. 8 we plot the four-colour broad-band SEDs of four regions of debris, plus the galaxies ‘a’ and ‘b’. These are compared to the SEDs (from Fioc & Rocca-Volmerange 1997) of a 4.3-Gyr-old E galaxy (a good fit to galaxy ‘b’) combined with varying fractions of a 50-Myr-old (see Section 4.2.2) instantaneous starburst (note that the starburst model has an essentially flat spectrum and could therefore be equally representative of scattered quasar light). A discrepancy between the observed colours and those of the models is noted, but is hard to explain given the agreement in Fig. 5. With the exception of the very blue () component ‘c’, the rest of the debris is well-modelled by a combination where only 5–20 per cent of the -band light (and hence 1–5 per cent of the stellar mass) originates from young stars (if the normalization is made to the -band photometry, this mass fraction rises to % for galaxy ‘a’ and the region to the northeast of ‘b’). It is clear, therefore, that the extended light in the system cannot be due solely to recent star formation caused, for example, by the passage of the radio jets, but must be predominantly composed of old stars disturbed during the collision between ‘a’ and ‘b’.
While there is remarkably little discussion in the literature of what happens when two massive ellipticals interpenetrate, one important mode by which material can be ripped from a galaxy is mediated by tidal torques (e.g. Struck 1999) which obviously affects stars as well as gas, and so there seems to be no physical reason why the debris cannot be material stripped from ‘b’ (indeed, the colours of ‘b’ and the ‘bridge’ are very similar; Fig. 8). It seems far harder to find a physical process by which the disturbed structures of ‘b’ can be promoted by interactions with a radio jet. Lacy et al. (1998) present a comprehensive study of a probable jet–galaxy interaction involving the radio source 3C 441, from which it seems clear that there are significant effects on gas in a galaxy struck by a jet, but little or no effect on old stars since there is no obvious way in which the jet power can be coupled effectively to their motions.
Similarly, the red colours of component ‘d’ (which are very similar to those of ‘b’) imply that it is an old galaxy and therefore its high velocity relative to ‘a’ and ‘b’ cannot be explained by an interaction with the radio jet in the manner proposed by Lacy & Rawlings (1994). Neither can it be explained as a result of a strong gravitational interaction with the two main galaxies, since the maximum velocity which can be attained in such a scenario is km s-1, where is the combined mass of components ‘a’ and ‘b’, and is the impact parameter. Neither does component ‘d’ appear to be disturbed, although it does possess weak [O ii] emission. We are therefore left with the rather unsatisfying conclusion that it is an unrelated background galaxy.
4.2.2 Time-scales
Adopting the physical model for FR II radio sources of Willott et al. (1999), we can use the observed properties of 3C 356 to estimate its total jet power and the time since the jets were first triggered. If the jet axis makes an angle with respect to the line of sight, then equation (11) of Willott et al. yields W, where we have adopted the following ‘canonical’ values for the source and environmental parameters discussed by Willott et al.: and (see also Blundell & Rawlings 2000); and . Equation (9) of Willott et al. gives the age of the radio source as yr.
So, if the merger axis of ‘a’ and ‘b’ is close in three dimensions to the jet axis (e.g. West 1991; see also the discussion in the next section), then the point of closest approach happened yr ago, where kpc is the projected separation between ‘a’ and ‘b’, and km s-1 is the line-of-sight velocity difference. Thus, accounting for uncertainties like small () misalignments between the radio axis and the velocity vector of ‘a’, it looks highly plausible that the jets were triggered during the interpenetrating collision between ‘a’ and ‘b’, a few tens of Myr in the past. This simultaneity requires a pre-existing supermassive black hole at the centre of ‘a’, in line with the suggestion of Willott, Rawlings & Blundell (2001) that radio galaxies are undergoing a rebirth.
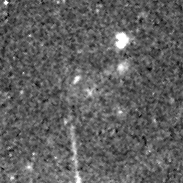
Since the fractional separation difference cannot be larger than the expansion speed of the outer radio components, (see Blundell & Rawlings 2000 for a recent discussion of expansion speeds), the large arm-length asymmetries cannot be due to light travel time effects, and the most likely cause is an environmental asymmetry. If so, the model of Willott et al. (1999) implies that the mean density to the southeast of ‘a’ is times higher than that to the northwest. Radio depolarization measurements (Pedelty et al. 1989) also indicate a denser medium to the southeast, and visual inspection of Fig. 1 suggests that this may be linked to a larger concentration of companion galaxies to the southeast, presumably associated with the group containing ‘b’.
5 Discussion
Our study of 3C 356 has led us to a model in which a powerful jet-producing AGN and a weaker, but possibly also jet-producing, AGN are stimulated in the 3C 356 system as the result of an interpenetrating collision between two massive galaxies, which occurred along an axis closely aligned with the radio jet axis. The high relative velocity of ‘a’ and ‘b’ indicate that they are not members of the same group, while the small number of companion galaxies suggests that the system will relax to a relatively poor cluster, no richer than Abell class 0. This begs two questions which we address in this section. First, how do we square these inferences with the X-ray properties of this system, which are more reminiscent of a richer cluster of galaxies? And second, can the trigger mechanism inferred for 3C 356 be generalized to other objects with powerful radio jets?
5.1 What causes the X-ray emission from 3C 356?
The ROSAT images of 3C 356 reveal the X-ray emission to be extended; while there are no significant sources in the HRI image (Crawford & Fabian 1996), the PSPC image (Crawford & Fabian 1993) tentatively suggests that the emission peaks to the north of the radio core and is extended in the direction of the radio jets. The bolometric X-ray luminosity of 3C 356 is W (Crawford & Fabian 1993, corrected to our cosmology), making it lie close to the luminosity–temperature relation for nearby clusters (Fig. 9). However, as we have seen in Section 3.3, the small number of galaxies around 3C 356 does not support the existence of a cluster with the richness implied by the X-ray temperature.
We consider the possibility that the X-ray emission from 3C 356 is a superposition of cooler, less luminous (i.e., consistent with the poorness of the optical/infrared environment) intracluster gas with an attenuated power law from the AGN in galaxy ‘a’. Crawford & Fabian (1996) estimate that no more than one-third of the observed soft X-ray emission can arise from a point source, and this would reduce the bolometric luminosity of the thermal component (which becomes cooler due to the addition of the hard non-thermal emission) by a factor of , insufficient to invalidate the arguments made at the end of Section 3.3.

We therefore turn to a scenario of merging subclusters, such as that proposed by Markevitch, Sarazin & Vikhlinin (1999) for the cluster around Cygnus A. Suggestions that radio galaxy activity and cluster mergers are related have also been advanced by Burns et al. (1993, 1994). Markevitch et al.’s model consists of two hot, massive clusters in the early stages of a merger, whereas the above arguments suggest that 3C 356 represents the late stages of a merger between two much less massive groups. Typical properties for such groups are m-3, –2 keV, and core radius kpc (e.g. Kriss, Cioffi & Canizares 1983; Mulchaey & Zabludoff 1998). When two clusters, each of mass , fall from a large distance to a separation of (which can be considered as the start of the merger), their relative velocity is km s-1 (i.e. very similar to the current line-of-sight velocity difference between the two main galaxies). From equations 1 and 2 of Markevitch et al. (1999), this results in post-shock gas with twice the temperature and slightly more than twice the density of the pre-shock material, and hence almost an order of magnitude higher emissivity (these numbers are insensitive to the exact value of the initial gas temperature). For a merger as advanced as that of 3C 356, where the two central galaxies have already suffered an interpenetrating collision, it is reasonable to assume that approximately half the gas from each group has passed through the shock front, and hence the X-ray luminosity of 3C 356 will be about an order of magnitude more than that of the original galaxy groups. Since emission from thermal bremsstrahlung has a bolometric luminosity , the merger causes 3C 356 to simply move up the luminosity–temperature relation, (Wu et al. 1999), and its X-ray properties will therefore resemble those of a single, richer cluster (this statement is true for a wide range of merger parameters). The post-shock gas has a cooling time-scale, yr, much longer than the shock crossing time, yr, and it will therefore dominate the observed X-ray emission due to its much higher surface brightness. Higher-quality X-ray data could either spatially or spectrally separate the pre- and post-shock material and are obviously desirable.
This model can also explain the alignment effect in 3C 356, as well as the tentative alignment between the X-ray-emitting gas and the radio axis. These alignments are all secondary and arise because the radio emission, X-ray emission, and galaxy interaction direction are all aligned with the direction of the cluster merger. The X-ray–merger alignment is the easiest to understand, since the X-rays arise from the gas travelling in the direction of the merger which has passed through the shock front. The line joining ‘a’ and ‘b’ will also be aligned with this direction since the collision velocity between the two merging groups is larger than the velocity dispersion of either group and so the galaxies will approach each other along a vector which is biased towards the merger axis. To explain the alignment of the radio jets, we turn to West (1994), who suggested that supermassive black holes form with their spin axes aligned with the local large scale structure, as a result of a series of highly anisotropic mergers. Since the interaction between ‘a’ and ‘b’ is unlikely to have caused any precession of the spin axis of the jet-producing black hole in ‘a’ (Scheuer 1992), when this dormant black hole is re-fuelled (see Section 4.2.2), the radio jets will align with the filament of large scale structure, along which the groups containing ‘a’ and ‘b’ are presumably merging.
We also consider the possibility that the X-ray emission is boosted in a more direct way by the radio source activity. First, as Fabian et al. (2001) note in the case of the radio galaxy 3C 294, inverse-Compton scattering of CMB photons by low- electrons can produce luminous X-rays. This mechanism requires bubbles of electrons which are spatially separated from the ultra-relativistic material visible as high-frequency radio emission, but studies of M 87 (Owen, Eilek & Kassim 2000) show that this is plausible, at least in this object. In addition, low- electrons are observed to be distributed on large scales in merging systems where it is plausible that they are re-energized by shocks which would extend their effective lifetimes (Röttgering et al. 1997). As also noted by Fabian et al. (2001), this scenario requires two bubbles of hot confining gas, which can be naturally associated with the merging subclusters in our model, and therefore also predicts an alignment between the X-ray and radio axes.
Second, Kaiser & Alexander (1999) suggested that the X-ray emission from 3C 356 may arise from gas in the intergalactic medium which has been heated by the passage of the expanding radio source. However, their fig. 10 indicates that the required luminosity of W cannot be achieved for a source with a mean arm length of kpc unless the density profile index (we know of no sources where such a flat profile has been observed) and/or the IGM density is larger than their assumed value, which is typical of 3C radio source environments at (this same value is justified by Willott et al. 1999). Since the environment of 3C 356 i somewhat poorer than this, a higher density is inconsistent with the observations. Also, Kaiser & Alexander’s model requires a higher density on the north side of the radio source since the X-ray emission peaks to the north of the core (Crawford & Fabian 1993), which is at odds with the longer arm length if the IGM is static. Our model naturally explains this apparent discrepancy if the group approaching from the south were denser (as we claim to be the case in Section 4.2.2). This gas will be the most luminous in X-rays after it has been compressed and heated by passing through the shock front to the north side. On the other hand, the radio hotspots advance much more rapidly than the slow ( km s-1) IGM and therefore work against the pre-shock material, which is denser to the south.
It seems plausible that some X-ray emission may arise from processes directly associated with the radio source, but a full consideration of all its observed properties seem to demand that 3C 356 is at the centre of a merger between two galaxy groups. The time-scales involved suggest that the radio source was triggered by the close approach, or interpenetration, of the dominant galaxies from each group, which channelled fuel onto a dormant supermassive black hole. Our observations and model are at odds with the idea of Bremer et al. (1997) that powerful radio galaxies lie at the centres of rich clusters with strong cooling flows. However, the richness of the cluster around 3C 356 is fairly typical of powerful radio sources at high redshift, and it is therefore worth investigating whether our model for 3C 356 can be applied to other radio-loud AGN.
5.2 Our model and 3C 294
The radio galaxy 3C 294 has recently been observed at high resolution in X-rays with Chandra (Fabian et al. 2001) and at near-infrared wavelengths with Adaptive Optics on the Canada–France–Hawaii and Keck Telescopes (Stockton, Canalizo & Ridgway 1999; Quirrenbach et al. 2001). The excellent quality of these data make it suitable for testing the generality of our model.
Quirrenbach et al.’s observations reveal two galaxies separated by kpc, the brighter of which has a diffuse, clumpy morphology, while the fainter is compact and is identified with the source of the radio jets. Applying the model of Willott et al. (1999) to 3C 294, we derive a jet power W, and an age of yr. This much younger age is consistent with the smaller separation of the two optical components in 3C 294, and the (rest-frame) optical properties of this system are then completely analogous to those of 3C 356 at an earlier epoch. It is also worth noting that in both 3C 356 and 3C 294, the radio source is identified with the more compact object, while it is the other galaxy which is larger and more luminous, and apparently more like a brightest cluster galaxy. This appears to be at odds with Best et al.’s (1998) suggestion that radio galaxies are (the progenitors of) cD galaxies unless the galaxy systems are always destined to merge.
The X-ray observations of 3C 294 also support a model of merging clusters. The high resolution of Chandra reveals double-lobed (‘hour-glass’ shaped) emission, not typical of a relaxed rich cluster, and more reminiscent of -body simulations of merging clusters (Roettiger, Burns & Loken 1993). Our interpretation is that we are observing gas which has been heated by two shocks propagating in opposite directions from the site of the collision. As discussed above, this produces hot, bright X-ray emission along the merger direction, surrounded by cooler, fainter, unshocked gas from the original clusters. As with 3C 356, a collision velocity of –2000 km s-1 could raise the temperature from keV to the observed 5 keV, and would result in shocks propagating at km s-1 relative to the collision site. If the two components observed by Quirrenbach et al. (2001) were at the centres of the two groups, each shock would have travelled a distance of kpc, consistent with the extent of the X-ray lobes. Since the radio source is not triggered until much later, it is possible for the shocked gas to have a larger extent than the more rapidly expanding radio lobes. Again, the major axis of the X-ray emission is broadly aligned with the radio axis, as predicted in our model (see Section 5.1). The lack of alignment between the radio axis and the line joining the two bright galaxies can be explained by the youth of the radio source, since we are seeing the two components soon after their time of closest approach.
We use the X-ray data of 3C 294 to draw two inferences which are relevant in our search for a single trigger mechanism for powerful radio sources at these intermediate epochs. First, there is no evidence for an enhancement of the X-ray emission at the edge of the radio cocoon, as predicted by Kaiser & Alexander’s (1999) model for heating of the IGM by the radio source. Second, the highly-peaked X-ray surface brightness which is the signature of a cooling flow core is not present (the weak X-ray core coincident with the radio galaxy is consistent with a heavily-absorbed power law), and therefore we do not believe that 3C 294 lies at the centre of an established cooling flow. Our model of merging clusters therefore provides the only way to explain the properties of both 3C 356 and 3C 294.
5.3 Our model and Cygnus A
Our model may also be applicable to the most luminous radio source, Cygnus A. Cyg A is the brightest galaxy in a cluster which is merging with a richer cluster (Owen et al. 1997; Markevitch et al. 1999) along an axis aligned with the radio jets. This is a qualitatively similar situation to that we have proposed for 3C 356 and 3C 294, and West (1994) noted this alignment as support for his model. The quantitative differences can be easily explained. First, the much richer environment is an inevitable consequence of hierarchical merging (Eke, Navarro & Frenk 1998), since more massive clusters will have had time to form by the later epoch. Second, the earlier stage of the cluster merger at which the radio source is created can be explained by the higher galaxy density, since it is a galaxy–galaxy interaction which provides the trigger. While there is only tentative evidence for a galaxy merger in Cyg A (see Stockton, Ridgway & Lilly 1994), there is recent star formation (Jackson, Tadhunter & Sparks 1998) whose (admittedly highly uncertain) age is consistent with the age of the radio source ( Myr). Although very violent interactions are responsible for triggering the radio sources 3C 356 and 3C 294, the weaker interaction in the case of Cyg A may still be sufficient to trigger nuclear activity, since fuel is likely to be plentiful as a result of the massive cooling flow ( yr-1; Reynolds & Fabian 1996). Unlike at , where the interaction must provide fuel and drive it into the nucleus of the active galaxy, Cyg A only requires a relatively small gravitational perturbation to disturb the reservoir of gas which is already present. We note that the weaker, yet still extremely powerful, radio source 3C 295 also lies at the centre of a massive cooling flow (Allen et al. 2001) and appears to be undergoing an interaction (Smail et al. 1997) which could provide fuel to power the nuclear accretion. We therefore offer support for the model of Bremer et al. (1997) when applied to low-redshift sources where cooling flows have been set up, and suggest that the unspecified trigger mechanism is a galaxy–galaxy interaction.
5.4 The trigger mechanism(s) for powerful radio sources
A powerful radio source requires (i) a supermassive, presumably spinning, black hole; (ii) available fuel; and (iii) a mechanism for delivering this fuel to an accretion disc around the black hole.
The formation of the black hole is likely to be accompanied by a period of AGN activity, as fuel is plentiful. This is believed to be the evolutionary state of the highest-redshift () radio sources. Since black holes are not destroyed, lower-redshift radio sources require only fuel and a suitable delivery mechanism to be triggered in a suitable host galaxy. At intermediate redshifts (), elliptical galaxies do not have large internal reservoirs of gas, and our study of 3C 356 and 3C 294 suggests that fuel can be made available and delivered by a violent galaxy–galaxy interaction which is most likely to be orchestrated by the merger of two groups or clusters of galaxies. We suggest that this is likely to be a very important, potentially dominant, trigger mechanism for powerful radio sources at these cosmological epochs. At even lower redshifts (), fuel may become readily available from a cooling flow (Bremer et al. 1997), and therefore a less violent trigger is required to perturb the gas onto the black hole.
The steep decline in the number density of extragalactic radio sources from to the present epoch (e.g. Dunlop & Peacock 1990; Willott et al. 2001) can be understood in terms of the currently-favoured low matter-density Universe as the end of the era of cluster formation via group–group mergers, and hence the end of the epoch of violent interactions which can fuel dormant black holes (see also Blundell & Rawlings 1999). It is worth pointing out that this is precisely the opposite conclusion to that reached by Fabian & Crawford (1990), who suggested that cluster mergers turned off quasars since it was then believed that and hence massive clusters formed at a much later epoch.
Our model, if applicable to intermediate-redshift radio sources in general, has an important implication for the use of radio sources to locate clusters at , as it predicts that these radio-selected clusters are likely to be merging systems. These systems are atypical and cannot be used to infer details about the evolution of the cluster X-ray luminosity function. However, proving that these systems are not simply relaxed clusters is likely to be difficult since the X-ray luminosity and temperature of these systems mimic those of a single, richer cluster (see Section 5.1). In addition, while the merger directions of radio galaxies lie close to the plane of the sky and therefore should produce elongated X-ray emission, radio-loud quasars lie in systems which are merging along axes close to the line of sight, and projection effects will make it much harder to observe evidence of a merger. Even some radio galaxies may be produced by mergers close to the line of sight, due to a combination of misalignments between the axes cluster and galaxy mergers, and between the axes of the galaxy merger and the radio emission.
6 Summary
We have demonstrated with new deep near-infrared imaging the absence of a rich cluster around the radio galaxy 3C 356, apparently at odds with the observed X-ray emission. We have proposed that the X-rays arise from shocked gas at the interface of two merging galaxy groups and that the two components of 3C 356 suffered a strong interaction during this merger, stripping material from one or both galaxies and funnelling it into the nucleus of ‘a’, which we believe is the source of the radio jets (although we believe that ‘b’ is also an AGN). We have proposed an identical scenario for the radio galaxy 3C 294, and have suggested that this mechanism may be the dominant trigger for radio sources at . We have suggested that less violent galaxy interactions may trigger lower-redshift radio sources where a cooling flow has set up a reservoir of fuel in the host galaxy. This model explains the rapid decline in the number density of these objects since , and also implies that galaxy clusters located by using radio sources will be an extremely biased sample inappropriate for learning about cluster formation and evolution. It is vital to establish the ways in which the radio source can directly influence the observed X-ray properties, and also to understand how the triggering of a radio source may be intimately related to the evolution of its environment.
Acknowledgments
We wish to thank Roberto de Propris for giving up valuable observing time to obtain the CGS4 spectra, and Adam Stanford and Curtis Struck for useful discussions. We are also grateful to Katherine Blundell for providing the radio map in Fig. 1, and the referee, Paul Alexander, for his comments. This work is based in part on data collected at Subaru Telescope, which is operated by the National Astronomical Observatory of Japan, and in part on observations with the NASA/ESA Hubble Space Telescope, obtained from the data archive at the Space Telescope Science Institute, which is operated by AURA, Inc. under NASA contract NAS5–26555. The United Kingdom Infrared Telescope is operated by the Joint Astronomy Centre on behalf of the U. K. Particle Physics and Astronomy Research Council.
References
- [1] Abell G. O., 1958, ApJS, 3, 211
- [2] Allen S. W. et al., 2001, MNRAS, 324, 842
- [3] Archibald E. N., Dunlop J. S., Hughes D. H., Rawlings S., Eales S. A., Ivison R. J., 2001, MNRAS, 323, 417
- [4] Arshakian T. G., Longair M. S., 2000, MNRAS, 311, 846
- [5] Athreya R. M., Kapahi V. K., McCarthy P. J., van Breugel W., 1997, MNRAS, 289, 525
- [6] Bahcall N. A., 1981, ApJ, 247, 787
- [7] Bahati D. G., 1980, A&A, 84, 112
- [8] Bertin E., Arnouts S., 1996, A&AS, 117, 393
- [9] Best P. N., 2000, MNRAS, 317, 720
- [10] Best P. N., Bailer D. M., Longair M. S., Riley J. M., 1995, MNRAS, 275, 1171
- [11] Best P. N., Longair M. S., Röttgering H. J. A., 1997, MNRAS, 292, 758
- [12] Best P. N., Longair M. S., Röttgering H. J. A., 1998, MNRAS, 295, 549
- [13] Blundell K. M., Rawlings S., 1999, Nature, 399, 330
- [14] Blundell K. M., Rawlings S., 2000, AJ, 119, 1111
- [15] Bremer M. N., Fabian A. C., Crawford C. S., 1997, MNRAS, 284, 213
- [16] Burns J. O., Rhee G., Roettiger K., Owen F. N., 1993, in Chincarini G. et al., eds, ASP 51: Observational Cosmology. ASP, San Francisco, p. 407
- [17] Burns J. O., Rhee G., Owen F. N., Pinkney J., 1994, ApJ, 423, 94
- [18] Chambers K. C., Miley G. K., van Breugel W., 1987, Nature, 329, 604
- [19] Cimatti A., Dey A., van Breugel W., Hurt T., Antonucci R., 1997, ApJ, 476, 677
- [20] Condon J. J., Huang Z.-P., Yin Q. F., Thuan T. X., 1991, ApJ, 378, 65
- [21] Condon J. J., Yin Q. F., 1990, ApJ, 357, 97
- [22] Crawford C. S., Fabian A. C., 1993, MNRAS, 260, L15
- [23] Crawford C. S., Fabian A. C., 1995, MNRAS, 273, 827
- [24] Crawford C. S., Fabian A. C., 1996, MNRAS, 281, L5
- [25] Della Ceca R., Scaramella R., Gioia I. M., Rosati P., Fiore F., Squires G., 2000, A&A, 353, 498
- [26] Dickinson M., 1997, in Tanvir N. R., Aragón-Salamanca A., Wall J. V., eds, HST and the High Redshift Universe. World Scientific, Singapore, p. 207
- [27] Donahue M., Voit G. M., Scharf C. A., Gioia I. M., Mullis C. R., Hughes J. P., Stocke J. T., 1999, ApJ, 527, 525
- [28] Dunlop J. S., Peacock J. A., 1990, MNRAS, 247, 19
- [29] Eales S. A., Rawlings S., 1990, MNRAS, 243, 1p
- [30] Eales S. A., Rawlings S., 1993, ApJ, 411, 67
- [31] Eales S. A., Rawlings S., 1996, ApJ, 460, 68
- [32] Eke V. R., Navarro J. F., Frenk C. S., 1998, ApJ, 503, 569
- [33] Fabbiano G., Klein U., Trinchieri G., Wielebinski R., 1987, ApJ, 312, 111
- [34] Fabian A. C., Crawford C. S., 1990, MNRAS, 247, 439
- [35] Fabian A. C., Crawford C. S., Ettori S., Sanders J. S., 2001, MNRAS, 322, L11
- [36] Fernini I., Burns J. O., Bridle A. H., Perley R. A., 1993, AJ, 105, 1690
- [37] Fioc M., Rocca-Volmerange B., 1997, A&A, 326, 950
- [38] Gabel J. R., Bruhweiler F. C., Crenshaw D. M., Kraemer S. B., Miskey C. L., 2000, ApJ, 532, 883
- [39] Gardner J. P., Cowie L. L., Wainscoat R. J., 1993, ApJ, 415, L9
- [40] Gardner J. P., Sharples R. M., Frenk C. S., Carrasco B. E., 1997, ApJ, 490, L99
- [41] Haehnelt M. G., Kauffmann G., 2000, MNRAS, 318, L35
- [42] Hawarden T. G., Leggett S. K., Letawsky M. B., Ballantyne D. R., Casali M. M., 2001, MNRAS, 325, 563
- [43] Hill G. J., Lilly S. J., 1991, ApJ, 367, 1
- [44] Jackson N., Rawlings S., 1997, MNRAS, 286, 241
- [45] Jackson N., Tadhunter C., Sparks W. B., 1998, MNRAS, 301, 131
- [46] Kaiser C. R., Alexander P., 1999, MNRAS, 305, 707
- [47] Kajisawa M., et al., 2000a, PASJ, 52, 53
- [48] Kajisawa M., et al., 2000b, PASJ, 52, 61
- [49] Kennicutt R. C., Jr., 1982, ApJ, 272, 54
- [50] Kriss G. A., Cioffi D. F., Canizares C. R., 1983, ApJ, 272, 439
- [51] Kron R. G., 1980, ApJS, 43, 305
- [52] Lacy M., Rawlings S., 1994, MNRAS, 270, 431
- [53] Lacy M., Rawlings S., Blundell K. M., Ridgway S. E., 1998, MNRAS, 298, 966
- [54] Laor A., 2001, ApJ, 553, 677
- [55] McCarthy P. J., van Breugel W., Spinrad H., Djorgovski S., 1987, ApJ, 321, L29
- [56] McNamara B. R., Vikhlinin A., Hornstrup A., Quintana H., Whitman K., Forman W., Jones C., 2001, ApJ, 558, 590
- [57] Markevitch M., Sarazin C. L., Vikhlinin A., 1999, ApJ, 521, 526
- [58] Motohara K., et al., 1998, in Fowler A. M., ed., Proc. SPIE 3354: Infrared Astronomical Instrumentation. SPIE, Bellingham, p. 659
- [59] Mulchaey J. S., Zabludoff A. I., 1998, ApJ, 496, 73
- [60] Owen F. N., Eilek J. A., Kassim N. E., 2000, ApJ, 543, 611
- [61] Owen F. N., O’Dea C. P., Inoue M., Eilek J. A., 1985, ApJ, 294, L85
- [62] Owen F. N., Ledlow M. J., Morrison G. E., Hill J. M., 1997, ApJ, 488, L15
- [63] Pedelty J. A., Rudnick L., McCarthy P. J., Spinrad H., 1989, AJ, 97, 647
- [64] Quirrenbach A., Roberts J. E., Fidkowski K., de Vries W., van Breugel W., 2001, ApJ, 556, 108
- [65] Rawlings S., Saunders R., Miller P., Jones M. E., Eales S. A., 1990, MNRAS, 246, 21p
- [66] Reynolds C. S., Fabian A. C., 1996, MNRAS, 278, 479
- [67] Roche N., Eales S. A., Hippelein H., Willott C. J., 1999, MNRAS, 306, 538
- [68] Roettiger K., Burns J., Loken C., 1993, ApJ, 407, L53
- [69] Röttgering H. J. A., Wieringa M. H., Hunstead R. W., Ekers R. D., 1997, MNRAS, 290, 577
- [70] Scheuer P. A. G., 1992, in Roland J., Sol H., Pelletier G., eds Extragalactic Radio Sources: From Beams to Jets, CUP, Cambridge, p. 368
- [71] Schindler S., 1999, A&A, 349, 435
- [72] Simpson C., Rawlings S., Lacy M., 1999, MNRAS, 306, 828
- [73] Simpson C., Ward M., Wall J. V., 2000, MNRAS, 319, 963
- [74] Smail I., Dressler A., Couch W. J., Ellis R. S., Oemler A., Jr., Butcher H., Sharples R. M., 1997, ApJS, 110, 213
- [75] Stockton A., Canalizo G., Ridgway S. E., 1999, ApJ, 519, L131
- [76] Stockton A., Ridgway S. E., Lilly S. J., 1994, AJ, 108, 414
- [77] Struck C., 1999, Phys. Rep., 321, 1
- [78] Taylor G. L., Dunlop J. S., Hughes D. H., Robson E. I., 1996, MNRAS, 283, 930
- [79] West M. J., 1991, ApJ, 379, 19
- [80] West M. J., 1994, MNRAS, 268, 79
- [81] Willott C. J., Rawlings S., Blundell K. M., 2001, MNRAS, 324, 1
- [82] Willott C. J., Rawlings S., Blundell K. M., Lacy M., 1999, MNRAS, 309, 1017
- [83] Willott C. J., Rawlings S., Blundell K. M., Lacy M., Eales S. A., 2001, MNRAS, 322, 536
- [84] Wold M., Lacy M., Lilje P. B., Serjeant D., 2000, MNRAS, 316, 267
- [85] Wold M., Lacy M., Lilje P. B., Serjeant D., 2001, MNRAS, 323, 231
- [86] Worrall D. M., Lawrence C. R., Pearson T. J., Readhead A. C. S., 1994, ApJ, 420, L17
- [87] Wrobel J. M., 1984, ApJ, 284, 531
- [88] Wu X.-P., Xue Y.-J., Fang L.-Z., 1999, ApJ, 524, 22