ROSAT X-ray observations of the dwarf galaxy Holmberg II
Abstract
We present a study of the irregular dwarf galaxy Holmberg II based on ROSAT PSPC observations (total exposure time: 22 ksec). Holmberg II is a nearby (3.2 Mpc), well–studied dwarf irregular galaxy. It is famous for its interstellar medium which is dominated by expanding structures such as HI holes and shells. We search for X–ray emission from point sources as well as for diffuse emission, down to the detection limit of the ROSAT data. Using X–ray hardness ratio diagrams we differentiate between thermal plasma and power–law X–ray spectra which helps to determine the nature of the individual sources. Correlating the X–ray data with complementary observations ranging from the far–ultraviolet to the radio regime we increase the probability of correctly identifying sources belonging to Holmberg II. We did not detect soft X–ray emission originating from hot gas within supergiant Hi shells above our luminosity sensitivity limit of (). This finding can probably be attributed to blow–out in the case of the largest holes and insufficient sensitivity (due to strong photoelectric absorption) in case of the smaller Hi holes. However we find faint X–ray sources well beyond the stellar body but within the Hi distribution of Holmberg II, which suggests the presence of X–ray binaries. This indicates that star formation has taken place across the entire gaseous disk of Holmberg II in the past, some of which may have created the structures seen in the ISM at large galactocentric radii.
1 Introduction
Holmberg II (hereafter abbreviated as Ho II) is one of the most famous examples of a dwarf galaxy exhibiting a violent, disrupted ISM, as traced by its appearance in the 21–cm Hi line (Puche et al., 1992). Hi holes are present across the entire galaxy — even well beyond Ho II’s stellar body. Puche et al. (1992) compiled a catalog of individual Hi shells. The measured radial expansion velocities (10-25 ) and diameters (100–2000 pc) indicate that most of the holes are still expanding and have ages of to yr.
Ho II has been studied at many other wavelengths as well, such as radio continuum wavelengths (Tongue and Westpfahl, 1995), optical (Rhode et al., 1999) and FUV (Stewart et al., 2000). Besides, it has been the topic of studies to determine its mass distribution and dark matter content (Bureau and Carignan, 1997) and a popular galaxy to compare numerical simulations/models of expanding Hi shells against (Mashchenko and Silich, 1995; Oey and Clarke, 1997).
Recent Hi observations, including those of Ho II, show that Hi holes are older and reach larger sizes in dwarf galaxies as compared to similar structures in more massive, spiral galaxies. Some of this can be attributed to the fact that dwarf galaxies have shallower gravitational potentials which leads, for the same observed Hi velocity dispersion, to a puffed–up disk. Hence, Hi holes can grow to larger sizes before breaking out of the disk. Moreover, dwarf galaxies lack in general differential rotation or spiral density waves (e.g., (Walter and Brinks, 1999)). In other words, once formed, structures like Hi holes in the ISM are not strongly modified and/or destroyed by large scale streaming motions.
The most straightforward way to interpret the presence of the Hi cavities is to attribute them to past stellar activity within their centers (the ’standard picture’): strong winds of O– and B–stars can create individual bubbles of pc size whereas subsequent supernova events create cavities of a few tens to hundreds of parsecs extent. In this picture, the expansion of the Hi holes is powered by the overpressure created within the coronal gas resulting from the SN explosions, e.g. (Weaver et al., 1977).
Although the standard picture of the creation of the Hi holes is widely accepted, it is not without its critics. For example Rhode et al. (1999), analyzed broad band BVR (4 detection limit: B=23 mag) and narrow band H images to search for star clusters in the centers of the Hi holes in Ho II. Based on the results derived by Puche et al. (1992) for the age and energy needed to create the Hi hole, and assuming that the stellar cluster remained a coherent structure during its evolution and using conventional initial mass functions (IMFs), they argue that these star clusters should still be detectable. As their observations revealed far less remnant clusters than expected, Rhode et al. (1999) ruled out clusters as the origin for the Hi holes in all but 6 out of 48 cases. Certainly especially the giant holes outside the optical disk of Ho II are difficult to explain since star formation currently doesn’t seem to play a dominating role at large galactocentric radii of Ho II.
X–ray observations of dwarf galaxies can be used to test the validity of the standard picture. Coronal gas within the interiors of the Hi holes might be detectable in X–rays, whereas objects related to the end points of stellar evolution – such as X-ray binaries – are expected to show up as hard X-ray point sources. Low mass X-ray binaries are prominent X-ray sources detectable even at the distance of Ho II. In the optical regime however, these objects are very faint and difficult to detect even with large telescopes. X–ray observations seem the best way forward now to further check the validity of the standard picture.
Zezas, Georgantopoulos and Ward (1999) as well as Miyaji, Lehmann and Hasinger (2001) have reported ROSAT data on the strongest X–ray source in Ho II only. Here, we perform an analysis of all sources related to Ho II within the entire field observed with the ROSAT PSPC. Sec. 2 deals with the data reduction and analysis of three pointed ROSAT PSPC observations of Ho II which we retrieved for that purpose. In Sec. 3 we introduce the X–ray hardness ratio diagram as a tool to classify the X–ray spectrum for faint sources. Our results are presented in Sec. 4, which are then discussed in Sec. 5. We summarize our conclusions in Sec. 6.
2 Data reduction and analysis
| Seq. No. | date | |
|---|---|---|
| [mm/yy] | [s] | |
| 600140p | 04/92 | 7258 |
| 600431p | 10/92 | 11607 |
| 600431p-1 | 03/93 | 3701 |
2.1 Archival Data
We retrieved 3 pointed PSPC observations towards Ho II from the ROSAT archive (see Table 1 for details). The ROSAT PSPC data were analyzed using the EXSAS software package provided by the “Max–Planck–Institut für Extraterrestrische Physik” in Garching (Zimmermann et al., 1998). All three observations were merged into a single photon event file and re–centered on the mean position: . The net integration time of the merged ROSAT PSPC data is 22566 sec, making Ho II one of deepest studied dwarf galaxies by ROSAT . The photon events were binned into the standard ROSAT 1/4 keV (also denoted as ROSAT C-band), 3/4 keV (M-band), and 1.5 keV (J-band) energy bands and a total energy band (corresponding to the pulse–height invariant (PI) channels channels 11–41, 52–90, 91–201 and 11–201). We calculated a merged exposure map for each individual X–ray image to overcome the problem of radially decreasing sensitivity and vignetting of the ROSAT PSPC.
The radius of the ROSAT PSPC point spread function (PSF) depends on the X–ray photon energy and the off–axis angle with respect to the optical axis, resulting in a varying angular resolution between and within an off–axis radius of from the optical axis. We determined the X–ray background (XRB) intensity level outside the Hi distribution of Ho II (), which we subsequently used as the “off” intensity value.
We integrated the X–ray photons of each individual source within a circular area with a diameter equal to 3.5 times the diameter of the PSF () for each individual energy band. This area covers 99% of the X–ray source photons. From this total number of photons we subtracted the contribution of the XRB, and evaluated the residual X–ray intensity level in the immediate surrounding of the X–ray source. We classified an X–ray source as detected if the number of net counts exceeded the 3 threshold above the noise set by the background level.
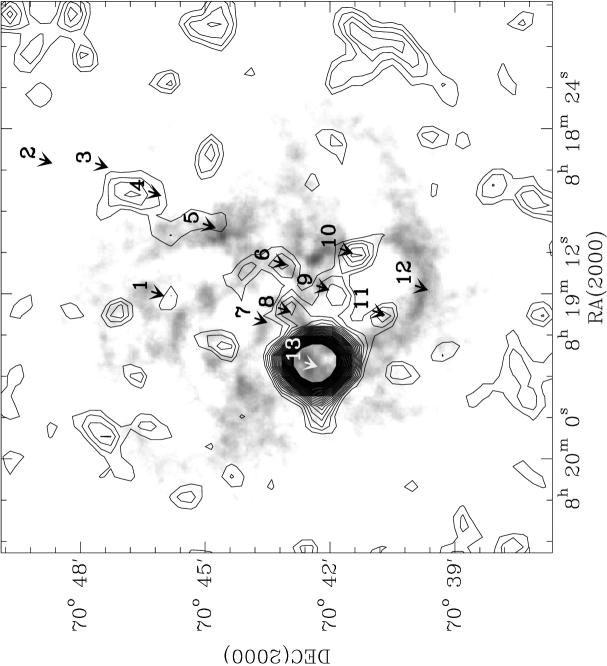
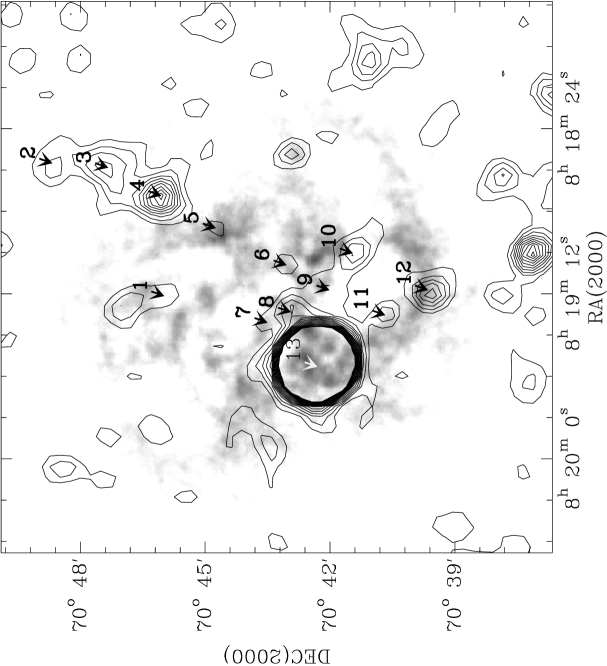
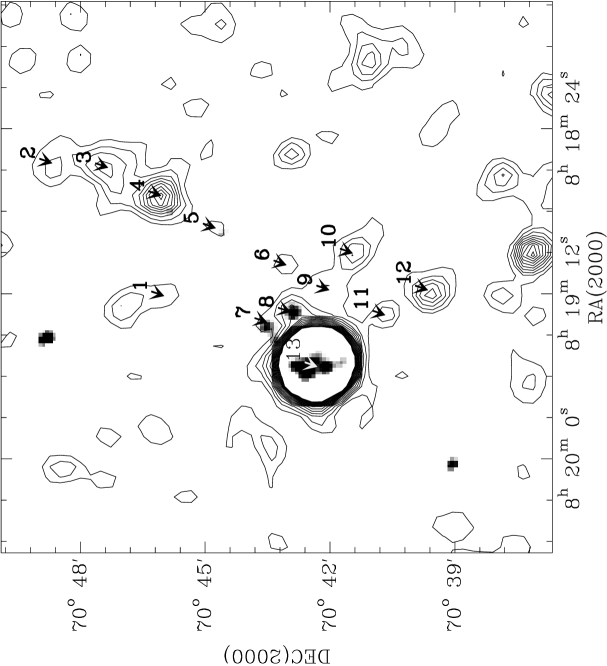
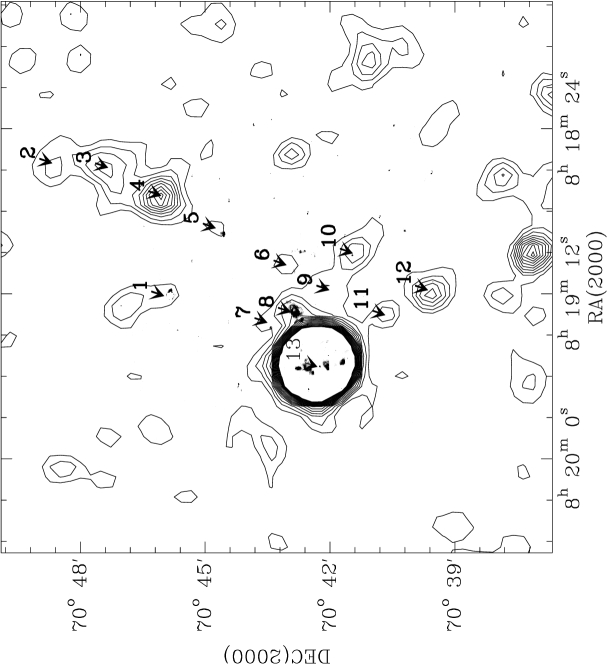
The results are shown in Fig. 1 top panel which shows the ROSAT PSPC 1/4 keV map as contours superimposed on a grey-scale rendering of the neutral hydrogen distribution (Puche et al. (1992)). The bottom panel shows the X–ray intensity distribution averaged over the entire 0.1–2.1 keV energy range. Fig. 2 displays this latter map in the top panel as contours superimposed on a 4.86 GHz radio continuum image (Tongue and Westpfahl, 1995) whereas the contours in the bottom panel are overlayed on a map of the H emission.
2.2 Confusion with cosmic X–ray background sources
The extragalactic XRB is due to the superposed emission of individual objects, mostly active galactic nuclei (AGNs) and quasi stellar objects (QSOs) (Hasinger et al., 1998; Mushotzky et al., 2000). Unfortunately, the angular resolution of the ROSAT PSPC does not allow one to resolve faint individual XRB sources, i.e., the PSPC is confusion limited. To constrain the contribution of the diffuse extragalactic XRB radiation, one has to evaluate the overall spectral characteristics of this X–ray emission component. Gendreau et al. (1996) showed that the extragalactic XRB emission can be approximated by a power–law with and . They determined an intensity of the extragalactic XRB at 1 keV of about 9.6 .
Taking this value for the XRB and assuming that the extragalactic XRB is only attenuated by the interstellar medium (ISM) of the Milky Way, we derive within the area of an individual X–ray source towards Ho II (), an X–ray flux for the extragalactic XRB of about .
So far, we have been focusing on the overall extragalactic XRB flux level. However, we have to take into account the log() vs. log() relation (Hasinger et al., 1998) to evaluate the frequency of extragalactic XRB sources at a certain flux level. Unfortunately, there is no straightforward way to discriminate between unrelated background sources and those belonging to Ho II. However, we can reduce this ambiguity by studying the X–ray colors of a source and by searching for counterparts at other wavelengths using complementary data (which is what we will do in the following). Extragalactic sources unrelated to Ho II – and absorbed by its gas distribution – will appear as hard X-ray sources, detectable preferentially in the ROSAT M– and J–band. The 3 X–ray flux level across the entire ROSAT energy band is , above the diffuse extragalactic background level. Applying the log() vs. log() relation derived by Hasinger et al. (1998) to the area of Ho II Hi gas distribution, we expect to detect about 7 significant X-ray sources unrelated to Ho II.
Assuming a distance to this object of 3.2 Mpc and a galactic X–ray attenuating column density of (Hartmann and Burton, 1997), we derive a detection luminosity threshold of for sources associated with Ho II (neglecting for the moment absorption within this galaxy). Only very young supernova remnants or accreting X–ray binaries typically exceed this threshold. The ROSAT PSPC X–ray data presented here therefore trace only two extreme populations in Ho II: the actual ( yr, i.e., supernova remnants) or a population older than yr, such as pulsars or accreting X–ray binaries. The intermediate age stellar population can be traced via H and far-ultraviolet (FUV) observations (Stewart et al., 2000). Combining all data provides a unique picture of the star formation history of Ho II over the last 100 Myr.
3 The Hardness Ratio Diagram
In this section we will introduce a useful tool to constrain the spectral properties of faint X-ray sources. Using this tool it becomes possible to estimate whether the spectrum of a (faint) X–ray source is predominantly characterized by a thermal emission spectrum or rather by a power–law. We will first discuss briefly the characteristics of those sources likely to be encountered in our object and then proceed to explain what we call the Hardness Ratio Diagram and where these different sources are likely to be encountered in these diagnostic diagrams.
Supernova remnants are characterized by their thermal plasma radiation. Below a temperature of K, emission lines dominate the X–ray spectrum. Above this temperature, Bremsstrahlung is the most important cooling mechanism of the hot plasma. The cooling time of the plasma can be approximated via where is the total number of particles, is the hot plasma temperature in [K], the ion density, the electron density, both in [cm-3] and the normalized cooling rate (Sutherland and Dopita, 1993). This leads to yr, assuming a temperature of K and a typical electron density of about . The expected X–ray luminosity of a single young SN is (Fabbiano, 1996).
Core–collapse SN are correlated in space and time, their progenitor having been formed in groups, OB associations or even larger conglomerates. Expanding individual supernova remnants are therefore likely to merge, creating expanding shells referred to in the literature as super-bubbles or supergiant shells which are supposedly filled with tenuous, high temperature gas. These shells show up in Hi maps as holes in the neutral hydrogen distribution. In the case of Ho II the largest holes have diameters roughly twice the scale height of the Hi disk of 600 pc, according to Puche et al. (1992). The cooling time of the coronal gas within the interior of the shells is much longer than the ages of the Hi holes which should make them detectable in X–rays. However, the largest super-shells, with diameters exceeding 1 kpc, likely broke out of the disk, at which moment the hot gas interior is vented in to the halo, the hot plasma is lost and the hole becomes invisible in X–rays. In the case of the smaller, still confined holes, the interior X–ray emission should be detectable if the Hi column density of the approaching side of the Hi shell does not exceed values of cm-2, above which value the soft X–ray emission ( keV) of the hot gas is absorbed in situ by the shell.
Pulsars, cooling neutron stars as well as accreting X–ray binaries are the very end points of stellar evolution and may be observable within the interior of the holes, under the assumption that the origin of the holes is caused by star forming activity and subsequent rapid stellar evolution of the most massive stars. Their X–ray luminosities typically range between –.
To identify the emission mechanism of an X–ray source the standard procedure is to extract a spectrum from the X–ray data. The brightest source associated with Ho II has previously been studied in this way by Zezas, Georgantopoulos and Ward (1999). However, due to the large number of free parameters, even the analysis of this high signal–to–noise X–ray spectrum is not without its ambiguities.
In the case of faint X–ray sources ( ), which are discussed here, the insufficient signal–to–noise ratio does not allow us to extract much information from the ROSAT PSPC spectra. However, the count rates within the individual broad ROSAT energy bands contain significant information about the X–ray source spectrum. We therefore decided to study the hardness ratios to constrain the X–ray emission process. For this aim, we subtracted the contribution of the extragalactic X-ray background emission from the count rates of the individual X-ray sources. In Fig. 3 we plot the ROSAT hardness ratio 1 (HR1) () versus the ROSAT hardness ratio 2 (HR2) (). The stronger the photoelectric absorption the harder the resulting X–ray spectrum. The lines in the figure indicate the locus where one can expect individual sources to fall in the hardness ratio diagram, depending on the type of X–ray emission, either thermal or power–law, over a range of temperatures and power–law indices, respectively, and over a range of foreground absorptions. This latter effect is quite comparable to the reddening caused by intervening dust in an optical color–color diagram.
The relations displayed in Fig. 3, both for the power–law (solid lines) as well as the thermal plasma spectra – assuming solar metal abundances – (dashed lines), are plotted for increasing absorbing foreground column density (from left to right and ). The leftmost relation of both the power–law or the thermal case represents the un-absorbed situation. The numbers along the tracks for (which corresponds to the absorbing foreground column density corresponding to the Milky Way; (Hartmann and Burton, 1997) give the spectral slope for the power–law spectra (solid lines) and log([K]) in case of the thermal plasma spectra. Obviously, soft X–ray sources will predominantly be found in the lower left part of the X–ray hardness ratio diagram, whereas highly absorbed or intrinsically hard X–ray sources populate the upper right part of the diagram.
4 Results
In total we detected 31 significant X–ray sources within the extent of the Hi distribution of Ho II. As mentioned earlier, only 7 X-ray sources are expected, based on the log() vs. log() relation derived by Hasinger et al. (1998). To avoid any confusion with unrelated extragalactic XRB sources, we decided to study only those X–ray sources which are identified in at least one additional frequency range. This complementary information also gives us a better handle on the nature of the X–ray source in question. This left us with 13 sources, all believed to be related to Ho II. The properties of these 13 sources (positions, fluxes, luminosities, complementary data) are listed in Table 2. We mark those sources with an “x” which emit significant soft (1/4 keV) X–ray photons, implying that they are most likely associated with Ho II. Because a background X-ray source will be attenuated by the entire amount of ISM belonging to Ho II, this leads to strong photoelectric absorption, reducing especially the soft part of the X-ray spectrum. We tried to constrain the X–ray emission process further by studying the spectral properties of the X–ray sources via the hardness ratio diagram (Sec. 3).
4.1 X–ray sources inside Hi holes
The ROSAT 1/4 keV map (Fig. 1) shows the emission which is most likely associated with X–ray plasma radiation. Because of the fairly high luminosity limit of the ROSAT observations (), supernova remnants are the most likely candidates to be encountered.
The X–ray sources #6, #7, #9, #10 and #13 are associated with Hi holes cataloged by Puche et al. (1992) their centers are located within the extent of the Hi holes (for details see Table 2). Although these soft X–ray sources are located within the low volume density cavities of Ho II, one cannot exclude a chance association with an extragalactic X–ray background source. The X–ray sources which most probably belong to Ho II should be detectable simultaneously in the radio and/or the optical regime. Sources #7, #8, and #13 are positionally coincident with radio continuum emission (see Fig. 2(top) and also Tongue and Westpfahl (1995)).
According to Tongue and Westpfahl (1995) the X–ray source #7 (Hi hole No. 36) coincides with a steep spectrum non–thermal radio source. In Fig. 4 we plot all X–ray sources brighter than in a hardness ratio diagram similar to the one presented in Fig. 3. This suggests for source #7 a steep X–ray energy power–law spectrum (), implying an accreting X–ray binary system as a likely source of the radiation (White, Swank and Holt, 1983). Tongue and Westpfahl (1995) favor an extragalactic origin, unrelated to Ho II, because they interpret the steep radio continuum spectrum as an indication for spectral aging of the electron population which is frequently discussed in the framework of evolutionary models of radio galaxies. However, the X–ray as well as the positionally coincident radio continuum source fits very well within the Hi hole No. 36 of the Puche et al. (1992) catalog. Moreover, close to X–ray source #7 a small Hii region is located (Fig. 2). One may speculate that this Hii region and associated H emission is due to secondary star formation, on the rim of Hi hole No. 36 (Puche et al. 1992).
The X–ray sources #6, #9 and #10 are not exactly coincident with H or radio continuum emission. However, H and radio continuum radiation is present within the diameter discussed earlier which is why we included these sources in our analysis. Close to the southern boundary of #6 (Hi holes No. 22 and No. 23), H and thermal radio continuum emission indicates the presence of a patchy star forming region. The FUV data of Stewart et al. (2000) suggest a young star forming region with an age of 2.5 – 3.5 Myr. Inspection of Table 2 of Rhode et al. (1999) supports the view that X–ray source #6 (positionally coincident with Hi hole No. 22) is associated with a stellar cluster.
The X–ray sources #9 (Hi hole No. 29 and No. 32) and #10 (Hi hole No. 21) are associated with faint H and FUV emission at their rims. The FUV data implies an age of Myr (Stewart et al., 2000). This is consistent with the findings based on the X–ray hardness ratio diagram (Fig. 4) and suggests power–law spectra for both X–ray emitting sources. Their X–ray luminosities of a few classify both as likely candidates of accreting binary systems (White, Swank and Holt, 1983).
4.2 X–ray sources outside Hi holes
Sources #1, #5, #8 and #11 are located outside Hi holes, towards high column density regions of Ho II. The accidental association with an extragalactic XRB source becomes much less likely, because of the strong attenuation of a possible unrelated extragalactic soft X–ray source by the significant amounts of X–ray absorbing matter within Ho II (in addition to the roughly constant absorption due to the Milky Way).
Source #1 is associated with bright H and FUV emission, however it is not detected in radio continuum maps. This can be interpreted as an indication for a developed star cluster with evolved stars, which already partly left the main sequence. The FUV data implies an age of Myr. The X–ray emission is too faint to set constraints on the most likely X–ray emission process, even when employing the hardness ratio diagram. So, no firm conclusions as to the nature of the source can be derived from the available data.
Source #5, which shows X–ray emission at the 3 level, coincides with a radio continuum source. Tongue and Westpfahl (1995) derived a thermal radio continuum spectrum for that source from their multi–frequency analysis. This is consistent with the H map (bottom panel of Fig. 2) which shows a compact Hii region at this position. Therefore the most likely conclusion regarding the nature of this source is that of a young star forming region.
Source #8 emits thermal radio continuum emission as well. This is consistent with the H map of Ho II (Fig. 2) which reveals a very prominent Hii region at this location. The linear extent of the Hii region is of order 100 pc. The X–ray hardness ratio diagram also implies a thermal origin of the detected X–ray emission (log([K]) 7). A single luminous O star has a luminosity of about in the ROSAT X–ray energy window (Kudritzki et al., 1995). Therefore, we would require a contribution by several hundred young stars in order to account for the observed X–ray emission. Because the radio continuum spectrum is thermal in nature, the region has to be very young as otherwise supernovae and their remnants would start to dominate the radio continuum spectrum with a non-thermal component.
Taking into consideration that the H ridge related to source #8 is located between the boundaries of two Hi holes (No. 29 and No. 36), very recent induced star formation may be taking place here. Stewart et al. (2000) derived an age of 3.5 – 4.5 Myr for that particular region, consistent with the presence of a young massive star forming region. Additional evidence for a stellar cluster is provided by the optical search for stellar emission within the Hi holes performed by Rhode et al. (1999) who report that a stellar cluster may underlie the nearby Hi hole No. 36.
X–ray source #11 is of interest because the analysis of Stewart et al. (2000) implies a young star forming region, with an age of 2.5 – 3.5 Myr, whereas this region is not detected in the H map. Its location in the X–ray hardness ratio diagram implies a power–law X–ray spectrum, indicating an accreting compact object. Both the absence of H radiation and the X–ray data suggest that towards this high column density region we observe more likely the end point of stellar evolution, like an X–ray binary.
4.3 X–ray sources outside the stellar disk
Sources #2, #3, #4 and #12 are located far beyond the stellar distribution. Sources #2 and #4 are associated with faint radio continuum emission. Both sources are prominent within the ROSAT 3/4 keV and the 1.5 keV energy band, whereas in the 1/4 keV map they are only seen at the level. This indicates that both sources have a hard intrinsic X–ray spectrum or, alternatively, are highly absorbed X–ray sources. The hardness ratio diagram implies in the case of source #2, that its emission may be associated with thermal plasma radiation. In the case of source #4 it is not possible to differentiate between a power–law and a thermal plasma X–ray spectrum.
Source #3 is located in between both sources. These three sources appear in the X–ray map as a coherent structure. Source #3 is visible at high signal-to-noise level in the ROSAT 1/4 keV map (Fig. 1). Together with the fact that it is situated towards high Hi column densities suggests that this source is associated with Ho II and not located beyond its column density distribution. This is the reason why we decided to include this source in Table 2. However, the complementary data do not reveal any obvious counterpart for source #3.
Finally, source #12 is located towards a high Hi column density region of Ho II. Neither in the radio continuum nor in the H map (Fig. 2) is there any emission associated with this particular source. The FUV map of Stewart et al. (2000), however, revealed excess emission positionally coincident with this particular source. Quite comparable to the case of source #11 (see discussion above) the analysis of Stewart et al. (2000) argues for a young star forming region of 2.5 – 3.5 Myr, whereas the X–ray data does not exclude the possibility that an end point of stellar evolution may account for the observed X–ray emission. This hypothesis is furthermore supported by the absence of H emission. The X–ray luminosity of source #12, with , is compatible with both a supernova remnant or an accreting binary system.
4.4 The brightest X–ray source in Ho II
The brightest X–ray source, labeled #13 in this paper, has been the subject of papers by Zezas, Georgantopoulos and Ward (1999) and Miyaji, Lehmann and Hasinger (2001). This source dominates the entire X-ray emission of Ho II, because 87% of all detected photons emerge from this unique object. Without its contribution the total X–ray luminosity of Ho II would only be about , which is equivalent to the added X-ray luminosities of about six high mass X-ray binaries. In this respect Ho II is not a spectacular object in X-rays. Here we reanalyze this object using the X–ray hardness ratio diagram. This source can be very well approximated by a single–component thermal X–ray spectrum with a temperature of log([K]) = 7.0 and an absorbing column density of (the dashed line to the very right). The neutral hydrogen column density of (dashed line with the log([K]) values) does not fit the hardness ratios of source #13 within the uncertainties. This implies that source #13 is located within a low density cavity within the interstellar medium of Ho II, as at least is due to Galactic foreground extinction, leaving at most to any residual column density of gas belonging to the gaseous body of Ho II along the line of sight to source #13. Comparing the plasma temperature based on the X–ray hardness ratio diagram with the results of Zezas, Georgantopoulos and Ward (1999), our temperature value falls in between the extreme temperatures derived by them. The X–ray attenuating column density implied by the X–ray hardness ratio diagram, however, is significantly lower than that derived by these authors.
If one wanted to explain the hardness ratios of source #13 with a power–law spectrum one would have to assume that the X–ray spectrum of this source is highly absorbed (see Fig. 3). None of the four plotted tracks representing the power–law X–ray spectra fit the position of source #13 in the hardness ratio diagram. Inspecting Table 2 of Zezas, Georgantopoulos and Ward (1999) shows that a power–law X–ray spectrum would require an absorbing column density of about , implying that according to the of Puche et al. (1992), source #13 would have to be located on the far side of Ho II or deeply embedded within a molecular cloud.
To constrain the nature of source #13 further, we consider the X–ray luminosities of likely X–ray emitting candidates. Accreting binaries have typical luminosities of . Source #13 however has . On the other hand, several supernova events are observed with reported X–ray luminosities of (Fabbiano, 1989; Fabian and Terlevich, 1996). The supernova hypothesis appears to be a more likely explanation than a highly unusual X–ray binary system, which exceeds the Eddington limit. The supernova hypothesis is further supported by the radio continuum data (Tongue and Westpfahl, 1995). They classified a positionally coincident radio continuum source as a supernova remnant.
Partial support for this interpretation comes from Miyaji, Lehmann and Hasinger (2001) who applied a wobble correction to the ROSAT HRI image of Ho II and claim that 25% of the emission from this source is due to an extended component with a diameter of order . Their ASCA data reveal, in addition to confirming a soft component which they attribute to (multiple) supernovae, a power–law component accounting for most of the flux density beyond 2.5 keV, implying the presence of an intermediate–mass black hole. A more definitive description of the nature of source #13 will have to await CHANDRA or XMM–Newton.


5 Discussion
5.1 Unresolved Sources
A casual inspection of Fig. 4 shows that most of the X–ray sources of interest lie above the track with which is in excellent agreement with what is expected from foreground extinction due to the Milky Way (Hartmann and Burton, 1997). This is an important result as it implies that the X–ray sources are not deeply embedded within the interstellar medium of Ho II.
Of the five X–ray sources located within the interiors of Hi holes cataloged by Puche et al. (1992), two of them appear to be associated with supernova remnants (#7 and #13), one can be identified with a young star-forming region (#6) and the remaining two are most likely associated with the end points of stellar evolution, more specifically accreting X–ray binaries (#9 and #10).
Four X–ray sources are located towards high column density regions of Ho II. Because of their location in the soft part of the X-ray hardness ratio diagram, and given that they would have been fully absorbed if they were located beyond the high column density regions, they must be in front of most of the Hi and hence it is likely that they are sources related to Ho II. One may be associated with an evolved stellar cluster (#1), two with young star forming regions (#5 and #8) and one with an accreting X–ray binary system (#11).
We find four X–ray sources which are located far beyond the stellar body and close to the edges of the Hi column density distribution of Ho II. All sources are either supernova remnants or X–ray binaries. The importance here is that even though there is no evidence based on optical imaging (Rhode et al., 1999) of past star formation, this implies that star formation has occurred some yr ago at large galactocentric radii. This suggests that in general the supergiant Hi holes may indeed be residuals from energetic events associated with past star forming activity of Ho II, on timescales yr.
As most sources are too weak to derive an X–ray spectrum, we developed a classification based solely on the hardness ratio diagram. The faintest source analyzed in this way has an X–ray flux of only . Although not conclusive, the hardness ratio diagram allows a separation between sources with thermal and power–law spectra.
To reach a firmer conclusion as to the nature of the X–ray sources we combined all available information ranging from the X–ray to the low–frequency radio regime. All but one of the X–ray sources, #2, are associated with FUV emission, as presented by Stewart et al. (2000), confirming their spatial correlation with regions of recent, massive star formation.
Some of the X–ray emission of Ho II is associated with Hii regions. This correlation remains somewhat tentative, however, as we have to take into account that the X–ray detection threshold is high, strongly selecting only the brightest star forming regions. More sensitive CHANDRA and XMM–Newton observations will overcome this instrumental limitation. In the case of X–ray source #8, the H, radio continuum and X–ray data indicate independently the presence of a massive star forming region. Because of its location in between two prominent Hi holes, we speculate that one of the holes might be re-heated by a recent supernova event (X–ray source #7); one may then further speculate that this is evidence for induced star formation.
5.2 Extended Emission
The ROSAT observations reported here did not reveal any hot gas associated with the Hi holes. At first sight this might seem remarkable. For example, in the Milky Way several hot–plasma filled HI cavities are known. The most prominent one is the local bubble which encloses the Sun (Sfeir et al., 1999). Its X–ray emission is very soft (log([K]) 6.0) and faint. However, its pressure of is a factor of 2 to 5 higher than that of the neutral clouds located within the cavity. Hence, this local cavity presumably is a low volume density region produced by several supernova events, the latest supernova event dating back to years. Another interesting Galactic feature is the X–ray bright super-shell known as Loop I or North Polar Spur (Egger and Aschenbach, 1995). Loop I has a diameter of about 300 pc. Its temperature is log([K]) = 6.7, much higher than that of the local X–ray plasma. It is highly over pressured () and still expanding.
Observed with ROSAT from a hypothetical vantage point, such as an external galaxy, both X–ray features would have remained undetected because the photoelectric absorption of the enclosing thin neutral shell with is sufficiently high for the X–ray photons originating within the interior of the shell to be absorbed. The only extragalactic detections of hot gas in super-bubbles claimed thus far are restricted to dwarf galaxies. Examples are the supergiant shell LMC 4 (Bomans, Dennerl and Kürster, 1994), and the super-bubbles N 44 and N 11 (Chu et al., 1993; Mac Low et al., 1998), all three situated in the LMC. Other examples are the supergiant shell SGS 2 in NGC 4449 (Bomans, Chu and Hopp, 1997) and the possible super-shell near Holmberg IX (Miller, 1995).
Recently Walter et al. (1998) detected marginally extended X–ray emission coinciding with a supergiant shell in IC 2574 in a pointed ROSAT observation. They found an X–ray luminosity ( = 3.2 Mpc) of erg s-1. Assuming, as usual, a Raymond–Smith model (Raymond and Smith, 1977) they derived a plasma temperature of log( and an internal density of cm-3. The internal pressure of K cm-3 is again much higher than the pressure of the ambient warm neutral and ionized medium ( K cm-3) which led them to suggest that it is probably this hot gas which is still driving the expansion of the shell (see e.g., Weaver et al. (1977)). However, follow–up observations with CHANDRA indicate that the ROSAT source is more compact. In short, only few, possibly pathological holes, are detected in X–rays.
We should not be too surprised as several authors have pointed out that the X–ray luminosity of the thermal gas expected to fill the super-bubbles is well below the ROSAT detection limit (Chu and Mac Low, 1990; Chu et al., 1995; Mac Low et al., 1998; Silich et al., 2000) The expected X–ray luminosity can be written according to Martin and Kennicutt (1995) (their Eq. 6) see also Silich et al. (2000))
where L38 is the mechanical energy expressed in units of erg s-1, the ambient density in atom cm-3, t6 the age of the super-bubble in Myr and a dimensionless scaling factor for the classical conductivity (). The metalicity also influences the luminosity in the X-ray domain. According to Sutherland and Dopita (1993) the dependence of on can be approximated by . In example, in a low metalicity interstellar medium with the expected X-ray luminosity of an X-ray plasma will only be reduced by a factor of three, not by an order of magnitude. In the case of Ho II (metalicity: about 0.25, Hunter and Gallagher (1985)) the expected X-ray luminosity will only be marginally reduced. The “standard supernova” described by Eq. 5.2 will expand into an ambient neutral medium, with a typical density ranging between . The age of an expanding structure can be estimated from Hi (Puche et al., 1992) and FUV data (Stewart et al., 2000) to a few tens of years. Taking Puche et al. (1992) values of the total mechanical energy needed to create the holes of , we can calculate the range of expected X-ray luminosity from Eq. 5.2. Assuming a conductivity of at least gives a range of . According to (Puche et al., 1992) and (Stewart et al., 2000) the mechanical energy ranges between . This leads to predicted values of L. A supernova remnant evolving within a high volume density environment has the highest probability to be detected in X-rays with ROSAT. As an example, source #7 and Hi hole No. 36 are positional coincident, using (Stewart et al., 2000) and (Puche et al., 1992) gives . With and we derive . Given the overall uncertainties this is in good agreement with the observed value (, see Table 2). In a more typical low density environment the X-ray luminosity is only of order , i.e., below the sensitivity of our ROSAT data.
What does this imply? Simply put, the vast majority of super-bubbles are far too faint to have been detected by ROSAT. Those which have been are in some sense peculiar. One method to boost the X–ray luminosity, and increase the X–ray emitting lifetime, would be to invoke mass loading (Arthur and Henney, 1986). Besides, there remains the possibility that these cases are associated with X–ray binaries rather than plasma filled super-bubbles. For example, in the case of IC 2574, due to the limited angular resolution of the ROSAT PSPC, it was not possible to differentiate between the X-ray emission originating from hot gas and the thermal emission from an unresolved individual X-ray source, as now seems likely on the basis of our CHANDRA data of IC 2574. These unresolved sources do have the same luminosities, of order erg s-1, as super-shells. Alternatively, there could be a contribution to a thermal plasma by supernovae developing in a dense environment, such as SN1988Z which reportedly reached an X–ray luminosity of erg s-1 (Fabian and Terlevich, 1996).
Moreover, it might be difficult to detect coronal gas from expanding super-bubbles as there could be a conspiracy at work. Perhaps only (super)bubbles in the making, which are still actively being powered and hence over-pressured, would be sufficiently bright to be seen by, for example, ROSAT. However, these objects tend to be fairly small, young, and surrounded by a dense HI shell which would absorb the X–rays, especially the softer ones. Once a bubble has reached its final size, after some yr, the interior has cooled down to below K and no X–rays will be detected. It is only with the new generation of satellites, such as CHANDRA and XMM–Newton that we can hope to settle this issue once and for all.
6 Summary and conclusions
We analyzed ROSAT PSPC data of the dwarf galaxy Holmberg II. The ROSAT data provide information on faint X–ray emission features down to a unabsorbed limiting flux of . This corresponds to a luminosity threshold of . In total we detected 31 significant X–ray sources located within the Hi column density distribution of Ho II. Using the log() vs. log() relation of Hasinger et al. (1998) we expect to detect about 7 XRB sources within the area of Ho II Hi gas disk. To avoid confusion with unrelated extragalactic XRB sources, we investigated further only those X–ray sources which have counterparts in FUV, H or radio continuum emission. This additional selection criterion is fulfilled by 13 X–ray sources.
In order to determine the nature of faint X–ray sources for which no high signal–to–noise spectral information can be obtained, we applied the technique of the hardness ratio diagram. For this purpose, we evaluated the intensities in the broad ROSAT 1/4 keV, 3/4 keV and 1.5 keV energy band and calculated the corresponding X–ray hardness ratios. Depending on the amount of photoelectric attenuation, an X–ray source will fall within a specific zone in this diagram. In analogy with the optical regime, one can consider the variation of the X–ray color due to photoelectric absorption as the counterpart for reddening of stellar light by intervening dust. The X–ray hardness ratio diagram offers a very sensitive tool to constrain the X–ray emitting process even for faint sources. The faintest source analyzed in this paper has an X–ray flux of only (#1).
Of the 13 sources detected with confidence and for which counterparts at other wavelengths have been found, we speculate that of order 3 are young SNRs, 3 are associated with regions of active star formation, 1 might be the superposed contribution of the coronal X–ray emission of several hundred O–stars and of order 5 are most likely X–ray binaries. The strongest source, #13, was already studied previously by Zezas, Georgantopoulos and Ward (1999). Whereas they claim a power–law spectrum and relatively high absorbing column density of about , and suggest some source of accretion on to a compact object, we prefer to interpret this source as having a softer intrinsic spectrum, and an absorbing column density of only . Our analysis leads us to propose that this source is most likely a SNR. This is supported by the analysis published by Miyaji, Lehmann and Hasinger (2001) who find that some 27% of the ROSAT X–ray emission comes from an extended source and that the spectrum below 2.5 keV is best fit by a thermal plasma. However, their ASCA observations show that above 2.5 keV this source shows a power–law spectrum which they ascribe to accretion on to an intermediate–mass black hole.
No extended emission which could be attributed to hot gas filling the Hi super-bubbles was detected above our ROSAT luminosity limit of . This is not too surprising and in agreement with theoretical estimates which predict luminosities of L.
As mentioned, observations with CHANDRA and XMM–Newton will be needed and are expected to be especially rewarding for studying the ISM in nearby (dwarf) galaxies.
| No. | Source detection | C–band | ||||
|---|---|---|---|---|---|---|
| [hh:mm:ss] | [] | [] | [] | source | ||
| 1 | 08:19:12 | 70:45:59 | FUV | x | ||
| 2 | 08:18:34 | 70:48:40 | rcs/therm. X–ray | – | ||
| 3 | 08:18:35 | 70:47:20 | – | – | ||
| 4 | 08:18:43 | 70:46:03 | FUV, rcs, X–ray therm. o. powl | – | ||
| 5 | 08:18:53 | 70:44:45 | FUV, therm. rcs,H | x | ||
| 6 | 08:19:03 | 70:43:03 | FUV, therm. rcs, H | x | ||
| 7 | 08:19:20 | 70:43:30 | FUV, SNR rcs, X–ray powl., H | x | ||
| 8 | 08:19:17 | 70:42:56 | FUV, therm. rcs, X–ray therm., H | x | ||
| 9 | 08:19:11 | 70:42:01 | FUV, H | x | ||
| 10 | 08:19:00 | 70:41:27 | FUV, H | x | ||
| 11 | 08:19:18 | 70:40:40 | FUV | x | ||
| 12 | 08:19:10 | 70:39:39 | FUV, rcs,X–ray therm. o. powl | – | ||
| 13 | 08:19:33 | 70:42:18 | FUV, SNR rcs, X–ray therm., H | x |
Note. — The column labeled “Source Properties” lists the most likely origin for the X–ray flux as well as information from the complementary data. The column labeled “C-band” indicates if a source emits significant amounts of 1/4 keV radiation, suggesting that the X–ray source is located in front of the gaseous body of Ho II. The abbreviation “rcs” denotes radio continuum source. The radio data is published by Tongue and Westpfahl (1995), the optical data by Rhode et al. (1999) and the FUV data by Stewart et al. (2000).
References
- Arthur and Henney (1986) Arthur, S.J., Henney, W.J., 1996, ApJ, 457, 752
- Bomans, Chu and Hopp (1997) Bomans, D.J., Chu, Y.–H., Hopp, U., 1997, AJ, 113, 1678
- Bomans, Dennerl and Kürster (1994) Bomans, D.J., Dennerl, K., Kürster, M., 1994 A&A, 283, L21
- Bureau and Carignan (1997) Bureau, M., Carignan, C., 1997, “Dwarf Galaxies: Probes for Galaxy Formation and Evolution”, Abstract Book (XXIIIrd IAU General Assembly, Kyoto), ed. Takahira, S., p. 36
- Chu et al. (1995) Chu, Y.–H., Chang ,H.–W., Su, Y.–L., Mac Low, M.–M., 1995, ApJ, 450, 157
- Chu and Mac Low (1990) Chu, Y.–H., Mac Low, M.–M., 1990, ApJ365, 510
- Chu et al. (1993) Chu, Y.–H., Mac Low, M.–M., Garcia–Segura, G., Wakker, B.P., Kennicutt, R.C., 1993, ApJ, 414, 213
- Egger and Aschenbach (1995) Egger, R.J., Aschenbach, B., 1995, A&A, 294, L25
- Fabbiano (1989) Fabbiano, G., 1989, ARA&A, 27, 87
- Fabbiano (1996) Fabbiano, G., 1996, “X-ray emission of Galaxies” in ‘Röntgenstrahlung from the Universe, Eds. Zimmermann U. et al. p. 347
- Fabian and Terlevich (1996) Fabian, A.C., Terlevich, R., 1996, MNRAS, 280, L5
- Gendreau et al. (1996) Gendreau, K.C., Mushotzky, R., Fabian, A.C. et al., 1996, PASJ, 47, 5
- Hartmann and Burton (1997) Hartmann, D., Burton, W.B., 1997, “Atlas of Galactic Neutral Hydrogen” (Cambridge University Press: Cambridge)
- Hasinger et al. (1998) Hasinger, G., Burg, R., Giacconi, R. et al., 1998, A&A, 329, 482
- Hunter and Gallagher (1985) Hunter, D.A., Gallagher, J.S., 1985, ApJS, 58, 533
- Kudritzki et al. (1995) Kudritzki, R.P., Palsa, R., Feldmeier, A., Puls, J., Pauldrach, A.W.A., 1995, “Röntgenstrahlung from the Universe” MPE-Report 263, Eds. Zimmermann, H.U., Trümper, J.E., Yorke, H., p. 9
- Mac Low et al. (1998) Mac Low, M.–M., Chang, T.H., Chu, Y.–H., Points, S.D., Smith, R.C., Wakker, B.P., 1998, ApJ, 493, 260
- Martin and Kennicutt (1995) Martin, C.L., Kennicutt, R.C., 1995, ApJ, 447, 171
- Mashchenko and Silich (1995) Mashchenko, S.Ya., Silich, S.A., 1995, ARep 39, 587
- Miller (1995) Miller, B.W., 1995, ApJ, 446, L75
- Miyaji, Lehmann and Hasinger (2001) Miyaji T., Lehmann I., Hasniger G., 2001 astro-ph/0102500
- Mushotzky et al. (2000) Mushotzky, R.F., Cowie, L.L., Barger, A.J., Arnaud, K.A., 2000, Nature, 404, 459
- Oey and Clarke (1997) Oey, M.S., Clarke, C.J., 1997, MNRAS, 289, 570
- Puche et al. (1992) Puche, D., Westpfahl, D., Brinks, E., Roy, J.-R., 1992, AJ, 103, 1841
- Raymond and Smith (1977) Raymond, J.C., Smith, B.W., 1977, ApJS, 35, 419
- Rhode et al. (1999) Rhode, K.L., Salzer, J.J., Westpfahl, D.J., Radice, L.A., 1999, AJ, 118, 323
- Schulz (1999) Schulz, N.S., 1999, ApJ, 511, 304
- Sfeir et al. (1999) Sfeir, D.M., Lallement, R., Crifo, F., Welsh, B.Y., 1999, A&A, 346, 785
- Silich et al. (2000) Silich, S.A., Tenorio–Tagle, G., Terlevich, R., Terlevich, E., Netzer, H., 2000, MNRAS(accepted)
- Stewart et al. (2000) Stewart, S.G., Fanelli, M.N., Byrd, G.G. et al., 2000, ApJ, 529, 201
- Sutherland and Dopita (1993) Sutherland R.S., Dopita M.A., 1993, ApJS, 88, 253
- Tongue and Westpfahl (1995) Tongue, T.D., Westpfahl, D.J., 1995, AJ, 109, 2462
- Walter and Brinks (1999) Walter, F., Brinks, E., 1999, AJ, 118, 273
- Walter et al. (1998) Walter, F., Kerp, J., Duric, N., Brinks, E., Klein, U., 1998, ApJ, 502, L143
- Weaver et al. (1977) Weaver, R., McCray, R., Castor, J., Shapiro, P., Moore R., 1977, ApJ, 218, 377
- White, Swank and Holt (1983) White, N.E., Swank, J.H., Holt, S.S., 1983, ApJ, 270, 711
- Zezas, Georgantopoulos and Ward (1999) Zezas, A.L., Georgantopoulos, I., Ward, M.J., 1999, MNRAS, 308, 302
- Zimmermann et al. (1998) Zimmermann, U., Boese, G., Becker, W., et al., 1998, MPE Report