A High Resolution X–ray spectrum of the LINER Galaxy M81
Abstract
We present the soft X–ray spectrum of the LINER galaxy M81 from a long observation with the XMM-Newton RGS. As well as continuum emission from the active nucleus, the spectrum shows emission lines from multi temperature collisionally ionized gas. The emission lines are significantly broader than the RGS point-source spectral resolution, and in the cross dispersion direction the emission lines are detected adjacent to, as well as coincident with, the active nucleus. This implies that they originate in a region of more than an arcminute ( kpc) spatial extent. A good fit to the whole RGS spectrum can be found using a model consisting of an absorbed power law from the active nucleus and a 3 temperature thermal plasma. Two of the thermal plasma components have temperatures of 0.18 keV and 0.64 keV, characteristic of the hot interstellar medium produced by supernovae; the combined luminosity of these two plasma components accounts for all the unresolved bulge X–ray emission seen in the Chandra observation by [*]mpage-C2:tennant01. The third component has a higher temperature ( keV) and we propose X–ray binaries in the bulge of M81 as the most likely source of this emission.
keywords:
X-rays: galaxies – ISM: supernova remnants – Galaxies: individual: M81 – Galaxies: active1 Introduction
M81 is an Sab spiral galaxy hosting a low luminosity Seyfert nucleus which shows the characteristics of a “low ionization nuclear emission-line region” (LINER, [\astronciteHeckman1980]). It was first observed in X–rays with Einstein ([\astronciteElvis and van Speybroeck1982], [\astronciteFabbiano1988]) which resolved several discrete sources in M81, the brightest of which is associated with its active nucleus. An apparently diffuse emission component associated with the bulge of M81, spatially extended over a few arcminutes was detected first with Rosat ([\astronciteRoberts and Warwick2000], [\astronciteImmler and Wang2001]) and later confirmed with Chandra data ([\astronciteTennant et al.2001]). Spectra from Rosat ([\astronciteImmler and Wang2001]), BBXRT ([\astroncitePetre et al.1993]), ASCA ([\astronciteIshisaki et al.1996]) and BeppoSAX ([\astroncitePellegrini et al.2000]) suggested the presence of a soft ( 1 keV) thermal component in addition to an absorbed power law component from the nucleus. In this paper we present the soft X–ray spectrum of M81 at much higher resolution, from an observation with the XMM-Newton reflection grating spectrometer (RGS, [\astronciteden Herder et al.2001]).
2 RGS data and spectral analysis
M81 was observed by XMM-Newton in April 2001 for a total of 138 ks. The RGS data were reduced using the XMM-Newton standard analysis software (SAS) version 5.2. The source spectrum was extracted from a region centred on the nucleus, enclosing 90% of the point spread function in the cross dispersion direction. Background regions were selected in the cross-dispersion direction so as to exclude 99% of the nuclear point spread function.

2.1 X-ray emission line gas
Figure 1 shows the RGS spectrum. A number of prominent emission lines from H-like and He-like N, O, and Ne as well as L shell lines from Fe XVII and Fe XVIII are visible above the continuum; these are labelled in Figure 1. The lines are considerably broader than the RGS line spread function for a point source. For example, O VIII Ly at Å is expected to have relatively little contamination from neigbouring lines, but a gaussian fit to this line shows that it is inconsistent with at . This broadening could be due to kinematic motions in the gas, for example if it is associated with the active nucleus. However a similar level of line broadening would result from the gas being extended over a region of 2 arcminutes, because the RGS is a slitless dispersive spectrograph and its resolution is degraded for extended objects.
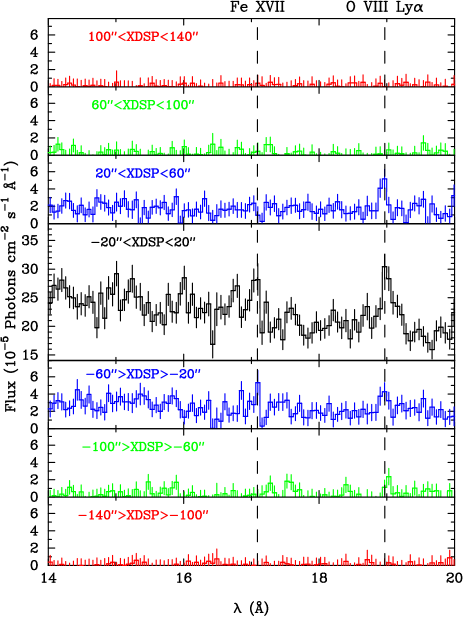
To distinguish these alternatives, we have examined the spatial distribution of the emission line gas in the RGS cross dispersion direction by constructing spectra in wide strips at a range of distances from the nucleus of M81. A background spectrum was constructed from the average of the two most off-axis strips. The emission-line rich 14-20 Å parts of these spectra are shown in Figure 2. The emission line gas is extended over more than an arcminute implying that the excess broadening of the emission lines is due to their spatial extent rather than kinematic motions.
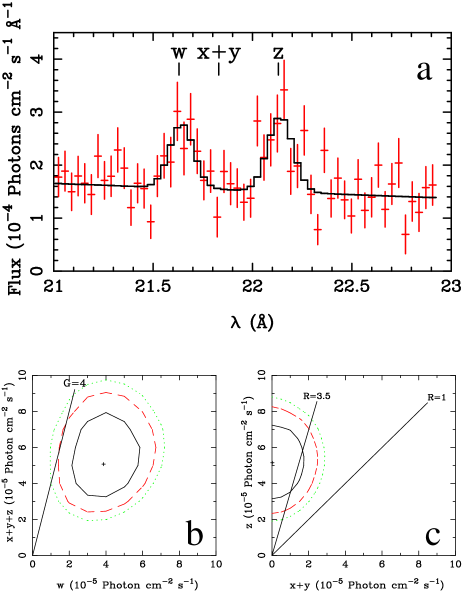
We further investigate the nature of the emission line gas using plasma diagnositics from the He-like OVII triplet, as described in [\astroncitePourquet and Dubau2000]. Taking the 21-23 Å portion of the RGS spectrum, we fitted the OVII lines as 3 gaussians with the relative wavelengths of the resonance (w), intercombination (x+y) and forbidden (z) lines fixed at their theoretical ratios. The best fit has an acceptable , and is shown superimposed on the 21-23 Å RGS spectrum in Figure 3a. In Figure 3b we show the confidence contour of the (x+y+z) against w line strength. The solid line shows the line ratio G (=(x+y+z)/w) = 4. Plasmas in which photoionization is the dominant ionization mechanism are expected to have ratios to the left of this line (i.e. G 4); this is ruled out at 95% confidence in M81. In plasmas with line ratios to the right of this line, such as that seen in M81, collisional excitation is important and may be the dominant emission mechanism. Figure 3c shows confidence contours of the density diagnostic z against (x+y). The line shown on the plot corresponding to ratio R (=z/(x+y)) = 1 is excluded at along with all of parameter space to the right of this line, implying that the line emitting plasma has a density of .
| (1) | (2) | (3) | (4) | (5) |
|---|---|---|---|---|
| Model | or | flux | ||
| PL | 1085/992 | |||
| PL | 876/990 | |||
| +Mek | ||||
| PL | 821/984 | |||
| +Mek3 | ||||
| +Mek3 | ||||
| PL | 803/980 | |||
| +Mek3 | ||||
| +Mek3 | ||||
| +Mek3 | ||||
| Explanation of columns: | ||||
| 1 PL = power law, | ||||
| NH = neutral absorber (‘tbabs’ model in XSPEC), | ||||
| Mek = thermal plasma (‘Mekal’ model in XSPEC), | ||||
| Mek3 = thermal plasma (‘Mekal’ model in XSPEC) with | ||||
| components at km s-1 to the broadening of | ||||
| the lines produced by the spatial extent of the emission. | ||||
| 2 power law photon index or temperature of thermal | ||||
| plasma (keV) | ||||
| 3 flux of model component in the energy range 0.3-2.0 keV, | ||||
| in units of erg cm-2 s-1 after correction for | ||||
| Galactic absorption of cm-2 | ||||
| 4 intrinsic neutral column density (cm-2). | ||||
2.2 Modelling the whole RGS spectrum
The emission lines in the soft X–ray spectrum of M81 are superimposed on a strong continuum from the its active nucleus. To reproduce this continuum emission we used XSPEC to fit a power law model, modified by both Galactic column and intrinsic absorption (xspec model TBabs of [\astronciteWilms et al.2000]). We obtained a () for an intrinsic absorber with a column density of 5 . The fit parameters of this fit, and subsequent fits, are given in Table 1.
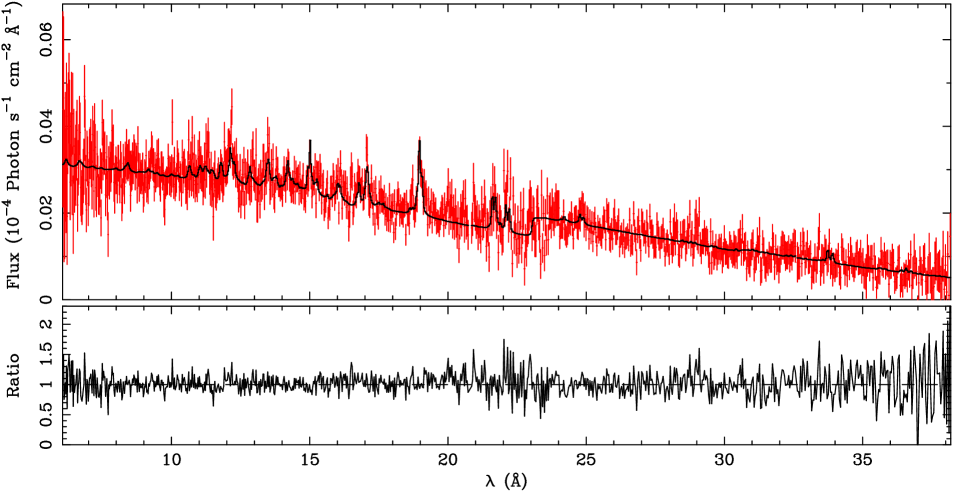
We next attempted to model the emission line component. As shown in Section 2.1 the O VII triplet is consistent with an origin in a collisionally ionized gas. We therefore began modelling the emission lines by adding a single temperature ‘Mekal’ thermal plasma to the absorbed power law model. This resulted in a significant improvement in the fit () for a plasma temperature of keV. However, the emission lines are too narrow in this model, and some emission lines, most noticably those from OVII, have much lower intensities in the model than in the observed spectrum. We therefore added a second, lower temperature, Mekal component to the model, and at both Mekal temperatures we added components with positive and negative velocities of 1500 km s-1 to reproduce the width of the lines caused by the spatial extent of the emission region. The relative normalisations of the rest, +1500 km s-1 and -1500 km s-1 components were allowed to vary freely, but the temperatures were tied in the fit; the fluxes given for these model components in Table 1 are the totals for all three ‘velocity’ components. This resulted in a significant improvement in , reproducing most of the emission lines well, with the second plasma component at a best fit temperature of keV. However, the blend of Ne X with Fe XXII-XXIII at Å is still underproduced by this model, and so a third, higher temperature, Mekal plasma was added. This resulted in another significant improvement in the fit, to a final , with a best fit temperature for the third Mekal component of keV. The model reproduces the spectrum well, as shown in Figure 4.
3 Discussion
In Section 2.1 we showed that the soft X–ray emission lines in M81 come from an extended region. We also showed that the diagnostic OVII triplet is emitted by a low density region and is not powered by photoionization from the central AGN. Furthermore, in the previous section we showed that a 3 temperature thermal plasma model provides a good description of the emission line component of the M81 RGS spectrum in conjunction with absorbed powerlaw emission from the nucleus. Two of the thermal plasma components have temperatures of keV and keV, which are too low to be produced by accreting binaries, and are instead more characteristic of the hot interstellar medium produced by supernova explosions; in this case we would expect these emission lines to come from a genuinely diffuse region (or regions) in the bulge of M81.
The X–ray imaging study performed with Chandra does indeed find diffuse emission from the bulge of M81. The luminosity of this unresolved bulge emission reported by [*]mpage-C2:tennant01 is erg s-1 (0.2-8 keV) assuming a distance of 3.6 Mpc to M81. Assuming the same distance, the 0.18 keV and 0.64 keV thermal plasma components from our best fit model in Table 1 have luminosities of erg s-1 and erg s-1 respectively over the same energy range - sufficient to completely account for the unresolved bulge emission.
If the emission associated with the highest of the three plasma temperatures ( keV) were also produced by a hot interstellar medium, or by a large population of very low luminosity sources such as cataclysmic variables, it would also appear diffuse in the Chandra imaging. However, the two lower temperature plasma components alone completely account for the unresolved emission, and hence the higher temperature emission must arise in part of the bulge population resolved by Chandra. We propose X-ray binaries as the most likely origin of the higher temperature emission.
Acknowledgements.
Based on observations obtained with XMM-Newton, an ESA science mission with instruments and contributions funded by ESA Member States and the USA (NASA).References
- [\astronciteElvis and van Speybroeck1982] Elvis M., van Speybroeck L. 1982, ApJ 257, L51
- [\astronciteFabbiano1988] Fabbiano G. 1988, ApJ 325, 544
- [\astronciteden Herder et al.2001] den Herder J.W. et al. 2001, A&A 365, L7
- [\astronciteHeckman1980] Heckman T.M. 1980, A&A, 87, 152
- [\astronciteImmler and Wang2001] Immler S., Wang Q.D., 2001, ApJ, 554, 202
- [\astronciteIshisaki et al.1996] Ishisaki Y., et al. 1996, PASJ, 48, 237
- [\astroncitePellegrini et al.2000] Pellegrini S., Cappi M., Bassani L., Malaguti G., Palumbo G.G.C., Persic M. 2000, A&A 353, 447
- [\astroncitePetre et al.1993] Petre R., Mushotzky R.F., Serlemitsos P.J., Jahoda K., Marshall F.E. 1993, ApJ 418, 644
- [\astroncitePourquet and Dubau2000] Pourquet D., Dubau J. 2000, A&A Supp 143, 495
- [\astronciteRoberts and Warwick2000] Roberts T.P., Warwick R.S. 2000, MNRAS 315, 98
- [\astronciteTennant et al.2001] Tennant A.F., Wu K., Ghosh K.K., Kolodziejczak J.J., Schwartz D.A. 2001, ApJ 549, L43
- [\astronciteWilms et al.2000] Wilms J., Allen A., McCray R., 2000, ApJ, 542, 914