Detection of a supernova signature associated with GRB 0111211
Abstract
Using observations from an extensive monitoring campaign with the Hubble Space Telescope we present the detection of an intermediate time flux excess which is redder in color relative to the afterglow of GRB 011121, currently distinguished as the gamma-ray burst with the lowest known redshift. The red “bump,” which exhibits a spectral roll-over at 7200 Å, is well described by a redshifted Type Ic supernova that occurred approximately at the same time as the gamma-ray burst event. The inferred luminosity is about half that of the bright supernova 1998bw. These results serve as compelling evidence for a massive star origin of long-duration gamma-ray bursts. Models that posit a supernova explosion weeks to months preceding the gamma-ray burst event are excluded by these observations. Finally, we discuss the relationship between spherical core-collapse supernovae and gamma-ray bursts.
Published in the Astrophysical Journal Letters, vol. 572, L45–L49
1 Introduction
Two broad classes of long-duration gamma-ray burst (GRB) progenitors have survived scrutiny in the afterglow era: the coalescence of compact binaries (see Fryer et al. 1999 for review) and massive stars (Woosley, 1993). More exotic explanations (e.g., Paczyński, 1988; Carter, 1992; Dermer, 1996) fail to reproduce the observed redshift distribution, detection of transient X-ray lines, and/or the distribution of GRBs about host galaxies.
In the latter viable scenario, the so-called “collapsar” model (Woosley, 1993; MacFadyen & Woosley, 1999; Hansen, 1999), the core of a massive star collapses to a compact stellar object (such as a black hole or magnetar) which then powers the GRB while the rest of the star explodes. We expect to see two unique signatures in this scenario: a rich circumburst medium fed by the mass-loss wind of the progenitor (Chevalier & Li, 1999) and an underlying supernova (SN). Despite extensive broadband modeling of afterglows, unambiguous signatures for a wind-stratified circumburst media have not been seen (e.g., Frail et al., 2000; Berger et al., 2001).
There has, however, been been tantalizing evidence for an underlying SN. The first association of a cosmologically distant GRB with the death of a massive star was found for GRB 980326, where a clear excess of emission was observed, over and above the rapidly decaying afterglow component. This late-time “bump” was interpreted as arising from an underlying SN (Bloom et al., 1999) since, unlike the afterglow, the bump was very red. GRB 970228, also with an intermediate-time bump and characteristic SN spectral rollover, is another good candidate (Reichart, 1999; Galama et al., 2000).
Suggestions of intermediate-time bumps in GRB light curves have since been put forth for a number of other GRBs (Lazzati et al., 2001; Sahu et al., 2000; Fruchter et al., 2000; Björnsson et al., 2001; Castro-Tirado et al., 2001; Sokolov, 2001; Dar & Rújula, 2002). Most of these results are tentative or suspect with the SN inferences relying on a few mildly deviant photometric points in the afterglow light curve. Even if some of the bumps are real, a number of other explanations for the physical origin of such bump have been advanced: for example, dust echoes (Esin & Blandford, 2000; Reichart, 2001), shock interaction with circumburst density discontinuities (e.g., Ramirez-Ruiz et al., 2001), and thermal re-emission of the afterglow light (Waxman & Draine, 2000). To definitively distinguish between the SN hypothesis and these alternatives, detailed spectroscopic and multi-color light curve observations of intermediate-time bumps are required.
It is against this background that we initiated a program with the Hubble Space Telescope (HST) to sample afterglow light curves at intermediate and late-times. The principal attractions of HST are the photometric stability and high angular resolution. These are essential in separating the afterglow from the host galaxy and in reconstructing afterglow colors.
On theoretical grounds, if the collapsar picture is true, then we expect to see a Type Ib/Ic SN (Woosley, 1993). In the first month, core-collapsed supernova spectra are essentially characterized by a blackbody (with a spectral peak near 5000 Å) modified by broad metal-line absorption and a strong flux suppression blueward of Å in the restframe. For GRBs with low redshifts, , the effect of this blue absorption blanketing is a source with an apparent red spectrum at observer-frame optical wavelengths; at higher redshifts, any supernova signature is highly suppressed. For low redshift GRBs, intermediate-time follow-up are, then, amenable to observations with the Wide Field Planetary Camera 2 (WFPC2). In this Letter we report on WFPC2 multi-color photometry of GRB 011121 (; Infante et al. 2001) and elsewhere we report on observations of GRB 010921 (; Price et al. 2002a). In a companion paper (Price et al. 2002b; hereafter Paper II), we report a multi-wavelength (radio, optical and NIR) modeling of the afterglow.
2 Observations and Reductions
2.1 Detection of GRB 011121 and the afterglow
On 2001 November 21.7828 UT, the bright GRB 011121 was detected and localized by BeppoSAX to a 5-arcmin radius uncertainty (Piro et al., 2001). Subsequent observations of the error circle refined by the IPN and BeppoSAX (see Paper II) revealed a fading optical transient (OT) (Wyrzykowski et al., 2001; Stanek et al., 2001). Spectroscopic observations with the Magellan 6.5-m telescope revealed redshifted emission lines at the OT position (), indicative of a bright, star-forming host galaxy of GRB 011121 (Infante et al., 2001).
2.2 HST Observations and reductions
For all the HST visits, the OT and its underlying host were placed near the serial readout register of WF chip 3 (position WFALL) to minimize the effect of charge transfer (in)efficiency (CTE). The data were pre-processed with the best bias, dark, and flat-field calibrations available at the time of retrieval from the archive (“on–the–fly” calibration). We combined all of the images in each filter, dithered by sub-pixel offsets, using the standard IRAF/DITHER2 package to remove cosmic rays and produce a better sampled final image in each filter. An image of the region surrounding the transient is shown in figure 1. The point source was detected at better than 20 in epochs one, two and three in all filters, and better than 5 in epoch four.
![[Uncaptioned image]](/html/astro-ph/0203391/assets/x1.png)
Hubble Space Telescope image of the field of GRB 011121 on 2001 December 4–6 UT. This false-color image was constructed by registering the final drizzled images in the F555W (blue), F702W (green) and F814W (red) filters. The optical transient (OT) is clearly resolved from the host galaxy and resides in the outskirts of the morphologically smooth host galaxy. Following the astrometric methodology outlined in Bloom et al. (2002), we find that the transient is offset from the host galaxy (883 7) mas west, (86 13) mas north. The projected offset is (4.805 0.035) kpc, almost exactly at the host half-light radius. Sources “A” and “B” are non-variable point sources that appear more red than the OT and are thus probably foreground stars.
Given the proximity of the OT to its host galaxy, the final HST images were photometered using the IRAF/DAOPHOT package which implements PSF-fitting photometry on point-sources (Stetson, 1987). The PSF local to the OT was modeled with PSTSELECT and PSF using at least 15 isolated stars detected in the WF chip 3 with an adaptive kernel to account for PSF variations across the image (VARORDER = 1). The resulting photometry, reported in Table 1, was obtained by finding the flux in an 0′′.5 radius using a PSF fit. We corrected the observed countrate using the formulation for CTE correction in Dolphin (2000) with the most up-to-date parameters222See http://www.noao.edu/staff/dolphin/wfpc2_calib/; such corrections, computed for each individual exposure, were never larger than 8% (typically 4%) for a final drizzled image. We estimated the uncertainty in the CTE correction, which is dependent upon source flux, sky background, and chip position, by computing the scatter in the CTE corrections for each of the images that were used to produce the final image. The magnitudes reported in the standard bandpass filters in Table 1 were found using the Dolphin prescription.
3 Results
In figure 2 we plot the measured fluxes from our four HST epochs in the F555W, F702W, F814W and F850LP filters. We also plot measurements made at earlier times (0.5 d 3 d) with ground-based telescopes and reported in the literature. These magnitudes were converted to fluxes using the zero-points of Fukugita et al. (1995) and plotted in the appropriate HST filters.
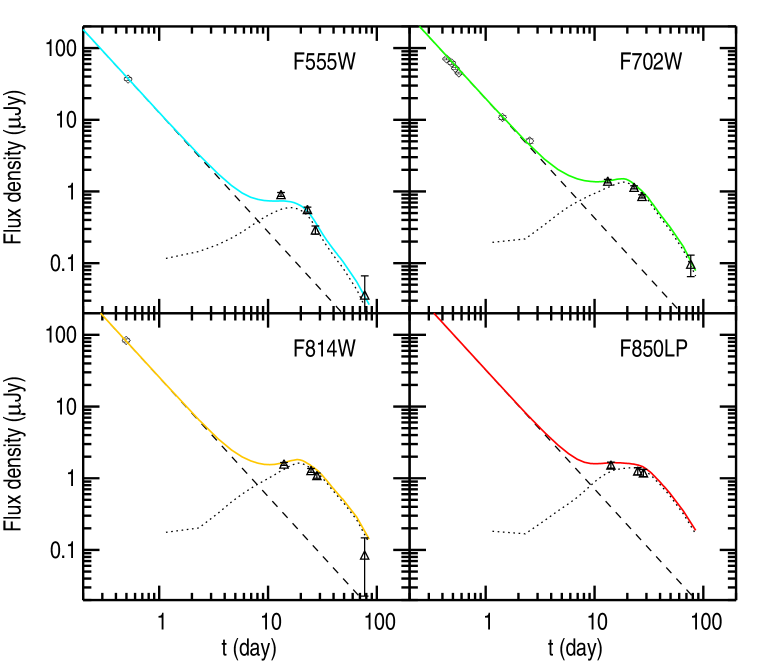

Corrections for color effects between the ground-based filters and HST filters were taken to be negligible for the purpose of this exercise.
The estimated contribution from the afterglow is heavily weighted by the available data: our ground-based data (and those reported in the literature so far) are primarily at early times. Roughly, over the first week, the afterglow exhibits a simple power law decay. The afterglow contribution derived from our NIR data and optical data from the literature (see Paper II) is shown by the dashed line in each panel. No afterglow light curve breaks (e.g., from jetting) were assumed.
Garnavich et al. (2002) drew attention to an excess of flux (in -band), at a time 13 days after the GRB, with respect to that expected from the power-law extrapolation of early-time afterglow emission; they suggested the excess to arise from an underlying SN. As can vividly be seen from our multi-color data, the excess is seen in all bands and over several epochs.
We used the light curve and spectra333Spectra were obtained through the Online Supernova Spectrum Archive (SUSPECT) at http://tor.nhn.ou.edu/suspect/index.html. of the well-studied Type Ic supernova SN 1998bw (Galama et al., 1998; McKenzie & Schaefer, 1999) to create a comparison template broad-band light curve of a Type Ic supernova at redshift . Specifically, the spectra of SN 1998bw were used to compute the -corrections between observed photometric bands of 1998bw and HST bandpasses (following Kim et al. 1996 and Schmidt et al. 1998). A flat cosmology with km s-1 Mpc-1 and was assumed and we took the Galactic foreground extinction to SN 1998bw of mag (Galama et al., 1998).
Since dimmer Ic SNe tend to peak earlier and decay more quickly (see fig. 1 of Iwamoto et al. 1998), much in the same way that SN Ia do, we coupled the flux scaling of SN 1998bw with time scaling in a method analogous to the “stretch” method for SN Ia distances (Perlmutter et al., 1997). To do so, we fit an empirical relation between 1998bw and 1994I to determine the flux-time scaling. We estimate that a 1998bw-like SN that is dimmed by 55% (see below), would peak and decay about 17% faster than 1998bw itself. Some deviations from our simple one-parameter template are apparent, particularly in the F555W band and at late-times.
In figure 3, we plot the spectral flux distributions (SFDs) of the intermediate-time bump at the four HST epochs. A clear turn-over in the spectra in the first 3 epochs is seen at about 7200 Å. The solid curve is the SFD of SN 1998bw transformed as described above with the associated 2- errors. Bearing in mind that there are large systematic uncertainties in the template (i.e., the relative distance moduli between SN 1998bw and GRB 011121) and in the re-construction of the red bump itself (i.e., the Galactic extinction toward GRB 011121 and the contribution from the afterglow in the early epochs), the consistency between the measurements and the SN is reasonable. We consider the differences, particularly the bluer bands in epoch one, to be relatively minor compared with the overall agreement. This statement is made in light of the large observed spectral diversity of Type Ib/Ic SNe (see, for example, figure 1 of Mazzali et al. 2002).
4 Discussion and Conclusions
We have presented unambiguous evidence for a red, transient excess above the extrapolated light curve of the afterglow of GRB 011121. We suggest that the light curve and spectral flux distribution of this excess appears to be well represented by a bright SN. While we have not yet explicitly compared the observations to the expectations of alternative suggestions for the source of emission (dust echoes, thermal re-emission from dust, etc.), the simplicity of the SN interpretation—requiring only a (physically motivated) adjustment in brightness—is a compelling (i.e., Occam’s Razor) argument to accept our hypothesis. Given that the red bump detections in a number of other GRBs occur on a similar timescale as in GRB 011121, any model for these red bumps should have a natural timescale for peak of day; in our opinion, the other known possibilities do not have such a natural timescale as compared with the SN hypothesis. Indeed, if our SN hypothesis is correct, then the flux should decline as an exponential from epoch four onward. The ultimate confirmation of the supernova hypothesis is a spectrum which should show characteristic broad metal-line absorption of the expanding ejecta (from, e.g., Ca II, Ti II, Fe II).
We used a simplistic empirical brightness–time stretch relation to transform 1998bw, showing good agreement between the observations and the data. If we neglect the time-stretching and only dim the 1998bw template, then the data also appear to match the template reasonably well, however, the discrepancies in the bluer bands become somewhat larger and the flux ratios between epochs are slightly more mismatched. The agreement improves if we shift the time of the supernova to be about 3–5 days (restframe) before the GRB time. Occurrence times more than about ten days (restframe) before the GRB can be ruled out. This observation, then, excludes the original “supranova” idea (Vietri & Stella, 1998), that posited a supernova would precede a GRB by several years (see eq. [1] of Vietri & Stella 1998). Modified supranova scenarios that would allow for any time delay between the GRB and the accompanying SN, albeit ad hoc, are still consistent with the data presented herein444The explosion date of even very well-studied supernovae, such as 1998bw, cannot be determined via light curves to better than about 3 days (e.g., Iwamoto et al. 1998). This implies that future photometric studies might not be equipped to distinguish between contemporaneous SN/GRB events and small delay scenarios..
Regardless of the timing between the SN explosion and the GRB event (constrained to be less than about 10 days apart), the bigger picture we advocate is that GRB 011121 resulted from an explosive death of a massive star. This conclusion is independently supported by the inference, from afterglow observations of GRB 011121 (Paper II), of a wind-stratified circumburst medium.
The next phase of inquiry is to understand the details of the explosion and also to pin down the progenitor population. A large diversity in any accompanying SN component of GRBs is expected from both a consideration of SNe themselves and the explosion mechanism. The three main physical parameters of a Type Ib/Ic SN are the total explosive energy, the mass of the ejecta, and the amount of Nickel synthesized by the explosion (). The peak luminosity and time to peak are roughly determined by the first two whereas the exponential tail is related to . Ordinary Ib/Ic SNe appear to show a wide dispersion in the peak luminosity (Iwamoto et al., 1998). There is little ab initio understanding of this diversity (other than shifting the blame to dispersion in the three parameters discussed above).
It is now generally accepted that GRBs are not spherical explosions and are, as such, usually modeled as a jetted outflow. Frail et al. (2001) model the afterglow of GRBs and have presented a compilation of opening angles, , ranging from less than a degree to 30 degrees and a median of 4 degrees. If GRBs have such strong collimation then it is not reasonable to assume that the explosion, which explodes the star, will be spherical. We must be prepared to accept that the SN explosion is extremely asymmetric and thus even a richer diversity in the light curves. This expected diversity may account for both the scale factor difference between the SN component seen here and in SN 1998bw seen in figure 3. Indeed, there has been a significant discussion in the literature as to the degree which the central engine in GRBs will affect the overall explosion of the star (Woosley, 1993; Khokhlov et al., 1999; MacFadyen & Woosley, 1999; Höflich et al., 1999; MacFadyen et al., 2001). These models currently have focused primarily on the hydrodynamics and lack the radiative modeling necessary to compare observations to the models.
Clearly, the next step is to obtain spectroscopy (and perhaps even spectropolarimetry) and to use observations to obtain a rough measure of the three-dimensional velocity field and geometry of the debris. As shown by GRB 011121 the SN component is bright enough to undertake observations with the largest ground-based telescopes.
We end by noting the following curious point. The total energy yield of a GRB is usually estimated from the gamma-ray fluence and an estimate of (see Frail et al., 2001). Alternatively, the energy in the afterglow is used (e.g., Piran et al., 2001). However, for GRB 011121, the energy in the SN component (scaling from the well-studied SN 1998bw) is likely to be comparable or even larger than that seen in the burst or the afterglow. In view of this, the apparent constancy of the -ray energy release is even more mysterious.
References
- Berger et al. (2001) Berger, E. et al. 2001, ApJ, 556, 556
- Björnsson et al. (2001) Björnsson, G., Hjorth, J., Jakobsson, P., Christensen, L., and Holland, S. 2001, ApJ (Letters), 552, L121
- Bloom et al. (2002) Bloom, J. S., Kulkarni, S. R., and Djorgovski, S. G. 2002, AJ, 123, 1111
- Bloom et al. (1999) Bloom, J. S. et al. 1999, Nature, 401, 453
- Carter (1992) Carter, B. 1992, ApJ (Letters), 391, L67
- Castro-Tirado et al. (2001) Castro-Tirado, A. J. et al. 2001, A&A, 370, 398
- Chevalier & Li (1999) Chevalier, R. A. and Li, Z.-Y. 1999, ApJ (Letters), 520, L29
- Dar & Rújula (2002) Dar, A. and Rújula, A. D. 2002, astro-ph/0008474
- Dermer (1996) Dermer, C. D. 1996, in Gamma Ray Bursts: 3rd Huntsville Symposium, ed. C. Kouveliotou, M. F. Briggs, & G. J. Fishman, Vol. 384 (Woodbury, New York: AIP), 744–748
- Dolphin (2000) Dolphin, A. E. 2000, PASP, 112, 1397
- Esin & Blandford (2000) Esin, A. A. and Blandford, R. 2000, ApJ (Letters), 534, L151
- Frail et al. (2001) Frail, D. A. et al. 2001, ApJ (Letters), 562, L55
- Frail et al. (2000) —. 2000, ApJ, 534, 559
- Fruchter et al. (2000) Fruchter, A., Vreeswijk, P., Hook, R., et al. 2000, GCN notice 752
- Fryer et al. (1999) Fryer, C. L., Woosley, S. E., and Hartmann, D. H. 1999, ApJ, 526, 152
- Fukugita et al. (1995) Fukugita, M., Shimasaku, K., and Ichikawa, T. 1995, PASP, 107, 945
- Galama et al. (2000) Galama, T. J. et al. 2000, ApJ, 536, 185
- Galama et al. (1998) —. 1998, Nature, 395, 670
- Garnavich et al. (2002) Garnavich, P. M., Holland, S. T., Jha, S., Kirshner, R. P., Bersier, D., and Stanek, K. Z. 2002, GCN notice 1273
- Höflich et al. (1999) Höflich, P., Wheeler, J. C., and Wang, L. 1999, ApJ, 521, 179
- Hansen (1999) Hansen, B. M. S. 1999, ApJ (Letters), 512, L117
- Holtzman et al. (1995) Holtzman, J. A., Burrows, C. J., Casertano, S., Hester, J. J., Trauger, J. T., Watson, A. M., and Worthey, G. 1995, PASP, 107, 1065
- Infante et al. (2001) Infante, L., Garnavich, P. M., Stanek, K. Z., and Wyrzykowski, L. 2001, GCN notice 1152
- Iwamoto et al. (1998) Iwamoto, K. et al. 1998, Nature, 395, 672
- Khokhlov et al. (1999) Khokhlov, A. M., Höflich, P. A., Oran, E. S., Wheeler, J. C., Wang, L., and Chtchelkanova, A. Y. 1999, ApJ (Letters), 524, L107
- Kim et al. (1996) Kim, A., Goobar, A., and Perlmutter, S. 1996, PASP, 108, 190
- Lazzati et al. (2001) Lazzati, D. et al. 2001, A&A, 378, 996
- MacFadyen & Woosley (1999) MacFadyen, A. I. and Woosley, S. E. 1999, ApJ, 524, 262
- MacFadyen et al. (2001) MacFadyen, A. I., Woosley, S. E., and Heger, A. 2001, ApJ, 550, 410
- Mazzali et al. (2002) Mazzali, P. A. et al. 2002, ApJ (Letters), 572, L61
- McKenzie & Schaefer (1999) McKenzie, E. H. and Schaefer, B. E. 1999, PASP, 111, 964
- Olsen et al. (2001) Olsen, K., Brown, M., Schommer, R., and Stubbs, C. 2001, GCN Notice 1157
- Paczyński (1988) Paczyński, B. 1988, ApJ, 335, 525
- Perlmutter et al. (1997) Perlmutter, S. et al. 1997, ApJ, 483, 565
- Piran et al. (2001) Piran, T., Kumar, P., Panaitescu, A., and Piro, L. 2001, ApJ (Letters), 560, L167
- Piro et al. (2001) Piro, L. et al. 2001, GCN notice 1147
- Price et al. (2002a) Price, P. A., Schmidt, B. P., and Kulkarni, S. R. 2002a, GCN notice 1259
- Price et al. (2002b) Price, P. A. et al. 2002b, ApJ (Letters), 572, L51 (Paper II)
- Ramirez-Ruiz et al. (2001) Ramirez-Ruiz, E., Dray, L. M., Madau, P., and Tout, C. A. 2001, MNRAS, 327, 829
- Reichart (1999) Reichart, D. E. 1999, ApJ (Letters), 521, L111
- Reichart (2001) —. 2001, ApJ, 554, 643
- Sahu et al. (2000) Sahu, K. C. et al. 2000, ApJ, 540, 74
- Schmidt et al. (1998) Schmidt, B. P. et al. 1998, ApJ, 507, 46
- Sokolov (2001) Sokolov, V. V. 2001, Bull. Spec. Astrophys. Obs., 51, 38
- Stanek et al. (2001) Stanek, K. Z., Garnavich, P. M., and Wyrzykowski, L. 2001, GCN notice 1151
- Stanek & Wyrzykowski (2001) Stanek, K. Z. and Wyrzykowski, L. 2001, GCN Notice 1160
- Stetson (1987) Stetson, P. B. 1987, PASP, 99, 191
- Vietri & Stella (1998) Vietri, M. and Stella, L. 1998, ApJ (Letters), 507, L45
- Waxman & Draine (2000) Waxman, E. and Draine, B. T. 2000, ApJ, 537, 796
- Woosley (1993) Woosley, S. E. 1993, ApJ, 405, 273
- Wyrzykowski et al. (2001) Wyrzykowski, L., Stanek, K. Z., and Garnavich, P. M. 2001, GCN notice 1150
| Filter | aaMean time since GRB trigger on 21.7828 Nov 2001 UT. | Int. | bbIn the fourth column, the effective wavelength of the filter based upon the observed spectral flux distribution of the transient at the given epoch. In the fifth column, the flux is given at this effective wavelength in an 0′′.5 radius. The observed count rate, corrected for CTE effects, was converted to flux using the IRAF/SYNPHOT package. An input spectrum with constant was first assumed. Then approximate spectral indices between each filter were computed and then used to re-compute the flux and the effective wavelength of the filters. This bootstrapping converged after a few iterations. The HST photometry contains an unknown but small contribution from the host galaxy at the OT location. We attempted to estimate the contamination of the host at the transient position by measuring the host flux in several apertures at approximate isophotal levels to the OT position. We estimate the contribution of the host galaxy to be Jy, Jy, Jy, Jy, and Jy. To correct these numbers to “infinite aperture” multiply the fluxes by 1.096 (Holtzman et al., 1995). These fluxes have not been corrected for Galactic or host extinction. | bbIn the fourth column, the effective wavelength of the filter based upon the observed spectral flux distribution of the transient at the given epoch. In the fifth column, the flux is given at this effective wavelength in an 0′′.5 radius. The observed count rate, corrected for CTE effects, was converted to flux using the IRAF/SYNPHOT package. An input spectrum with constant was first assumed. Then approximate spectral indices between each filter were computed and then used to re-compute the flux and the effective wavelength of the filters. This bootstrapping converged after a few iterations. The HST photometry contains an unknown but small contribution from the host galaxy at the OT location. We attempted to estimate the contamination of the host at the transient position by measuring the host flux in several apertures at approximate isophotal levels to the OT position. We estimate the contribution of the host galaxy to be Jy, Jy, Jy, Jy, and Jy. To correct these numbers to “infinite aperture” multiply the fluxes by 1.096 (Holtzman et al., 1995). These fluxes have not been corrected for Galactic or host extinction. | Vega |
|---|---|---|---|---|---|
| Time | MagnitudeccTabulated brightnesses in the Vega magnitude system ( mag, mag, mag, mag; Holtzman et al. 1995). Subtract 0.1 mag from these values to get the infinite aperture brightness. These magnitudes have not been corrected for Galactic or host extinction. | ||||
| (days) | (sec) | (Å) | (Jy) | (mag) | |
| Epoch 1 | |||||
| F450W | 13.09 | 1600 | 4678.52 | 0.551 0.037 | = 24.867 0.073 |
| F555W | 13.16 | 1600 | 5560.05 | 0.996 0.049 | = 23.871 0.056 |
| F702W | 13.23 | 1600 | 7042.48 | 1.522 0.072 | = 23.211 0.054 |
| F814W | 14.02 | 1600 | 8110.44 | 1.793 0.042 | = 22.772 0.032 |
| F850LP | 14.15 | 1600 | 9159.21 | 1.975 0.103 | |
| Epoch 2 | |||||
| F555W | 23.03 | 1600 | 5630.50 | 0.647 0.035 | = 24.400 0.061 |
| F702W | 23.09 | 1600 | 7002.71 | 1.271 0.051 | = 23.382 0.048 |
| F814W | 24.83 | 1600 | 8105.05 | 1.495 0.053 | = 22.982 0.043 |
| F850LP | 24.96 | 1600 | 9166.39 | 1.708 0.100 | |
| Epoch 3 | |||||
| F555W | 27.24 | 1600 | 5711.00 | 0.378 0.027 | = 25.071 0.076 |
| F702W | 27.30 | 1600 | 7043.85 | 0.981 0.036 | = 23.697 0.044 |
| F814W | 28.10 | 1600 | 8164.90 | 1.301 0.070 | = 23.157 0.061 |
| F850LP | 28.16 | 1600 | 9188.39 | 1.635 0.092 | |
| Epoch 4 | |||||
| F555W | 77.33 | 2100 | 5604.61 | 0.123 0.014 | = 26.173 0.118 |
| F702W | 76.58 | 4100 | 7042.09 | 0.224 0.019 | = 25.264 0.092 |
| F814W | 77.25 | 2000 | 8149.18 | 0.294 0.020 | = 24.762 0.073 |