Milli-arcsecond scale Rotation Measure in the CSS Quasars 0548165 and 1524136
Two Compact Steep-spectrum Sources (CSSs), 0548165 and 1524136, chosen from a list of CSSs with polarization percentages that decrease with decreasing frequency and high rotation measure values (RMrad m-2) on arcsecond scales, were observed with the VLBA at 4.9 and 8.4 GHz. RM values up to rad m-2 were found in several regions along the jets in both sources. We suggest that a thin screen of magneto-ionic material with about 1 kpc thickness is responsible for these high RMs. The observed depolarization may be due to beam depolarization and/or inhomogeneities in the magnetic field.
Key Words.:
Compact Steep-spectrum Sources: general; VLBI polarization; individuals: 0548+165, 15241361 Introduction
Compact Steep-spectrum Sources (CSSs, e.g. Pearson et al. 1985; Fanti et al. 1990) are physically small objects with sub-galactic dimensions. Their structures and sizes are possibly affected by the ambient gas in the central regions of the parent optical objects. At sub-arcsecond resolution these sources often show strongly distorted structures with recognizable jet-like features (Fanti et al. 1986; Spencer et al. 1991), consistent with strong dynamical interactions between the jets and the ambient media. Most CSSs show low ( 1) percentage polarization at or below 5 GHz (Saikia 1991; Saikia, Singal & Cornwell 1987). However, the median polarization increases with frequency (van Breugel et al. 1992; Saikia 1995, Saikia et al. 2001) suggesting that the observations at lower frequencies are affected by Faraday depolarization. A number of CSSs have very high RMs, of the order of several thousand rad m-2. To explain both the small linear sizes and the low polarizations at centimeter wavelengths, it has been postulated that CSSs are cocooned in dense gaseous envelopes (e.g. Mantovani et al. 1994). Supporting evidence for such envelopes comes from optical spectroscopy (O’Dea 1998).
The largest structural distortions in CSSs are often seen in sources dominated by jets, though this may be due in part to a selection effect caused by projection effects (e.g. Spencer 1994). However, images of CSSs do indicate that intrinsic source distortions are caused by interactions with a dense, inhomogeneous gaseous environment. This view is supported by the fact that the most distorted and complex structures are found in objects with very weak cores. Additionally, apparent superluminal motions are rare among CSSs, the only known cases to exhibit such motions being 3C147 (Alef et al. 1990) and 3C138 (Cotton et al. 1997).
In addition to distorted structures, increased asymmetry in the location of the outer components also suggests that these components are evolving through a dense asymmetric environment in the central regions of the galaxies (Sanghera et al. 1995; Saikia 1995). Sub-arcsecond polarimetry has provided evidence in favour of the interaction of these components with dense clouds of gas. For example, the southern component of 3C147 has a much higher RM than the northern component, is brighter, closer to the nucleus, and has the expected signature of a jet colliding with a cloud of gas on the southern side of the galaxy (Junor et al. 1999).
As noted by Murgia et al. (1999), about 10-15% of CSSs, mainly quasars, are jet-dominated with complex or highly asymmetric structures and may represent a different class of “frustrated” objects where strong jet-cloud interactions are at work.
In most of the core-jet structures, the derived magnetic field configurations are parallel to the source major axis, as is found for VLBI-scale jets in quasars (Cawthorne et al. 1993). In core-dominated QSOs, high rest-frame Faraday rotation measures ( rad m-2) are found in the inner 20 pc of the nuclear region (Taylor 1999).
Polarimetric observations of CSSs provide a useful probe of the physical conditions in the gaseous environment of these young sources. However, the number of CSSs for which detailed polarization information is available is still rather small. To improve this situation, we are conducting a series of observations to image several sources from a list of CSSs having reasonable degrees of polarized emission and clear signatures of interaction between radio emission and the environment, namely fractional polarizations that decrease with increasing wavelength, and high values of rotation measure (RM 450 rad m-2 in the source rest frame).
1.1 The two target sources
So far, most of the sources observed in our candidate list are QSOs. The resulting images will be useful for a direct comparison with the polarization structures found in core-dominated QSOs. Here we will present and discuss new VLBA polarization observations of the two CSS quasars, 0548165 and 1524136.
In arcsecond-scale images, 0548165 shows an asymmetric structure with a strong unresolved component coincident with a quasar at redshift 0.474, and a faint secondary component 3 arcsec northward. Most of the polarized emission comes from the main component. This emission is strongly depolarized going from 15 to 5 GHz, with a rest-frame rotation measure of 1934 rad m-2 (Mantovani et al., 1994). The magnetic field direction derived from the derotated electric vectors is aligned almost east-west, which is also the direction of the inner part of the milli-arcsecond jet. Images obtained with the European VLBI Network at 1.6 and 5 GHz (Mantovani et al., 1998) show a collimated thin jet with a noticeable bend at 80 mas ( pc) from the core. However, the jet does not lose its collimation after the bend and can be tracked for an additional 75 mas. It is worth mentioning that while the faint component is located 3 arcsec northward, the jet points South.
1524136 has a steep spectrum classified as C- (i.e. inverted at low frequency) by Steppe et al. (1995) from observations made in the range 90 MHz–230 GHz. The Einstein 0.2–4.5 keV X-ray luminosity is 2.7 erg sec-1 (Wilkes et al. 1994). Images from VLA observations of 1524136 (Mantovani et al. 1994) show a rather compact object which is resolved into a double source, at 15 GHz. The separation between the two components is 330 mas. 1524136 has a rest-frame RM=840 rad m-2 and does not depolarise between 15 and 5 GHz.
Table 1 summarizes the physical parameters derived for the two sources from these previous observations. The source name is followed by the Optical Identification (OI), Redshift, Apparent Visual Magnitude, log(Spectral Power) at 5 GHz in W Hz-1, Spectral Index (), Linear Size (LS) in pc (H0 = 100 km s-1 Mpc-1 and q0 = 0.5).
| Source | OI | LS (pc) | ||||
|---|---|---|---|---|---|---|
| 0548165 | Q | 0.474 | 17.0 | 26.46 | 0.5 | 330 |
| 1524136 | Q | 1.687 | 21.0 | 27.75 | 0.7 | 475 |
2 Observations and data analysis
The observations were carried out with the VLBA 111The Very Long Baseline Array and the Very Large Array are facilities of the National Radio Astronomy Observatory, USA, operated by Associated Universities Inc., for the National Science Foundation. and one antenna of the VLA, recording both right- and left-circular polarization (RCP, LCP) and using 1-bit sampling. The observations are summarized in Table 2. Amplitude calibration was derived using both measurements of the system temperatures made during the observations and knowledge of the antenna gains of each element of the array. Complex correlation coefficients were recovered at the Array Operations Center, Socorro (NM, USA) correlator. The recovered complex correlation coefficients are corrupted principally by phase gradients in frequency and time. These are corrected by the use of global fringe-fitting (Schwab & Cotton, 1983). Polarization calibration was performed following Cotton (1993). Calibration and subsequent imaging were done in NRAO’s analysis package. The RCPLCP delay difference was derived by fringe-fitting a short segment of the cross-hand data from a strong calibrator. Strong calibrators (DA193, OQ208, 3C84, 3C138, 3C286, 3C273, 3C345) were used to determine the instrumental polarizations of the antennas. The polarization angle calibration used observations of 3C286 at 8 GHz and of 3C273 at the four frequencies in the 5-GHz band. Low resolution images of 3C286 were made from the calibrated 8.4-GHz data using the shortest baselines in the array. The polarization position angle (PA) of the electric vector of the linearly polarized emission was then compared with that measured in VLA images of 3C286. The 8.4-GHz data for each source, calibrated in complex amplitude and phase, were edited and averaged in frequency and time to improve the signal-to-noise ratio. These data were subsequently used in the standard iterative self-calibration and imaging process. Polarized images of un-polarized calibrator sources were made to check our residual instrumental polarization. These images showed no systematic polarization miscalibration and the peak polarization signal was 0.3% of the peak total intensity signal.
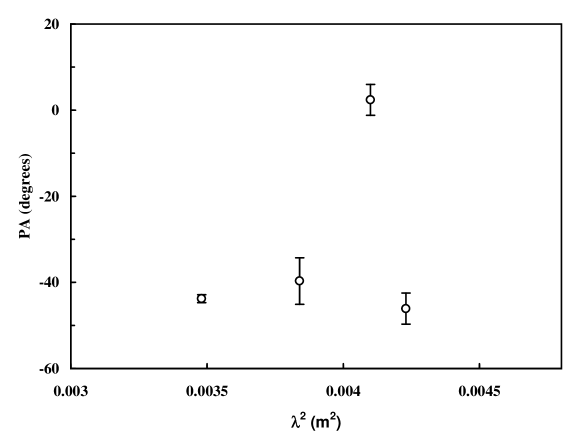
Due to logistical problems, a slightly different PA calibration strategy was used at 5 GHz. Here, four images, one for each of the observing frequencies, were made of the source 3C273. This source has a small rotation measure (RM rad m-2; Taylor et al. 1998) for the strongest polarized component along the jet. We then derived the PA values for each frequency from a small box (55 pixels) around the peak of the polarized emission along the jet of 3C273. The LCP-RCP phase differences were corrected such as to place the PAs on a slope of 80 rad m-2 in a plot of PA against . The raw results from our analysis are shown in Fig. 1. The required corrections applied to the PA for each IF were as follows: PA, PA, PA, PA. The calibrated data were then imaged and the polarization PA recovered. These agree well with the nearly contemporaneous integrated values in the UMRAO database 222This research has made use of data from the University of Michigan Radio Astronomy Observatory which is supported by funds from the University of Michigan. (UMRAO 2001).
| Source | Observing | Observing Frequency | Bw | t |
| Date | MHz | MHz | sec | |
| 0548165 | 21JAN96 | 8405 | 32 | 2 |
| DA193 | 8405 | 32 | 2 | |
| 3C138 | 8405 | 32 | 2 | |
| 1524136 | 04FEB96 | 8405 | 32 | 2 |
| OQ208 | 8405 | 32 | 2 | |
| 3C286 | 8405 | 32 | 2 | |
| 3C273 | 8405 | 32 | 2 | |
| 0548165 | 15FEB98 | 4615, 4653, 4850, 5090 | 8 | 4 |
| 1524136 | 15FEB98 | 4615, 4653, 4850, 5090 | 8 | 4 |
| OQ208 | 4615, 4653, 4850, 5090 | 8 | 4 | |
| 3C273 | 4615, 4653, 4850, 5090 | 8 | 4 | |
| 3C84 | 4615, 4653, 4850, 5090 | 8 | 4 |
3 Results
3.1 Total intensity and polarization images
Naturally-weighted images were made separately at the five observing frequencies. Natural weighting gives the best sensitivity at the expense of some resolution. To allow direct comparison between the images at different frequencies, the images were then convolved to a common effective resolution via a two dimensional, circularly-symmetric Gaussian restoring beam with a half-width of 6 mas. The r.m.s. noises in the linearly polarized intensity images are 0.15 and 0.4 mJy beam-1 at 5 and 8.4 GHz respectively. These values are close to the theoretically expected noises.
As examples, Figs. 2 and 3 show respectively the total intensity and linearly polarized intensity images obtained at 4619 MHz for 0548165, while Figs. 4 and 5 display the images for 1524136 at 4854 MHz. For the latter source, we concentrate here on the bright polarized jet-like component to the North. The wide field images at 8.4 GHz will be presented elsewhere.
The polarized and total flux density for five regions along the jet of 0548+165 (see Fig. 2) have been measured and are presented in Table 3 together with the Spol / Stot ratio for each region. The Q map and the U map were integrated over a region separately and then the polarized flux density, S, derived. Stot and Spol are in mJy, the frequency in GHz. In regions 2 and 3 the polarized flux density is below the 3- noise level. The same information for 1524136 has been collected in Table 4 for the regions marked A-F on Fig. 5.


| Region 1 | Region 2 | Region 3 | Region 4 | Region 5 | |||||||||||
|---|---|---|---|---|---|---|---|---|---|---|---|---|---|---|---|
| Stot | Spol | % | Stot | Spol | % | Stot | Spol | % | Stot | Spol | % | Stot | Spol | % | |
| 4.615 | 115.4 | 0.6 | 0.5 | 9.6 | — | — | 7.4 | — | — | 12.2 | 0.6 | 4.9 | 501.1 | 8.0 | 1.6 |
| 4.653 | 113.2 | 0.3 | 0.3 | 6.1 | — | — | 4.3 | — | — | 8.6 | — | — | 365.3 | 7.3 | 2.0 |
| 4.850 | 112.2 | — | — | 6.7 | — | — | 8.4 | — | — | 20.3 | 0.3 | 1.4 | 421.0 | 8.8 | 2.1 |
| 5.090 | 112.8 | — | — | 4.5 | — | — | 5.7 | — | — | 3.6 | 0.2 | 6.4 | 316.8 | 10.1 | 3.2 |
| 8.405 | 86.0 | 0.5 | 0.6 | 1.8 | — | — | 2.0 | — | — | 5.2 | — | — | 237.5 | 14.7 | 6.2 |
| F | E | D | C | B+A | |||||||||||
|---|---|---|---|---|---|---|---|---|---|---|---|---|---|---|---|
| Stot | Spol | % | Stot | Spol | % | Stot | Spol | % | Stot | Spol | % | Stot | Spol | % | |
| 4.615 | 54.1 | 1.5 | 2.8 | 75.7 | 3.8 | 5.0 | 27.9 | 2.0 | 7.1 | 17.9 | 3.5 | 19.6 | 539.6 | 28.1 | 5.2 |
| 4.653 | 46.7 | 1.0 | 2.1 | 31.2 | 1.6 | 5.3 | 6.4 | 1.1 | 17.5 | 8.8 | 3.4 | 38.5 | 433.6 | 25.8 | 6.0 |
| 4.850 | 52.2 | 1.0 | 1.9 | 38.8 | 2.5 | 6.5 | 18.7 | 1.5 | 8.0 | 13.0 | 2.4 | 18.1 | 464.6 | 29.8 | 6.4 |
| 5.090 | 41.9 | 1.0 | 2.4 | 25.0 | 1.9 | 7.7 | 11.2 | 0.9 | 7.9 | 4.3 | 2.0 | 46.4 | 390.4 | 26.8 | 6.9 |
| 8.405 | 42.8 | 1.3 | 3.0 | 8.6 | 1.0 | 12.1 | 6.5 | 4.1 | 63.5 | 6.8 | 2.1 | 30.2 | 200.1 | 16.2 | 8.1 |
3.2 Rotation Measures
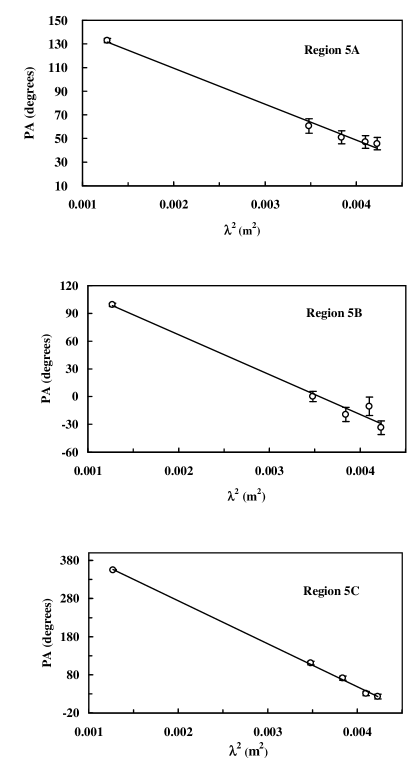
Three regions of linearly polarized emission, labelled 5A, 5B and 5C on Fig. 3, have been taken into consideration for the source 0548+165. The PA values for each of the IFs have been measured considering the distribution of values in a small box (55 pixels) around the peak of the polarized emission. The standard deviation for each value was also derived and added in quadrature to the error in the PA correction applied by the calibration procedure (3∘). The PA values and their standard deviations from the mean are given in Table 5, together with the total flux densities, the linearly polarized flux densities and the polarization percentages of the emission from the selected regions.
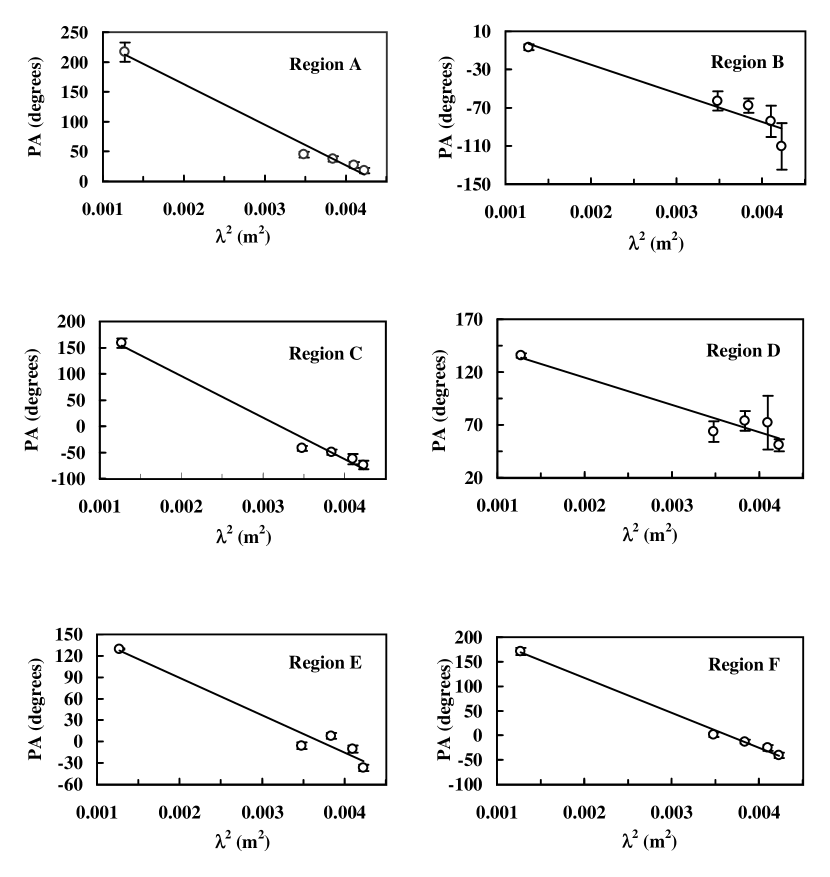
In Table 6 the same information have been collected for six regions, A-F, within 1524136. It should be noted that two of the four images made at the different C-band frequencies had better uv coverages, and consequently a higher dynamic ranges, due to the presence in the array of a VLA antenna. This causes the differences in the total flux densities for each region of the two sources seen between the four C-band frequencies listed in Tables 3 and 4.
| Region 5A | Region 5B | Region 5C | |||||
|---|---|---|---|---|---|---|---|
| MHz | m2 | PA(deg) | PA(deg) | PA(deg) | |||
| 4615 | 0.00423 | 45.6 | 5.3 | 33.6 | 7.4 | 22.7 | 6.1 |
| 4653 | 0.00410 | 47.1 | 5.3 | 10.6 | 10.0 | 30.7 | 5.8 |
| 4850 | 0.00384 | 51.0 | 5.5 | 19.4 | 7.6 | 71.0 | 5.3 |
| 5090 | 0.00348 | 60.6 | 6.2 | 0.1 | 5.6 | 110.7 | 4.9 |
| 8405 | 0.00127 | 132.9 | 1.8 | 99.4 | 1.8 | 355.2 | 1.4 |
| Region A | Region B | Region C | Region D | Region E | Region F | ||||||||
|---|---|---|---|---|---|---|---|---|---|---|---|---|---|
| MHz | m2 | PA(deg) | PA(deg) | PA(deg) | PA(deg) | PA(deg) | PA(deg) | ||||||
| 4615 | 0.00423 | 18.1 | 4.3 | 110.6 | 24.2 | 74.0 | 8.1 | 50.8 | 5.8 | 36.7 | 4.3 | 41.0 | 5.4 |
| 4653 | 0.00410 | 27.4 | 4.8 | 84.3 | 16.3 | 62.5 | 9.9 | 72.1 | 25.6 | 10.4 | 5.0 | 25.6 | 6.2 |
| 4850 | 0.00384 | 37.4 | 4.7 | 67.9 | 7.4 | 49.6 | 4.8 | 73.8 | 9.2 | 7.9 | 4.2 | 13.3 | 4.1 |
| 5090 | 0.00348 | 44.7 | 4.8 | 63.1 | 10.0 | 42.2 | 4.7 | 63.5 | 9.8 | 5.8 | 4.8 | 1.4 | 4.8 |
| 8405 | 0.00127 | 216.6 | 16.4 | 6.7 | 3.1 | 158.6 | 8.6 | 135.6 | 2.2 | 129.6 | 0.7 | 170.8 | 7.2 |
The PA vs plots for the selected regions are presented in Fig. 6 for the source 0548+165, and in Fig. 7 for the source 1524136. In Table 7, the derived RMs, the intrinsic PAs at the point of emission plus the RM in the rest frame (, i.e. corrected for the redshift) are presented for the two sources. In each plot the best fit to the data is shown. The RMs are estimated by fitting the points with a linear least-squares fit. The correlation coefficients are in all cases but for regions B and D in 1524136 where we found 0.95. Subtracting from the PAs of the 8.4 GHz point for the six regions selected in 1524136, the correlation coefficients drop to values in four cases. We found 0.82 for region B and 0.94 for region D. In conclusion, only in region D do the RM values reported in Table 7 present an ambiguity.
| Source | Region | RM | PAintrinsic | RMrf |
|---|---|---|---|---|
| (rad m-2) | (deg) | (rad m-2) | ||
| 0548+165 | 5A | 53026 | 170.25.4 | 115056 |
| 5B | 75365 | 153.113.3 | 1636141 | |
| 5C | 196836 | 140.07.4 | 427578 | |
| 1524136 | A | 118585 | 299.017.4 | 8556613 |
| B | 52299 | 34.720.1 | 3769715 | |
| C | 138599 | 254.520.1 | 10000715 | |
| D | 44882 | 165.916.7 | 3235592 | |
| E | 913112 | 193.922.7 | 6592809 | |
| F | 123952 | 258.710.6 | 8946375 |
4 Discussion
4.1 0548165
The nucleus of 0548+165 is almost certainly component 1 (see Fig. 2). Using the flux density values derived from the 1.6-GHz observations by Mantovani et al. (1998) and from the present observations at 5 and 8.4 GHz (Table 3), a spectral index of is found for component 1. The remaining components have steeper spectral indices. The projected linear size for 0548165 from the nucleus to the region where the jet shows an bend is 330 pc. Regions, 5A, 5B and 5C all show large RMs, much larger than the typical RM100 rad m-2 due to the ISM of our Galaxy in this direction (Simard-Normandin, Kronberg & Button 1981).
The magnetic field direction derived from the observations lies parallel to the tangent of the total intensity contours as we move around the bend. This suggests that the field lines are compressed by an interaction of the jet with a dense cloud. It is also of interest that this interaction does not appear to significantly disrupt or perturb the jet from a smooth flow. This is also supported by sensitive (Mk3, Mode A) -cm VLBI observations (Mantovani et al. 1998).
The largest value of RM is found in region 5C, where the jet is most bent. The value of RM then decreases going outwards along the jet from regions 5B to 5A. In the three regions, the PAs are rotated by angles larger than /2 by 6-cm band. In addition, in the region where the source structure suggests that an interaction between the jet and the ISM is taking place, the depolarization between 8.4 and 4.6 GHz is p4.6/p8.4=0.26. This indicates (Burn 1966) that the rotation is due to a ‘thin slab’ plus something else, such as a two-phase foreground medium, i.e. narrow line clouds and a hot medium are present.
The polarized signal lies predominantly on the western edge of the bent jet i.e. on the side where the putative collision occurs. This may be explained simply by compression of magnetic field lines by the collision, with consequent enhancement of both the total intensity and the linearly polarised emission.
The depolarization produced by a Faraday screen is given by:
| (1) |
(Tribble 1992) where is the fractional polarization, the wavelength, the RM dispersion assuming a stochastic Gaussian distribution, the resolution, and the RM scale fluctuation.
Assuming to be of the order of the separation between the peaks of polarized emission ( mas), 1372 rad m-2, i.e. the dispersion in the rest frame, and 7 mas, a value p4.6/p8.4 = 0.32 for the depolarization is obtained, in good agreement with the value measured in the area of the bend (see Table 3). It follows that the observed depolarization might be due to beam depolarization since the RM scale fluctuation is of the order of the resolution achieved by the present observations.
The RM values in regions 5A and 5B are similar (at the 3- level) and can be understood as being due to an external screen. In region 5C, the RM excess might be due to the presence of a NLR, which could also be responsible for the large bend in the jet. In fact, 3-D simulations of jet-cloud interactions (Norman & Balzara 1993) have shown that a jet can be deflected by angles up to 90∘ preserving its collimation after the bend. De Young (1991) showed that a jet can be deflected by interacting with a cloud in the NLR on a time scale of yr at a distance of 2–4 kpc from the nucleus.
Making the assumptions that the external screen is responsible for the RM of regions 5A and 5B, and partially in region 5C, and that the magnetic field, , along the line of sight and the thermal electron density, , are almost constant, the rotation measure is RM = . With RM = 1200 rad m-2, and a = 1 kpc thick screen, the product is 1.5 cmG. The typical range for the density of thermal electron is 0.1 – 1 cm-3, suggesting that G.
Similar values for the magnetic field were derived by Venturi & Taylor (1999) for the bending jet of 3C216.
4.2 1524136
The region of jet-cloud interaction in the case of 1524136 is situated 475 pc from the nucleus. The RM value changes going from component A to E making the astrophysical analysis more intriguing. The peak of polarized emission is found in region A. The jet changes direction in region B where, however, the RM is lower. Concerning depolarization, this is seen for regions AB and C, while region F shows no depolarization.
Following Tribble (1992), 1524136 has a depolarization p4.6/p8.4 = 0.33 assuming mas (mean distance between components), 6 mas and 2577 rad m-2. Integrating the total flux and the polarized flux over the whole source, a similar value for the depolarization is found, i.e. p4.6/p8.4 = 0.28. This result might suggest that the depolarization can be due to inhomogenities in the structure of the magnetic field responsible for the changes in the RM, caused by the external screen, on a comparable scale to that of the distances between the components. Since the differences between PAs is , we can say that the RM is due to an external screen in which the orientation of the magnetic field along the line of sight and/or the electron density, do vary along the jet in such a way that the observed variation in RMs can be reproduced.
The intensity of the magnetic field along the line of sight for each region, assuming cm-3 and a 1 kpc thick screen, is summarized in Table 8. The values obtained for in 1524136 are larger than those found for the screen in 0548165.
| Source | Region | B∥ (G) |
|---|---|---|
| 0548165 | 5(A+B+C) | 15 – 2 |
| 1524136 | A | 107 – 11 |
| B | 47 – 5 | |
| C | 125 – 13 | |
| D | 40 – 4 | |
| E | 82 – 8 | |
| F | 112 – 11 |
5 Conclusions
In this paper we have presented results obtained for the CSSs 0548+165 and 1524136 from VLBA+VLA1 observations at five frequencies. These sources were the first observed in a larger project planned to study CSSs which have polarization percentages that decrease with decreasing frequency and high values of rotation measure (RM450 rad m-2) on the arcsecond scale.
Both sources show polarized emission along their mas-scale jets, while weak polarized emission is detected in their cores. We were able to estimate rotation measures by a five-point linear fit to PA vs plots in three and six regions along the jets of 0548+165 and 1524136 respectively. The RMs obtained show very high values in both sources (RM 4000 and up to 104 rad m-2 respectively). We suggest that the high RMs are produced by a foreground screen in 1524136 and by a foreground screen plus a RM excess due to the effect of a NLR cloud for 0548+165. In recent HST optical images of CSSs, a central compact component of 300 mas, dominated by forbidden [OIII] Å and [OIII] Å emission lines, is detected. Compact emission line regions with dimensions typical of the NLR of Seyfert galaxies are also observed (Axon et al. 2000).
Estimates of the magnetic field intensity along the line of sight in the foreground screen responsible for Faraday rotation have been made on the basis of thermal electron density and screen depth. Assuming for the thermal electron density and for the Faraday screen depth, we find a magnetic field intensity value of 15 G in the foreground screen. A magnetic field in the range 40–125 G was found in 1524136. The electron density and Faraday-screen depth estimates used, are uncertain (by a factor of ten) because of lack of information on X–ray emission and on the position angle between the jet axis and the observer’s line of sight.
The observed depolarization is consistent with that derived using the Tribble (1992) model which analyzes the effects of a Faraday screen. This suggests that the depolarization is probably due to beam depolarization in 0548+165 and most likely due to inhomogeneities in the magnetic field structure of the foreground screen in 1524136.
The derived magnetic field directions follow the jets in both sources, even when the source is strongly bent due to the interaction with the dense external medium. However, the jets maintain their collimation despite a possible strong interaction with a NLR.
Finally, we note the difference between the distribution of polarised emission in this pair of two jet-dominated QSOs and that found in core-dominated QSOs. For the latter class, the highest RMs are found in the inner 20 pc of the nuclear region (Taylor 1999). In the CSSs 0548+165 and 1524136 the most polarised regions are along the jet while the nuclei are weakly polarised.
Acknowledgements.
The authors whish to thank the referee Dr. G.B. Taylor for valuable comments on the manuscript.References
- Alef W., Preuss E., Kellermann K.I. 1990, Compact Steep-spectrum & GHz-Peaked Spectrum Radio Sources, workshop held in Dwingeloo-The Netherlands on June 18-19 eds. C. Fanti R. Fanti C. P. O’Dea & R. Schilizzi, Consiglio Nazionale delle Richerche, Bologna, Italy, pag. 149
- (1) Axon D.J., Capetti A., Fanti R. et al. 2000, AJ 120, 2284
- (2) Burn B.J. 1966, MNRAS 133, 67
- (3) Cawthorne T.V., Wardle J.F.C., Roberts D.H., Gabuzda D.C. 1993, ApJ 416, 519
- (4) Cotton W.D. 1993, AJ 106, 1241
- (5) Cotton W.D., Dallacasa D., Fanti C. et al. 1997, A&A 493, 501
- (6) De Young D.S. 1991 ApJ 371, 69
- (7) Fanti C., Fanti R., Schilizzi R.T. et al. 1986, A&A 170, 10
- (8) Fanti C., Fanti R., Schilizzi R.T. et al. 1990, A&A 231, 333
- (9) Junor W., Salter C.J., Saikia, D.J. et al. 1999, MNRAS, 308, 955
- (10) Mantovani F., Junor W., Fanti R. et al. 1994, A&A 292, 59
- (11) Mantovani F., Junor W., Bondi M. et al. 1998, A&A 332, 10
- (12) Morganti R., Tadhunter C.N., Dickson R., Show M. 1997, A&A 326, 130
- (13) Murgia M., Fanti C., Fanti R. et al. 1999 A&A 345, 769
- (14) Norman M.L. and Balzara D.S 1983 in Jet in Extragalactic Radio Sources eds. K. Meisenheimer and H.-J. Röser, Springer Verlag, Berlin, p. 229
- (15) O’Dea C.P. 1998, PASP, 110, 493
- (16) Osterloo T.A., Morganti, R., Tzioumis, A. et al. 2000, AJ 119, 2085
- (17) Pearson T., Perley R.A. & Readhead A.C.S. 1985, AJ, 90, 738
- (18) Saikia D. J. 1990 in Compact Steep-spectrum & GHz-Peaked Spectrum Radio Sources, workshop held in Dwingeloo-The Netherlands on June 18-19 eds. C. Fanti R. Fanti C. P. O’Dea & R. Schilizzi, Consiglio Nazionale delle Richerche, Bologna, Italy, pag. 12
- (19) Saikia, D.J., 1995 Proc. National Academy of Sciences, 92, 11417
- (20) Saikia, D.J., Singal, A.K., Cornwell, T.J. 1987 MNRAS 224, 379
- (21) Saikia D.J., Jeyakumar S., Salter C.J et al. 2001, MNRAS 321, 37
- (22) Sanghera H. S., Saikia D.J., Luedke E. et al. 1995, A&A 295, 629
- (23) Schwab F. & Cotton W.C. 1983, AJ 88, 688
- (24) Simard-Normandin M., Kronberg P.P. & Button S. 1981 ApJSuppl 45, 97
- (25) 1999, NewAR 43, 675
- (26) Spencer R. S., Schilizzi R.T., Fanti C. et al. 1991, MNRAS 250, 225.
- (27) Spencer R. S. 1994 Compact Extragalactic Radio Sources, Proceeding of a Workshop held in Socorro, February 11-12, 1994, eds. J.A. Zensus & K.I. Kellermann, National Radio Astronomy Observatory, p. 29
- (28) Steppe H., Jeyakumar S., Saikia D.J., Salter C.J. 1995, A&AS 113, 409
- (29) Taylor, G.B. 1996, ApJ 463, 95
- (30) Taylor, G.B. 1998, ApJ 506, 637
- (31) Taylor, G.B. 1999, ApJ 533, 95
- (32) Tribble, P. C., 1992, MNRAS, 256, 281
-
(33)
UMRAO 2001
http://www.astro.lsa.umich.edu/obs/radiotel/umrao.html - (34) van Bruegel W.J.M., Fanti C., Fanti R. et al. 1992, A&A, 256, 56
- (35) Venturi T., Taylor G. B. 1999 AJ 118, 1931
- (36) Wilkes B.J., Tananbaum H., Worral D.M. et al. 1994, ApJS, 92, 53
- (37)