The enrichment history of Centauri: what we can learn from Strömgren photometry
Abstract
In this contribution, results from CCD Strömgren photometry of a statistically complete sample of red giants and stars in the main sequence turn-off region in Centauri are presented. From the location of stars in the diagram metallicities have been determined. We argue that the Strömgren metallicity in terms of element abundances has another meaning than in other globular clusters. From a comparison with spectroscopic element abundances, we find the best correlation with the sum C+N. The high Strömgren metallicities, if interpreted by strong CN-bands, result from progressively higher N and perhaps C abundances in comparison to iron. We see an enrichment already among the metal-poor population, which is difficult to explain by self-enrichment alone. An attractive speculation (done before) is that Cen was the nucleus of a dwarf galaxy. We propose a scenario in which Cen experienced mass inflow over a long period of time, until the gas content of its host galaxy was so low that star formation in Cen stopped, or alternatively the gas was stripped off during its infall in the Milky Way potential. This mass inflow could have occurred in a clumpy and discontinuous manner, explaining the second peak of metallicities, the abundance pattern, and the asymmetrical spatial distribution of the most metal-rich population.
Sternwarte der Universität Bonn, Auf dem Hügel 71, 53121 Bonn, Germany, email: mhilker@astro.uni-bonn.de
Departamento de Física, Universidad de Concepción, Casilla 160-C, Concepción, Chile, email: tom@coma.cfm.udec.cl
1. Introduction
Many medium and high resolution spectroscopy investigations (e.g. Brown & Wallerstein 1993; Norris & Da Costa 1995; Smith et al. 2000) have shown that among the stars in Cen there exist strong variations of nearly all element abundances investigated so far. This is reflected by the intrinsic broad scatter of the red giant branch that cannot be explained by internal reddening only (e.g. Norris & Bessell 1975). Concerning the iron abundance, several authors have confirmed that there exists a main metal-poor population, with a peak at about [Fe/H] dex, and a broad tail to higher metallicities with a peak at about [Fe/H] dex (Norris, Freeman, & Mighell 1996; Suntzeff & Kraft 1996). This high metallicity tail extends to values of [Fe/H] dex as deduced from the detection of a very red giant branch (RGB) that is well separated from the bulk of the RGB stars (Lee et al. 1999; Pancino et al. 2000).
The abundance variations in Cen point to a more complicated star formation history than that for other globular clusters (GCs) which contain a homogeneous stellar population. Whereas the CNO variations might be explained by evolutionary mixing effects in the stellar atmosphere as well as by mixing in the protocloud (e.g. Bessell & Norris 1976), the iron abundance variations need another explanation (e.g. Vanture, Wallerstein, & Brown 1994; Norris & Da Costa 1995). An increasing number of groups working on Cen favour an extended period of star formation connected with self-enrichment as the interpretation of their data. Smith et al. (2000, and this volume) studied the abundances of s-process elements in RGB stars with high resolution spectroscopy. A strong increase of [Ba/Fe] and [La/Fe] for metal-poor stars with [Fe/H] dex followed by a flat relation for higher metallicities led the authors conclude that low mass AGB stars have contributed to the enrichment. These stars have an evolutionary time of at least 1 Gyr. Metallicity and age estimates from Strömgren photometry in the main sequence turn-off region (Hughes & Wallerstein 1999, and this volume) also suggest an age spread of at least 3 Gyr for stars between [Fe/H] dex (the metal-richest stars also being the youngest). An age spread also was confirmed in our analysis of Strömgren data (Hilker & Richtler 2000), but will not be the main topic in this contribution. Here, we present the analysis and interpretation of Strömgren metallicities for more than 1500 RGB stars in Cen.
2. Strömgren photometry in Centauri
Strömgren photometry has been proven to be a very useful metallicity indicator for globular cluster giants and subgiants (e.g. Richter, Hilker, & Richtler 1999, Hilker 2000, Grebel & Richtler 1992, Richtler 1989). The location of late type stars in the Strömgren diagram is correlated with their metallicities, especially with their iron and CN abundances. Whereas the color is not sensitive to metallicity, the Strömgren filter includes several iron absorption lines as well as the CN band at 4215Å, and therefore is a metallicity sensitive index (e.g. Bell & Gustafsson 1978). Within a certain color range, mag, the loci of constant iron abundance of giants and supergiants can be approximated by straight lines. This is valid for CN-“normal” ( CN-weak) stars. CN-strong stars, due to their higher absorption in the filter, scatter to higher values and therefore mimic a higher Strömgren metallicity than their actual iron abundance would correspond to. This can be used to learn more about the CN variations in Cen. A recent calibration of the Strömgren metallicity for CN-“normal” stars is presented in Hilker (2000).
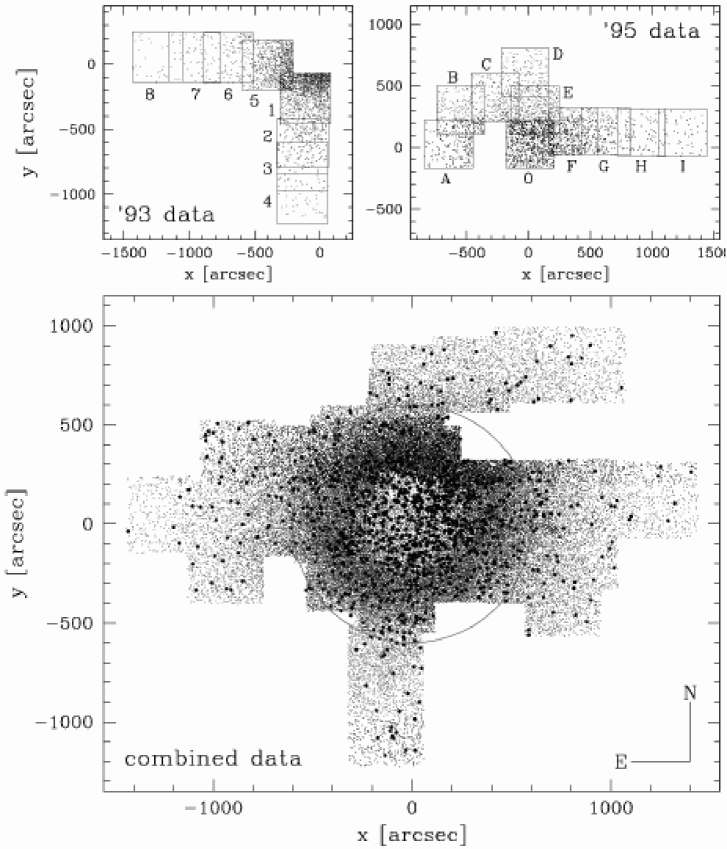
The observations of Centauri have been performed in two observing runs in 1993 and 1995 with the Danish 1.54m telescope at ESO/La Silla. The details of the observations, data reduction, calibration and photometry are presented in Hilker (2000) and Hilker & Richtler (2000). The positions of all observed fields are illustrated in Fig. 1.
2.1. Color magnitude diagram and two-color diagram
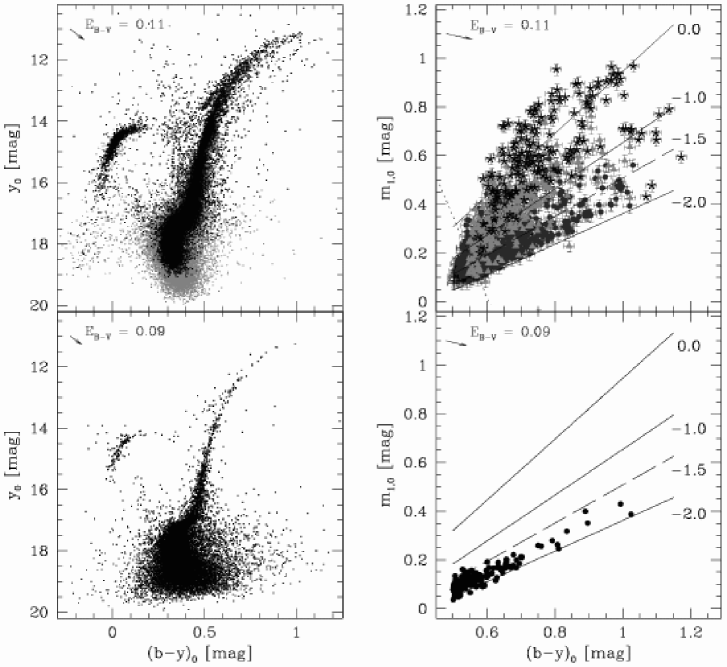
In Fig. 2 the color magnitude diagrams (CMD) and two-color diagrams of Cen and M55 are plotted. In the CMD of Cen, all stars with a photometric error less than 0.05 mag (grey dots) and less than 0.03 mag ( 20620 stars, black dots) in and are shown. The colors in all plots have been corrected for reddening with a value of mag for Cen (Zinn 1985; Webbink 1985; Reed, Hesser, & Shawl 1988; Gonzalez & Wallerstein 1994), and mag for M55 (the mean value between Harris 1996 and Richter et al. 1999).
In both diagrams the difference between a single age and metallicity cluster, as M55, and the unusual cluster Cen can be seen very nicely. The broad red giant branch of Cen cannot be explained by photometric errors or internal reddening. Since the color is not affected by CN variations, the spread in the RGB must be due to a spread in the overall metallicity (iron abundance) and/or age.
The diagram (Fig. 2, upper right panel) is indicative for the metallicity distribution and CN variations of the red giants in Cen. The 1500 red giants that have been selected from the CMD show a large scatter between and 1.0 dex in their Strömgren metallicity. The Strömgren metallicity is defined as
| (1) |
following the calibration by Hilker (2000). The trend exists that stars on the blue side of the RGB are mostly metal-poor, whereas the stars redwards of the “main” RGB populate the metal-rich regime.

2.2. The metallicity distribution
In Fig. 3 the metallicity histogram of RGB stars with an accurate metallicity determination (stars redder than the dotted line in Fig. 2) is presented. [Fe/H]ph denotes the Strömgren metallicity. A peak around dex with a sharp cutoff towards low metallicities at dex represents the blue RGB stars. Also most of the AGB stars bluewards the main RGB belong to this metal-poor population. Stars from the red side of the RGB have metallicities mainly in the range to dex, with a probable second peak at about dex. Our metallicity distribution resembles fairly well the results of Norris et al. (1996). Stars with Strömgren metallicities higher than about dex are supposed to be CN-rich stars of one of the two populations, since no stars with an iron abundance higher than that has been found in the cluster. Most of them are redder than the “main” RGB, thus belong to a more metal-rich population. When selecting the RGB stars by a cut in the CMD that corresponds to a cut in their mass function (more ore less a luminosity cut), the proportion of metal-poor to metal-rich stars is about 3:1.
3. Strömgren metallicity versus Fe, C and N abundance
The metallicity distribution found in our investigation is qualitatively very similar to that found by Norris et al. (1996) and Suntzeff & Kraft (1996) from their Calcium abundance measurements. In Fig. 4 we show the metallicity distribution of those stars that are in common in Suntzeff & Kraft’s and our samples. Their Calcium abundances have been transformed to iron abundances according to the relation given in their paper.
The behaviour of Cen regarding its relation between Fe abundance and Strömgren metallicity is remarkably different from that of other globular clusters (open circles in the lower panel of Fig. 4), including NGC 6334, NGC 3680, NGC 6397, Melotte 66, M22 and M55, taken from Hilker (2000).

The straight relation up to -1 dex (with large scatter towards higher metallicities) is in striking contrast, for example, to the situation in M22 (Richter et al. 1999), where there is a considerable scatter at a fixed iron abundance. This relation already is present among the metal-poor stars (see small plot in the upper left of Fig. 4). No systematic effect that could cause this relation has been determined. It is not dependent on a magnitude, color or error selection. So, what determines the Strömgren colors in Cen? An answer may come from a comparison of the available elements abundances for 40 giants from Norris & Da Costa (1995). Fig. 5 shows in four panels (on the left) the Strömgren metallicity vs. [Fe/H]sp, [C/H], [N/H], and [C+N/H]. It is apparent that the correlation with [Fe/H]sp and [C/H] is very poor. It is better for [N/H] (note the large error of 0.4 dex given for the N-abundance by Norris & Da Costa (1995)), and best for [C+N/H].
On the other hand, there is a close correlation of [Fe/H]sp vs. [C+N/H] (Fig. 5, right panel) (which, by the way, is suprising, given the above large error of the N abundance). The two most deviating stars are ROA 139 and ROA 144. They have the highest N-abundances in this sample, simultaneously low oxygen abundances and hence are probably strongly affected by mixing effects. If we skip them, a linear regression returns for the slope, indicating that the increase in C+N is faster than in [Fe/H].
What can we learn from the C+N variations in Cen? Can they be understood as a stellar evolutionary effect?
As Norris & Da Costa point out, C-depletion as a signature of the CNO-cycle is present and one may see the increase in the C-abundance with [Fe/H] in their Fig. 8a to have its cause in the decreasing efficiency of the mixing-up of processed material with increasing metallicity (and thus mimicking a C-enhancenment), as it is theoretically expected (e.g. see Kraft 1994). But then, the increase in C+N is not easy to understand, since it is dominated by an increase of N, where we would expect a decrease, and, after all, the sum of C and N should be less sensitive to mixing effects.

So, is this a primordial effect? (We use the term “primordial” for pre-enriched material as the alternative to mixing effects).
A striking fact for this possibility is that we see in Fig. 4 the relation between [Fe/H] and Strömgren metallicity already present among the old population, where it is hard to understand that such small differences in [Fe/H] would cause a regular pattern in the mixing effects. We thus propose that the gradual enrichment of C+N, indicated by the Strömgren colors, is to a large degree primordial.
The suggestion that a part of the proto-cluster material of Cen has undergone considerable C-enrichment has also been made by e.g. Cohen & Bell (1986) and Norris & Da Costa (1995) based on the unique presence of CO-strong stars. However, the [C/Fe] abundance in the metal-poor population is about 0.7 dex according to Norris & Da Costa, which is close to 0.5 dex, theoretically expected from the yield ratios in SNe II (Tsujimoto et al. 1995). Also a mean [O/C]-value of approximately 1 dex, as one would read off from Norris & Da Costa is close to the expected yield ratios.
If, say, 2.2 dex111note that in our paper (Hilker & Richtler 2000) erranously the value 0.2 dex was given would be the “starting” value of [C/H], one would require a considerable C-contribution from intermediate-age stars, which by itself is not easy to understand for the first stars formed in Cen. Therefore, if the increasing [C+N/Fe] among the metal-poor old population was, at least to large part, primordial, one is driven to the conclusion that already the star formation process, which formed these stars, did not took place in a single burst within a well-mixed environment, but must have been extended in time, allowing intermediate-age populations to contribute.
We shall attempt to combine these abundance pattern with other properties within a scenario later on.
4. Strömgren metallicity versus other properties in Centauri
As already mentioned in the introduction the metallicity spread is accompagnied by an age spread. Metallicity determinations and isochrone fitting of stars in the main sequence turn-off region (Hughes & Wallerstein 1999; Hilker & Richtler 2000) revealed that the more metal-rich stars tend to be younger. Whereas all stars of the main RGB with metallicities between and dex might be compatible with one age, the populations with metallicities around and dex are at least 2–4 and 3–5 Gyr younger. If the age metallicity relation in Cen can be understood as a continuous enrichment process after an initial starburst with [Fe/H] dex, the age spread of the enrichment lies between 3 and maximally 5 Gyr.

4.1. Spatial distribution of sub-populations
To investigate the spatial distribution of sub-populations in Cen, the 1500 red giants with metallicity determinations have been divided into four sub-populations according to their age and metallicities: (1) an old metal-poor population from the blue side of the RGB, (2) a more metal-rich, mostly CN-rich, and younger population from the red side of the main RGB, (3) the youngest, very metal- and CN-rich population, and (4) the AGB stars of the old population.
Both, the cumulative radial distributions as well as the angular distributions of the sub-populations have been examined. For the angular distribution, only stars within a radius of from the cluster center have been included. The number counts have been normalised to the total number for each selection. The angle is defined as in East direction, North, and South.
The population of the selected 83 AGB stars, which is very metal-poor, is distributed as the metal-poor pop (1), as expected. Deviations in the angular distribution are statistically not significant.
When comparing population (1) with population (2) a difference in their radial distributions becomes evident in the sense that the ratio of the metal-rich to metal-poor stars is higher in the cluster center than in its outskirts (see Fig. 6, left panel). This result is statistically significant. A KS test reveals a probablity of less than 0.1% that the cumulative number counts of both populations follow the same radial distribution.
The radial distribution of the stars in pop (3) appears less concentrated than the average cluster population. Some of them might be solar metallicity foreground stars. However, others are confirmed cluster member stars. The angular distribution of pop (3) shows a concentration of stars towards the South and a slight depression in the West and North direction (see Fig. 6, right panel) which can explain the different radial distribution. We note that also Jurcsik (1998) reported on a spatial metallicity asymmetry in Cen. She found that the most metal-rich stars with [Fe/H] dex are concentrated towards the South, whereas the most metal-poor stars with [Fe/H] are more concentrated in the North. As shown in Fig. 6, nearly 30% of our metal-rich sample are located in the Southern angular bin, but an asymmetrical distribution in the North-South direction of the most metal-poor stars cannot be confirmed. The probability that the angular distribution of the metal-poor stars of Jurcsik’s and our sample agree is less than 7% (KS test). Also less than 7% is the probability that metal-rich and metal-poor stars are distributed equally.
4.2. Metallicity and kinematics
Along with the abundance variations in Cen, different sub-populations show clearly different kinematical behaviour. A dynamical analysis of 400 stars in the Norris et al. (1996) sample of RGB stars with calcium abundance measurements revealed a rotation of the metal poor component, whereas the metal rich one is not rotating (Norris et al. 1997) Recent studies with larger radial velocity samples, as presented in this conference proceedings (Gebhardt et al.; Seitzer et al.; Cannon et al.) confirm this result.
A match of our data set with that of Xie, Pryor & Gebhardt (private communication) shows similar results. Within 3′ radius we have more than 1000 RGB stars in common. Their radial velocity dispersion peaks in the center at about 19 km/sec, falling to 16 km/sec at a radius of 2′. When dividing the sample in 860 metal-poor ([Fe/H]) and 150 metal-rich stars, one clearly can see differences in their rotation behaviour. Whereas metal-poor stars show a strong sign of rotation around the semi-minor axis of the elliptical shape of Cen, no rotation is seen among the most metal-rich stars. At 3′ radius from the center the rotation velocity of the metal-poor stars reaches 3.6 km/sec. Further detailed anlysis of both data sets will show what more can be learned about the connection between chemical enrichment and kinematical behaviour.
5. A scenario
5.1. Problems with self-enrichment within Centauri
Can the younger populations in Cen be enriched by the older one? In trying to demonstrate the problems with this picture we use oxygen as a tracer for the synthesized material. First we estimate the number of SNe type II having occured in the old population. If we adopt the mass of Cen to be solar masses (Pryor & Meylan 1993), the metal-poor population comprises about M. We get 45000 SNe for all stars more massive than 10 M when assuming a Salpeter mass function between 0.1 and 100 M. The total oxygen mass released by these SNe is about 50000 M (based on Table 7.2 of Pagel 1997). On the other hand, following Norris & Da Costa (1995), a mean [O/H] value for the metal-rich population is 0.7 dex (adopting [O/Fe] = 0.5 dex and [Fe/H] = 1.2 dex), so we calculate the actual oxygen mass to be 2300 M, if the total mass of the young population is M. Since Smith et al. (2000) see no signature of enrichment by SNe Ia up to [Fe/H] = 0.9 dex, it is reasonable to assume that the oxygen mass, which was present already in the gas before the enrichment, scales with the iron abundance. The ratio is about a factor of 3, so we have 1500 M of newly synthesized oxygen in the metal-rich population. This means that only 3% (or less) of the released oxygen has been retained. If we do this exercise with the iron abundance, we have 1000 M of iron released (Pagel, p. 158), and we have about 20 M of newly synthesised iron present. Of course, the exact numbers are insignificant, but the above consideration suggests that practically all material must have been blown out.
This is also plausible from the energy point of view. We have a release of kinetic energy of about erg from the SNe (neglecting previous stellar winds and ionizing radiation), while the binding energy of the “proto-young population” is about erg, if for simplicity we imagine that the gas was confined within a half-light radius of 7 pc (Djorgovski 1993).
Similar factors must apply to the overall fraction of retained gas, implying an unreasonably large protocluster mass (neglecting the problem of how a bound system could survive after such strong mass loss), if one wants to keep the hypothesis of a permanently retained large gas fraction within Cen.
But we have even more problems. Smith et al. (2000) only detect weak signatures of SNe Ia in the metal-rich population, expressed by the low [Cu/Fe] value of dex. On the other hand, the age spread, the increase of s-process elements, and the interpretation of the Strömgren results as primordial enrichment of C and N speak for the contribution of an intermediate-age population. Within 2-3 Gyr, at least some Ia events should have ocurred, making the problem with the low iron content even worse, if they would have provided iron to the young population. Why do we not see their debris?
Moreover, it is remarkable that we find the signature of intermediate-age populations already among the old population, indicated by the evidence that the same relation between [Fe/H] and Strömgren metallicity (Fig. 4), which connects the oldest and the younger population, appears already to be present at the lowest metallicities. In this respect, the general behaviour of the Strömgren metallicities resembles the well established enrichment of s-process elements relative to iron. How can these stars, in a regular pattern, be self-enriched simultaneously by SNe II and by intermediate-age stars?
It may be that one can construct a scenario in which these oddities can be explained by pure self-enrichment (i.e. Smith et al. 2000). However, we wish to point out an alternative, which seems to offer an easier way towards an understanding of Cen.
5.2. Just imagine …
… Cen formed within a formerly much larger entity, outside the Milky Way, and at the central position of its ex-host-object. We (speculatively) assume that this object was a dwarf galaxy with Cen as its nucleus. We additionally speculate that its star formation rate was triggered over a very extended period (perhaps more than 5 Gyr) by mass supply from the overall gas reservoir of its host galaxy. This scenario can explain all characteristic properties of Cen found so far.
This gas inflow, already enriched in the host galaxy to at least dex, could have occured in a non-spherical, clumpy and discontinuous manner, providing angular momentum to the first population in Cen and thus giving rise to the flattening of Cen. That no significant rotation is seen in the more metal-rich population might be due to the loss and transfer of angular momentum from the newly infalling gas to the very massive rotating dark matter halo of the first population (see ideas by Binney, Gerhard, & Silk 2001). We have no problems with the competition of gas removal and simultaneous enrichment. The intermediate-age population stars in Cen released their gas, for instance by planetary nebulae, in a much less violent fashion and the infalling gas mixed with this C and N rich material, which also was rich in s-process elements, giving rise to a new star formation period. The large scatter in the Strömgren metallicities may thus be in part primordial, reflecting the incomplete mixing of the infalling gas with the C-N-rich material. Both SNe II,Ib and Ia would sweep up the gas almost completely, terminating star formation for a short while, until further mass infall becomes possible.
It also seems natural that younger and more metal-rich populations show other kinematic and spatial properties, including asymmetries in their spatial distribution, depending on the details of the infall process. The initially asymmetrical distribution of the most metal-rich population is probably still not relaxed due to the long relaxation time of Cen beyond the half-mass radius (Meylan 1987). We would then expect many periods of strong star formation alternating with periods of mass infall. The mass infall would finally cease after the gas content of the host galaxy has become sufficiently low or was perhaps removed by ram pressure stripping in the Galactic halo during its infall in the Milky Way (e.g. Blitz & Robishaw 2000).
The subsequent evolution can be sketched as follows: on its retrograde orbit the dwarf galaxy spiralled towards the Galactic center (Dinescu, Girard, & van Altena 1999). On its way it lost the outermost stellar populations by tidal stripping, including the likely member globular clusters NGC 6779 (Dinescu et al. 1999). Finally, after its stellar population dissolved totally, the nucleus Cen remained and appears now as the most massive cluster of our Milky Way.
6. Summmary and concluding remarks
For about 1500 red giants in Centauri, Strömgren metallicities have been determined. Almost 2/3 of them turn out to be metal-poor, with a peak at [Fe/H]1.7 dex. Beyond this peak, the metallicity distribution shows a sharp cutoff towards lower metallicities, but a broad, long tail towards higher metallicities. Most of these stars are CN-rich and have ages 2-5 Gyr younger than that of the oldest population.
The comparison between [Fe/H] abundances derived from high-dispersion spectroscopy of Norris & Da Costa (1995) and Strömgren metallicities shows a behaviour distinctly different from that observed in other globular clusters. There is hardly a correlation with [Fe/H], but a close correlation with [C+N/H].
However, the comparison of Strömgren metallicities to the larger sample of Suntzeff & Kraft (1996) shows that there is a coupling to the iron abundance indicating that this has a primordial cause. It is already visible among the metal-poor population and we interpret it as another manifestation of the well established increasing contribution of intermediate-age populations with increasing iron abundance.
The comparison of the cumulative radial distribution of the two main populations in Cen exhibits a higher concentration of the metal-rich stars. The youngest, most metal-rich population has an asymmetrical distribution around the cluster center with a concentration towards the South.
When combining the kinematics of more than 1000 red giants with our Strömgren metallicities, a significant rotation of the metal-poor population was confirmed, whereas the most metal-rich stars do not rotate.
Our findings are consistent with a scenario in which enrichment of the cluster has taken place over a period of 3–6 Gyr. The conditions for such an enrichment can perhaps be found in nuclei of dwarf galaxies. All characteristic properties of Cen (flattening, abundance pattern, age spread, kinematic and spatial differences between metal-poor and metal-rich stars) could be understood in the framework of a scenario, where infall of previously enriched gas occured in Cen over a long period of time. Only the enrichment of nitrogen, carbon, and s-process elements took place within Cen, where the infalling gas mixed with the expelled matter from AGB stars.
The capture and dissolution of a nucleated dwarf galaxy by our Milky Way and the survival of Cen as its nucleus would thus be an attractive explanation for this extraordinary object. Several contributions in this conference proceedings also support this idea and rule out other possibilities like a chemically diverse parent cloud or a merger of two clusters.
Acknowledgments.
We thank Bingrong Xie for providing us radial velocities from their Fabry-Perot sample (see also Gebhardt, this volume). This project was partly supported through ‘Proyecto FONDECYT 3980032’.
References
Bell, R. A., Gustafsson, B. 1978, A&AS, 34, 229
Bessell, M. S., Norris, J. 1976 ApJ, 208, 369
Binney, J., Gerhard, O., Silk, J. 2001, MNRAS, 321, 471
Blitz, L., Robishaw, T., 2000 ApJ, 541, 675
Brown, J. A., Wallerstein, G. 1993, AJ, 106, 133
Cohen, J. G., Bell, R. A. 1986 ApJ, 305, 698
Dinescu, D. I., Girard, T. M., van Altena, W. F. 1999, AJ, 117, 1792
Djorgovski, S. 1993, in ASP Conf. Ser. Vol. 50, Structure and Dynamics of Globular Clusters, ed. S. G. Djorgovski & G. Meylan, (San Francisco: ASP), 373
Gonzalez, G., Wallerstein, G. 1994, AJ, 108, 1325
Grebel, E. K., Richtler, T. 1992, A&A, 253, 359
Harris, W. E. 1996, AJ, 112, 1487
Hilker, M. 2000, A&A, 355, 994
Hilker, M., Richtler, T. 2000, A&A, 362, 895
Hughes, J. D., Wallerstein, G. 1999, AJ, 119,1225
Jurcsik, J. 1998, ApJ, 506, L113
Kraft, R. P. 1994, PASP, 106, 553
Lee, Y.-W., Joo, J.-M., Sohn, Y.-J., Rey, S.-C., Lee, H.-C., Walker, A.R. 1999, Nature, 402, 55
Meylan, G. 1987, A&A, 184, 144
Norris, J., Bessell, M. S. 1975, ApJ, 201, L75 (erratum in 210, 618)
Norris, J. E., Da Costa, G. S. 1995, ApJ, 447, 680
Norris, J. E., Freeman, K. C., Mayor, M., Seitzer, P. 1997, ApJ, 487, L187
Norris, J. E., Freeman, K. C., Mighell, K. J. 1996, ApJ, 462, 241
Pagel, B. E. J. 1997, in Nucleosynthesis and Chemical Evolution of Galaxies, Cambridge University Press
Pancino, E., Ferraro, F. R., Bellazzini, M., Piotto, G., Zoccali, M. 2000, ApJ, 534, L83
Pryor, C., Meylan, G. 1993, in ASP Conf. Ser. Vol. 50, Structure and Dynamics of Globular Clusters, ed. S. G. Djorgovski & G. Meylan, (San Francisco: ASP), 357
Reed, B. C., Hesser, J. E., Shawl, S. J. 1988, PASP, 100, 545
Richter, P., Hilker, M., Richtler, T. 1999, A&A, 350, 476
Richtler, T. 1989, A&A, 211, 199
Smith, V. V., Suntzeff, N. B., Cunia, K., Gallino, R., Busso, M., Lambert, D., 2000 AJ, 119, 1239
Suntzeff, N. B., Kraft, R. P. 1996, AJ, 111, 1913
Tsujimoto, T., Nomoto, K., Yoshii, Y., Hashimoto, M., Yanagida, S., Thielemann, F.-K. 1995, MNRAS, 277, 945
Vanture, A. D., Wallerstein, G., Brown, J. A., 1994, PASP 106, 835
Webbink R. F. 1985, in IAU Symp. 113, Dynamics of Star Clusters, ed. J. Goodman & P. Hut, (Dordrecht: Reidel), 541
Zinn, R. 1985, ApJ, 293, 424