Unusually Weak Diffuse Interstellar Bands toward HD 62542
Abstract
As part of an extensive survey of diffuse interstellar bands (DIBs), we have obtained optical spectra of the moderately reddened B5V star HD 62542, which is known to have an unusual UV extinction curve of the type usually identified with dark clouds. The typically strongest of the commonly catalogued DIBs covered by the spectra — those at 5780, 5797, 6270, 6284, and 6614Å — are essentially absent in this line of sight, in marked contrast with other lines of sight of similar reddening. We compare the HD 62542 line of sight with others exhibiting a range of extinction properties and molecular abundances and interpret the weakness of the DIBs as an extreme case of deficient DIB formation in a dense cloud whose more diffuse outer layers have been stripped away. We comment on the challenges these observations pose for identifying the carriers of the diffuse bands.
1 Introduction
Following the first reported detection of diffuse interstellar bands (DIBs) some 80 years ago (Heger 1922), several different approaches were made to the task of identifying the carriers (see Herbig 1995 or Snow 1995, 2001 for recent reviews). During the era of photographic spectroscopy, the principal approach was to examine correlations of the strengths of the DIBs with other interstellar quantities, but such studies rarely led to definitive conclusions (Snow, York, & Welty 1977). With the advent of electronic detectors in the 1970s, however, it became possible to measure the strengths and profiles of the DIBs more accurately. Differences in profile shape among the DIBs and differences in relative DIB strength in different interstellar environments strongly suggest that the DIBs are due to a variety of carriers (Krełowski & Walker 1987; Josafatsson & Snow 1987; Krełowski & Sneden 1993; Cami et al. 1997). Some uncertainties remain, however, as to which of the DIBs are more closely related, because of differences both in the sightlines and DIBs considered and in how the DIBs are defined and measured in the various studies.
The breadth of the DIBs has often been ascribed to broadening by predissocation, but this requires the DIB carriers to be continually replenished at a rapid rate to maintain the necessary density of absorbers. Douglas (1977) and Smith, Snow, & York (1977) proposed a solution for this dilemma: the DIB carriers could be large molecules undergoing internal conversion, a process routinely seen in laboratory spectra. Laboratory and theoretical studies of small and large (10 atomic nuclei) molecules are now producing specific predictions of DIB candidate lines (e.g., Foing & Ehrenfreund 1994 and Galazutdinov et al. 2000 for C60+; Tulej et al. 1998 for C; McCarthy et al. 1997, 2000 for carbon chains; Guthe et al. 2001 for l-C3H; Krełowski et al. 2001 for naphthalene cations). Ultra-high resolution spectra of several DIBs have revealed structure in the profiles suggestive of the rotational structure expected for large molecules (Sarre et al. 1995; Kerr et al. 1996; Ehrenfreund & Foing 1996; Krełowski & Schmidt 1997). Astrophysical studies, together with the laboratory studies, thus have shown that large molecules may well be present in interstellar clouds and must be considered as possible candidates for some of the DIBs (Salama & Allamandola 1992a,b; Snow et al. 1998; Sonnentrucker et al. 1997, 1999).
We are currently assembling an extensive dataset of DIB information of much higher quality than has previously been available (Thorburn et al., in prep.). For most of the 60 stars in this survey, our optical spectra cover the range from 3700 to 10,500Å, at a signal to noise ratio 1000 between 5780 and 7000Å. For some Southern stars (including the one discussed in this paper), the spectra have less complete spectral coverage and lower S/N, however. Our goal is to assemble a high-quality dataset — including DIB strengths and many other interstellar parameters — for a set of sightlines specifically selected to sample a wide variety of environments. Our hope is that with sufficient data quality (allowing us to measure very weak DIBs and fine details of the DIB profiles), careful consideration of the continua near the DIBs, and more complete coverage of the other interstellar parameters, we may be able to identify definite dependences and relationships among the DIBs, between the DIBs and other interstellar species, and between the DIBs and specific physical or chemical factors characterizing the interstellar clouds.
In this paper, we report results for one particular line of sight with very unusual dust extinction properties and explore, by comparison with other lines of sight, the possible interpretations of the DIBs in this case. In the next section, we summarize what is known about the star (HD 62542) and its line of sight. In Section 3, we describe the observations and our results, while in Section 4 we discuss possible implications for understanding the DIBs.
2 The Line of Sight toward HD 62542
The star HD 62542 lies behind material associated with the Gum Nebula (Cardelli & Savage 1988; Cardelli et al. 1990; Whittet et al. 1993; Churchwell et al. 1996). Whittet et al. estimated a spectroscopic distance of 405 pc, based on an adopted B3 V spectral type. The distance estimate from Hipparcos — 246 pc, with a one- uncertainty range from 212 to 294 pc — is more consistent with the slightly later B5 V type adopted by Cardelli & Savage, however.
Allowing for the uncertainties in spectral type, the color excess = 0.33–0.37, the total visual extinction AV = 1.07–1.20 mag, and the ratio of total to selective extinction RV = 2.90–3.24 (Cardelli & Savage 1988; Whittet et al. 1993; Rachford et al. 2002). The total hydrogen column density (H I) + 2(H2) is about 2.2 1021 cm-2 (Rachford et al. 2002).
This star has one of the most extreme ultraviolet extinction curves known, featuring a very broad, shortward-displaced 2175Å bump and an extremely steep far-UV rise — similar to that of another extreme case, HD 29647 (Snow & Seab 1980; Cardelli & Savage 1988). Those extinction curve properties are often interpreted as indicating a preponderance of small dust grains. Snow & Seab (1980), Mathis & Cardelli (1992), and Mathis (1994) have speculated that such extinction curves are produced by the addition of a thin mantle overlying the small carbonaceous grains thought to be responsible for the bump and the far-UV extinction. While a strong water ice feature has been observed toward the more heavily reddened HD 29647 (AV = 3.6 mag; Goebel 1983), water ice mantles may not significantly affect the 2175Å bump (Mathis 1994). Given the much smaller value of AV toward HD 62542, we think detection of water ice in this sightline is unlikely — but would still recommend looking for it.
High resolution spectra of Na I and K I suggest that most of the interstellar material in this line of sight is concentrated in a single cloud at = 14 km s-1; additional weaker components are seen in Na I and Ca II (D. Welty et al., in prep.). The column densities of CH, CN, and C2 in the main cloud are quite high for the amount of reddening; CH+ is not detected, however (Cardelli et al. 1990; Gredel, van Dishoeck, & Black 1993). Various diagnotics, interpreted via theoretical models, have suggested total hydrogen (H + H2) densities ranging from several hundred per cm3 (Black & van Dishoeck 1991) to 10,000 cm-3 (Cardelli et al.) in the main cloud. The C2 rotational level populations and the relative weakness of the mm-wave CN emission, however, suggest 50 K and in the range 500–1000 cm-3 (Gredel et al. 1991, 1993) — also rather high for a cloud with such moderate extinction. Spectra obtained with FUSE indicate a molecular hydrogen column density of 5.9 1020cm-2, with a corresponding hydrogen molecular fraction (H2) = 2(H2)/[(H I) + 2(H2)] = 0.60, averaged over the line of sight (Rachford et al. 2002). The molecular fraction is somewhat uncertain, however, owing to uncertainties in (H I). If the density of the cloud is of order 500–1000 cm-3, then the extent of the cloud along the line of sight is only about 0.5–1.0 pc. This cloud thus may be viewed as a small, dense knot within the filamentary structure associated with the Gum nebula. Cardelli & Savage (1988) and Cardelli et al. (1990) proposed that the more diffuse outer layers of the cloud may have been stripped by the passage of stellar winds and/or shocks within the Gum nebula.
3 Observations and Results
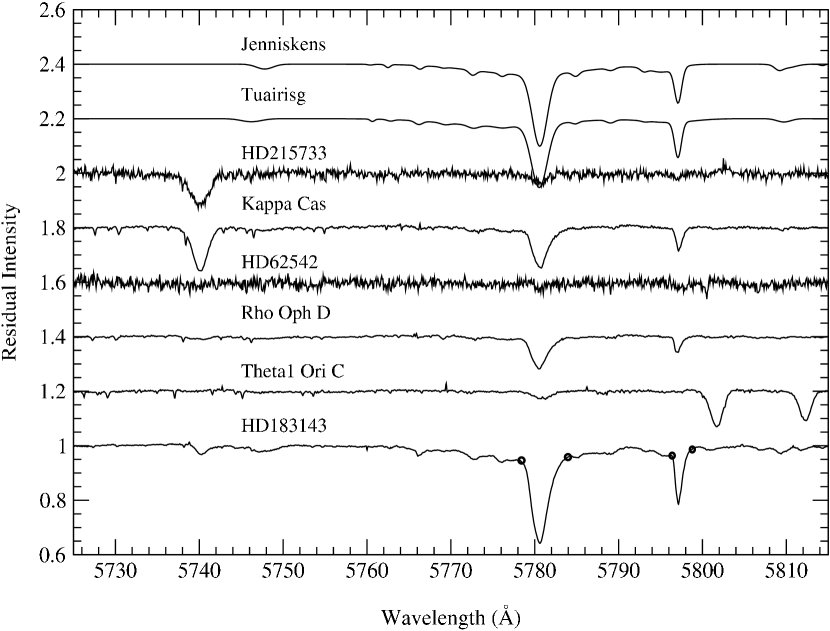
Table 1 lists the stars compared in this paper, with spectral type, V magnitude, color excess, and a general characterization of the UV extinction curve. Kappa Cas was chosen because it has nearly the same and AV as HD 62542. It was the obvious difference between the DIBs toward Cas and those toward HD 62542 that led us to write this paper — the bands discussed in this paper are weaker in HD 62542 by factors of at least 4–8, despite the very similar and AV. Rho Oph D and Ori C were chosen for comparison because they belong to the class of stars with shallow far-UV extinction curves (Fitzpatrick & Massa 1990) noted for having weak DIBs. HD 183143 is included because it has frequently been cited in the literature as a standard for strong DIBs, for example in the compilations of Herbig (1975), Jenniskens & Désert (1994), and Tuairisg et al. (2000); HD 215733 is included as a lightly reddened star observed with the same instrument as HD 62542.
The spectra of HD 62542 and HD 215733 were obtained using the University College London Echelle Spectrograph (UCLES; Walker & Diego 1985) on the Anglo-Australian Telescope in 1998 September. Sections of 23 orders, giving incomplete coverage of the spectrum between 5075 and 10,295Å, were recorded on the MIT/LL2 CCD (20484096; 15m pixels). While the primary motivation for these observations was to obtain spectra of the interstellar Na I D and K I 7698 lines, a number of DIBs also lie within the spectral coverage. The spectra were extracted from the raw CCD images using standard procedures within IRAF. The spectral resolution is 5 km s-1; for both stars, the S/N is of order 70 between about 5700 and 8800Å.
The spectra of Cas, Ori C, Oph D, and HD 183143 were obtained at Apache Point Observatory (APO) with the Astrophysical Research Consortium (ARC) echelle spectrograph (ARCES). The ARCES spectra are recorded at a resolution of 8 km s-1, using a 1.6 arcsecond slit. The CCD is a 20482048 Site/Tektronix device with 24m pixels. Multiple spectra, with exposure times 30 min, were obtained to achieve S/N 1000 at 5780Å. For reddened stars, the S/N is greater than 100 throughout the entire range between 3600 and 10,000Å. The spectra were extracted using IRAF, with special settings to accommodate the narrow (FWHM 3.3 pixels), closely spaced (10 pixels, center to center) spectral orders and the aliasing caused by the fact that not all orders can be simultaneously lined up along the rows of CCD pixels. All of the spectral orders passed by the system fit on the CCD. Identical spectral regions from adjacent orders were weighted and co-added, after standard wavelength calibrations and one-dimensional flat field corrections were applied, to produce a blazeless spectrum covering the range 3600–10,000 Å. Details of the spectrograph and the routine observing procedures are discussed by York, Hildebrand, Hobbs et al. (in prep.).
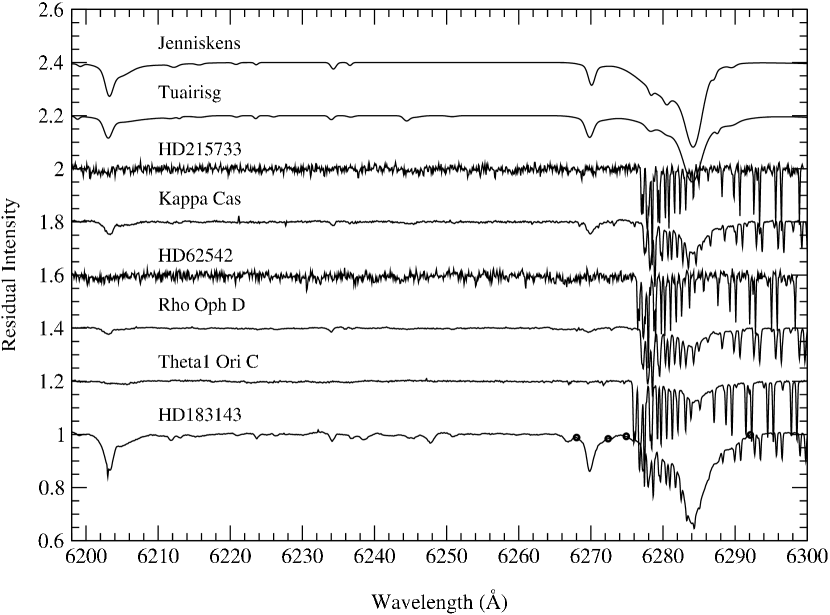
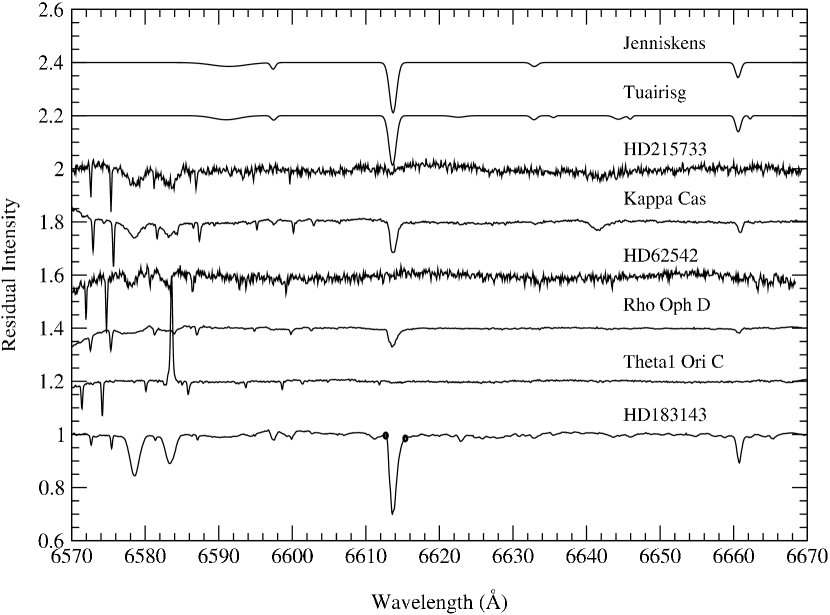
Figures 1, 2, and 3 show regions from 5725–5815Å, 6200–6300Å, and 6570–6670Å. These wavelength regions are the only ones included in the UCLES spectra that contain strong, well-studied DIBs. The top two spectra in each figure are noiseless atlas spectra (model representations of a flat continuum and Gaussian components designed to yield features comparable in strength to those seen toward HD 183143) from Jenniskens & Désert (1994; hereafter JD94) and Tuairisg et al. (2000; hereafter T00). The atlases represent averages over several stars, with lines scaled in strength by the ratio of in HD 183143 to that for each of the other stars. The stellar spectra have been binned to a resolution of 8 km s-1, shifted so that the interstellar K I lines are at 0 km s-1, and plotted in order of increasing AV (top to bottom). The dots on either side of the DIBs in the spectra of HD 183143 denote the end points of the linear continua used for measuring equivalent widths. The sharp features that occur in all stellar spectra at nearly the same wavelengths are telluric lines. While there are many weak DIBs seen in common between JD94, T00, and our spectrum of HD 183143, there are also features that do not match up. Some of these features are stellar lines (e.g., at 6579 and 6582Å) which, of course, do not appear in the atlases; others are weak DIBs that are not well represented in the two atlases. In addition, since the relative strengths of the DIBs can vary from star to star (Herbig 1995, and references therein), the averaged atlas spectra do not necessarily match the actual spectrum of HD 183143 itself. A more complete list of DIBs, which resolves discrepancies between previous atlases and our new spectra, is in preparation (York et al., in prep.).
The DIB at 6284Å deserves special mention, since it is partially blended with a telluric band of O2, and has long been recognized as a difficult DIB to measure cleanly. In our data, however, the spectral resolving power is sufficient to clearly separate the narrow O2 band features from the much broader DIB, and there was thus no difficulty in excising the telluric absorption in order to measure the equivalent width of the diffuse band.
The equivalent widths of five relatively strong, well-known DIBs for all six lines of sight are listed in Table 2, together with the ratio of total to selective extinction (RV), the total visual extinction (AV), and the column densities of H I, H2, K I, and various molecular species. Several footnotes to the table list measurements of the strengths of those DIBs from selected recent references, for comparison; a more thorough comparison of our new DIB measurements with previous values will be given by York et al. (in prep.).
4 Discussion
It is apparent from Table 2 and from Figures 1– 3 that the strengths of the 5780, 5797, 6270, 6284, and 6614Å DIBs do not increase monotonically with AV — at least for this small (and likely biased) sample of six lines of sight. As noted earlier, HD 2905 ( Cas) and HD 62542 have essentially identical AV, but the equivalent widths of all five DIBs are weaker toward HD 62542 by factors of at least 4–8. None of those bands is detected toward HD 62542, given the S/N in our data, and we can list only upper limits in Table 2.111 Several other, weaker DIBs identified in the literature (e.g., those at 6203 and 6660Å) also are absent toward HD 62542, with upper limits similar to those for the other narrow DIBs. The nearly 70% increase in AV between HD 62542 and Oph D is accompanied by increases in the strengths of all five DIBs by factors of at least 2–6. The bands toward Oph D are about half as strong as those toward Cas, even though AV is higher toward Oph D by a factor of almost 1.7. The DIBs toward Ori C are even weaker (except 6284), even though AV is slightly higher than toward Oph D. On the other hand, AV is greater by a factor of almost 3.9 toward HD 183143 than toward Cas, and the five DIBs are stronger by factors of 2.5–3.4 — more consistent with a nearly linear relationship.
Krełowski et al. (1999) have compared the equivalent widths of the DIBs at 5780 and 5797Å with those of the strongest lines from the diatomic molecules CH (4300Å) and CH+ (4232Å). In Figure 4, we plot the strengths (log Wλ) of these two DIBs versus the column density of CH. The DIB strengths are primarily from our survey, but with some values from Josafatsson & Snow (1987), Herbig (1993), and Krełowski et al. (1999); the values for (CH) are from various references (see the appendix to Welty & Hobbs 2001), from fits to new high-resolution spectra of translucent sightlines (Welty et al., in prep), and from our survey. There is at best a weak correlation between the strength of the 5780Å DIB and (CH); the relationship between the strength of the 5797Å DIB and (CH) is somewhat tighter, with steeper slope. Toward HD 62542, however, both DIBs are clearly much weaker than for other sightlines with comparable (CH). The DIBs toward HD 62542 are also anomalously weak when compared with the column densities of C2 and CN, but such comparisons cannot be made with (CH+), as only an upper limit is available.
In view of the similarities in UV extinction toward HD 62542 and HD 29647, comparisons of other interstellar properties for these two lines of sight are of interest. It is difficult to assess the atomic and molecular abundances toward HD 29647, due to its later spectral type (B8 V), its confusing spectrum (Hg-Mn), the near-perfect velocity match between the star and the main interstellar cloud in the line of sight (Adelman et al.2001), and the star’s very low sin, which makes stellar lines appear nearly as narrow as interstellar lines in most currently available spectra (e.g. Crutcher 1985). There is insufficient far-UV flux for FUSE observations, and it can be difficult to interpret, or even to identify unambiguously, some of the interstellar lines. Owing to the breadth of the DIBs, however, it is possible to determine the DIB strengths toward this star. It was previously established that the 5780 and 5797Å DIBs toward HD 29647 are unusually weak, but might be present with very narrow profiles (Snow & Seab 1991). More comprehensive data to be presented by Snow et al. (in prep.) cover all the DIBs in Figs. 1–3 here, and yield the following results: the 5780 and 5797Å DIBs are present, with 5780 strongly dominant over 5797; the 6284Å band is weakly present, with normal width; and the 6614Å band is present but very weak. The DIBs toward both stars thus are markedly weak relative to extinction, when compared to the DIBs in most diffuse cloud lines of sight reported in the literature (note that AV = 3.6 mag for HD 29647).
There is longstanding evidence in the literature that the generically strongest DIBs tend to be relatively weak in dense clouds (e.g., Wampler 1966; Snow & Cohen 1974; Adamson, Whittet, & Duley 1991; Adamson et al. 1991; Snow 1995). The current results for HD 62542 (and for HD 29647) appear to support this trend, in the extreme. The DIBs are also known to be weak, relative to extinction, in environments with intense radiation fields (Jenniskens, Ehrenfreund, & Foing 1994; Snow et al. 1995). This combination of factors — DIB weakness in dense clouds and in regions of high UV flux — leads to a picture in which the DIBs form and survive most readily either in “ordinary” diffuse clouds or in the diffuse outer layers of dense clouds (the “skin effect” discussed by Adamson et al. 1991). The weakness of the DIBs toward HD 62542 and the suggestion of Cardelli et al. (1990) that the more diffuse outer layers of the dense cloud toward HD 62542 have been stripped off are consistent with this scenario.
Of the sightlines considered in this paper, the three with “normal” DIB strengths per unit (HD 215733, Cas, HD 183143) all have a number of interstellar components — of roughly comparable strength and spread out in velocity — in C I, Na I, and/or K I (Fitzpatrick & Spitzer 1997; Welty & Hobbs 2001; McCall et al. 2002). Toward Cas and HD 183143, (CN)/(CH) 0.05 and (CH+)/(CH) 1.0 (Table 2) — both suggestive of relatively low densities in an ensemble of “normal” diffuse clouds. The sightlines with weak DIBs (HD 62542, Oph D, Ori C), however, are characterized by somewhat different structures and/or atomic and molecular abundances. While there are a number of Na I components toward Ori C, the overall (Na I) is quite low, relative to (H) (Welty & Hobbs 2001), and CH, CN, and CH+ have not been detected — all suggesting that those components correspond to diffuse clouds bathed in a strong ambient radiation field. The available high resolution Na I and K I spectra of HD 62542 and Oph D indicate, however, that those lines of sight are each dominated by a single strong component [or perhaps several narrow, closely blended components for Oph D, as seen in higher resolution spectra of Oph A (Welty & Hobbs 2001)]. The molecular column densities toward HD 62542 imply the presence of much denser gas: (CN)/(CH) 1.0 and (CH+)/(CH) 0.02; Oph D represents an intermediate case, with (CN)/(CH) 0.1 and (CH+)/(CH) 0.3.
The carriers of the DIBs considered here thus seem to require a relatively low density and/or (at most) a moderately intense radiation field (Cami et al., 1997; Sonnentrucker et al. 1997). Correlations between the strengths of the 5780 and 5797Å DIBs, (H), (Na I), and (K I) suggest that the DIB carriers generally behave like dominant ions — though the weakness of those DIBs toward stars in Sco-Oph and in the Orion Trapezium region is reminiscent of the weakness of the trace neutral species there (Herbig 1993; Welty & Hobbs 2001). There also are indications that the carrier of the 5797Å DIB may be more readily destroyed (ionized?) than that of the 5780Å DIB where the radiation field is stronger (Sonnentrucker et al. 1997; Krełowski, Galazutdinov, & Musaev 1998; Welty & Hobbs 2001). Such patterns are consistent with suggestions that the DIB carriers are molecular ions — which are destroyed (through electron attachment) in dense environments (e.g., toward HD 62542) or which are not formed or maintained in clouds with weak radiation fields (e.g., Leger & d’Hendecourt 1985; Crawford, Tielens, & Allamandola 1985; van der Zwet & Allamandola 1985; Salama et al. 1996, 1999; see LePage, Snow, & Bierbaum 2001 for a recent overview and model). No specific molecule or family of molecules can be firmly identified at the present time, however. The DIB behavior argues strongly against molecular anions as the DIB carriers — at least for the stronger, more well-studied DIBs — consistent with the recent rejection of the C hypothesis (McCall et al. 2001; Galazutdinov et al. 2001; Sarre & Kendall 2000).
While we are tempted to associate the weakness of the DIBs toward HD 62542 with the low UV field intensity and high molecular content of the main cloud at 14 km s-1, we note that the hydrogen molecular fraction is not extremely high. The value (H2) = 0.60 (if verified once a more accurate H I column density can be obtained) is comparable to, but not greater than, the values found for other diffuse or translucent clouds such as the main clouds toward Oph. We hypothesize instead that the part of the main cloud toward HD 62542 that is conducive to the formation and survival of DIBs is unusually thin, sandwiched between the dense cloud that dominates the molecular absorption and the hot, low-density gas of the Gum nebula in which that cloud is immersed. In this view, the more extended diffuse neutral region where the DIB carriers would normally reside is essentially absent in this line of sight. The main cloud toward HD 29647, with somewhat stronger DIBs than those toward HD 62542, appears to be in a more quiescent region (Cardelli & Savage 1988), and thus may have a more normal outer structure.
5 Summary/Conclusions
A number of the diffuse interstellar bands (at 5780, 5797, 6270, 6284, and 6614 Å) commonly seen even in relatively lightly reddened lines of sight appear to be essentially absent toward the moderately reddened star HD 62542, previously known to exhibit both strong interstellar molecular lines and an unusually steep far-UV extinction curve with a weak, shifted 2175Å bump. The line of sight appears to be dominated by a single small, very dense cloud, whose more diffuse outer layers may have been stripped by stellar winds and/or shocks within the Gum nebula.
Comparisons of those five moderately strong DIBs in six lines of sight indicate that the strengths of the DIBs are not well correlated with AV, but must depend on other (as yet undetermined) properties of the interstellar clouds. For this small sample, the bands are weaker, per unit AV, for sightlines with strong CN and weak CH+, relative to CH (HD 29647, HD 62542), and are stronger for sightlines with weak CN and strong CH+ ( Cas, HD 183143) — consistent with reduced abundances of the carriers of these DIBs in denser gas. [We note that our larger sample suggests that different DIBs can show somewhat different dependences on (CH+)/(CN), however.] Moreover, the DIBs are weaker when the far-UV extinction is either very steep, and the radiation fields not enhanced (HD 62542, HD 29647) or very shallow, with a strong ambient field ( Ori C); the other sightline with relatively weak DIBs ( Oph D) has moderately shallow far-UV extinction and (probably) a somewhat enhanced radiation field. Thus, too little or too much UV flux removes the DIB absorbers from the gas — accounting qualitatively for the very large variations in DIB strengths with AV seen in Table 2. The results presented in this paper thus extend the similar conclusions of Cami et al. (1997) to higher densities and molecular abundances. The absence of DIBs toward HD 62542, combined with similar behavior seen in other sightlines with similar interstellar conditions, suggests that molecular ions, or other species having a similar response to ambient density and radiation, are the most likely carriers of the DIBs.
We are assembling a data base for 60 lines of sight — with data on H2, CH, CH+, CN, C2, AV, (H2), T01(H2), T35(H2); detailed component structures from high-resolution spectra of K I, Na I, CH, CH+, and CN (Welty & Hobbs 2001; D. Welty et al., in prep.); abundances of H and CO (McCall et al. 2002); strengths of interstellar IR emission and absorption bands; and element abundances/depletions measured with HST and FUSE (Sonnentrucker et al., in prep.) — in order to search for correlations between the DIB strengths and other interstellar properties.
References
- (1)
- (2) Adamson, A. J., Whittet, D. C. B., & Duley, W. W. 1991, MNRAS, 252, 234
- (3) Adelman, S. J., Snow, T. P., Wood, E. L., Evans, I. I., Sneden, C., Ehrenfreund, P., & Foing, B. H. 2001, MNRAS, 328, 1144
- (4) Albert, C. E. 1983, ApJ, 272, 509
- (5) Bohlin, R. C., Savage, B. D., & Drake, J. F. 1978, ApJ, 224, 132
- (6) Cami, J., Sonnentrucker, P., Ehrenfreund, P., & Foing, B. H. 1997, A&A, 326, 822
- (7) Cardelli, J. A., Clayton, G. C., & Mathis, J. S. 1989, ApJ, 345, 245
- (8) Cardelli, J. A., & Savage, B. D. 1988, ApJ, 325, 864
- (9) Cardelli, J. A., Suntzeff, N. B., Edgar, R. J., & Savage, B. D. 1990, ApJ, 362, 551
- (10) Churchwell, E., Winnberg, A., Cardelli, J. A., Cooper, G., & Suntzeff, N. B. 1996, ApJ, 469, 209
- (11) Crawford, M. K., Tielens, A. G. G. M., & Allamandola, L. J. 1985, ApJ, 293, 45
- (12) Crutcher, R. M. 1985, ApJ, 288, 604
- (13) Diplas, A., & Savage, B. D. 1994, ApJS, 93, 211
- (14) Douglas, A. E. 1977, Nature, 269, 130
- (15) Ehrenfreund, P., & Foing, B. H. 1996, A&A, 307, L25
- (16) Fitzpatrick, E. L., & Massa, D. 1990, ApJS, 72, 163
- (17) Fitzpatrick, E. L., & Spitzer, L. 1997, ApJ, 475, 623
- (18) Foing, B. H., & Ehrenfreund, P. 1994, Nature, 369, 296
- (19) Galazutdinov, G. A., Krełowski, J., Musaev, F. A., Ehrenfreund, P., & Foing, B. H. 2000, MNRAS, 317, 750
- (20) Galazutdinov, G., Musaev, F., Nirski, J, & Krełowski, J. 2001, A&A, 377, 1063
- (21) Goebel, J. H. 1983, ApJ, 268, L41
- (22) Gredel, R. 1999, A&A, 351, 657
- (23) Gredel, R., van Dishoeck, E. F., & Black, J. H. 1991, A&A, 251, 625
- (24) Gredel, R., van Dishoeck, E. F., & Black, J. H. 1993, A&A, 269, 477
- (25) Guthe, F., Tulej, M., Pachkov, V., & Maier, J. P. 2001, ApJ, 555, 466
- (26) Heger, M. L. 1922, Lick Obs. Bull., 10, No. 337, 146
- (27) Herbig, G. H. 1993, ApJ, 407, 142
- (28) Herbig, G. H. 1995, ARA&A, 33, 19
- (29) Herbig, G. H. 2001, ApJ, 542, 334
- (30) Hoffleit, D. 1982, The Bright Star Catalogue (New Haven: Yale Univ. Obs.)
- (31) Hoffleit, D., Saladyga, M., & Wlasuk, P. 1983, A Supplement to the Bright Star Catalogue (New Haven: Yale Univ. Obs.)
- (32) Jenniskens, P., & Désert, F.-X. 1994, A&AS, 106, 39 (JD94)
- (33) Jenniskens, P., Ehrenfreund, P., & Foing, B. H. 1994, A&A, 281, 517
- (34) Jenniskens, P., & Greenberg, J. M. 1993, A&A, 274, 439
- (35) Johnson, H. L. 1963, in Stars and Stellar Systems, Vol. 3, Basic Astronomical Data, ed. K. Aa. Strand (Chicago: Univ. Chicago Press), 214
- (36) Josafatsson, K., & Snow, T. P. 1987, ApJ, 319, 436
- (37) Kerr, T. H., Hibbins, R. E., Miles, J. R., Fossey, S. J., Somerville, W. B., & Sarre, P. J. 1996, MNRAS, 283, L105
- (38) Krełowski, J., Ehrenfreund, P., Foing, B. H., Snow, T. P., Weselak, T., Tuairisg, S. O., Galazutdinov, G. A., & Musaev, F. A. 1999, A&A, 347, 235
- (39) Krełowski, J., Galazutdinov, G. A., & Musaev, F. A. 1998, ApJ, 493, 217
- (40) Krełowski, J., Galazutdinov, G. A., Musaev, F. A., & Nirski, J. 2001, MNRAS, 328, 810
- (41) Krełowski, J., & Schmidt, M. 1997, ApJ, 477, 209
- (42) Krełowski, J., & Sneden, C. 1993, PASP, 105, 1141
- (43) Krełowski, J., & Walker, G. A. H. 1987, ApJ, 312, 860
- (44) Leger, A., & d’Hendecourt, L. 1985, A&A, 146, 81
- (45) Le Page, V., Snow, T. P., & Bierbaum, V. M. 2001, ApJS, 132, 233
- (46) Mathis, J. S. 1994, ApJ, 422, 176
- (47) Mathis, J. S., & Cardelli, J. A. 1992, ApJ, 398, 610
- (48) McCall, B. J., Hinkle, K. H., Geballe, T. R., Moriarty-Schieven, G. H., Evans, N. J., Kawaguchi, K., Takano, S., Smith, V. V., & Oka, T. 2002, ApJ, in press (astro-ph/0110674)
- (49) McCall, B. J., Thorburn, J., Hobbs, L. M., Oka, T., & York, D. G. 2001, ApJ, 559, L49
- (50) McCarthy, M. C., Travers, M. J., Kovacs, A., Gottlieb, C. A., & Thaddeus, P. 1997, ApJS, 113, 105
- (51) McCarthy, M. C., Chen, W., Travers, M. J., & Thaddeus, P. 2000, ApJS, 129, 611
- (52) Price, R. J., Crawford, I. A., Barlow, M. J., & Howarth, I. D. 2001, MNRAS, 328, 555
- (53) Rachford, B. L. et al. 2002, ApJ, submitted
- (54) Salama, F., & Allamandola, L. J. 1992a, Nature, 358, 42
- (55) Salama, F., & Allamandola, L. J. 1992b, ApJ, 395, 401
- (56) Salama, F., Bakes, E. L. O., Allamandola, L. J., & Tielens, A. G. G. M. 1996, ApJ, 458, 621
- (57) Salama, F., Galazutdinov, G. A., Krełowski, J., Allamandola, L. J., & Musaev, F. A. 1999, ApJ, 526, 265
- (58) Sarre, P. J. & Kendall, T. R. 2000, in Astrochemistry: From Molecular Clouds to Planetary Systems, eds. Y. C. Minh & E. F. van Dishoeck (Dordrecht; Kluwer), p. 343
- (59) Sarre, P. J., Miles, J. R., Kerr, T. H., Hibbins, R. E., Fossey, S. J., & Somerville, W. B. 1995, MNRAS, 277, L41
- (60) Savage, B. D., Bohlin, R. C., Drake, J. F., & Budich, W. 1977, ApJ, 216, 291
- (61) Smith, W. H., Snow, T. P., & York, D. G. 1977, ApJ, 218, 124
- (62) Snow, T. P. 1995, in The Diffuse Interstellar Bands, eds. A. G. G. M. Tielens & T. P. Snow (Dordrecht: Kluwer), 325
- (63) Snow, T. P. 2001, Spectrochimica Acta (Part A), 57, 615
- (64) Snow, T. P., Bakes, E. L. O., Buss, R. H., & Seab, C. G. 1995, A&A, 296, L37
- (65) Snow, T. P., & Cohen 1974, ApJ, 194, 313
- (66) Snow, T. P., Le Page, V., Keheyan, Y., & Bierbaum, V. M. 1998, Nature, 391, 259
- (67) Snow, T. P., & Seab, C. G. 1980, ApJ, 242, L83
- (68) Snow, T. P., & Seab, C. G. 1991, ApJ, 382, 189
- (69) Snow, T. P., York, D. G., & Welty, D. E. 1977, AJ, 82, 113
- (70) Sonnentrucker, P., Cami, J., Ehrenfreund, P., & Foing, B. H. 1997, A&A, 327, 1215
- (71) Sonnentrucker, P., Foing, B. H., Breitfellner, M., & Ehrenfreund, P. 1999, A&A, 346, 936 1974, ApJS, 28, 373
- (72) Tuairisg, S. Ó., Cami, J., Foing, B. H., Sonnentrucker, P., & Ehrenfreund, P. 2000, A&AS, 142, 225 (T00)
- (73) Tulej, M., Kirkwood, D. A., Pachkov, M., & Maier, J. P. 1998, ApJ, 506, L69
- (74) van der Zwet, G. P., & Allamandola, L. J. 1985, A&A, 146, 76
- (75) Walker, D. D., & Diego, F. 1985, MNRAS, 217, 355
- (76) Wampler, E. J. 1966, ApJ, 144, 921
- (77) Welty, D. E., & Hobbs, L. M. 2001, ApJS, 133, 345
- (78) Whittet, D. C. B., Martin, P. G., Fitzpatrick, E. L., & Massa, D. 1993, ApJ, 408, 573
- (79)


| HD | Name | TypeaaHoffleit 1982; Hoffleit et al. 1983; Cardelli & Savage 1988; Albert 1983. | aaHoffleit 1982; Hoffleit et al. 1983; Cardelli & Savage 1988; Albert 1983. | bbUsing the intrinsic colors of Johnson 1963. | UV extinctionccCardelli & Savage 1988; Fitzpatrick & Massa 1990; Jenniskens & Greenberg 1993. |
|---|---|---|---|---|---|
| 2905 | Cas | B1 Iae | 4.16 | 0.33 | average |
| 37022 | Ori C | O6 | 5.13 | 0.34 | very shallow far-UV |
| 62542 | B5 V | 8.04 | 0.35 | very steep far-UV | |
| 147888 | Oph D | B5 V | 6.74 | 0.47 | shallow far-UV |
| 183143 | B7 Ia | 6.86 | 1.27 | slightly shallow far-UV | |
| 215733 | B1 II | 7.32 | 0.10 |
| Cas | Oph D | Ori C | ||||
|---|---|---|---|---|---|---|
| Quantity | HD 215733 | HD 2905bbKrełowski et al. 1999 list W(5780) = 280 mÅ, W(5797) = 70 mÅ (averages of four values each). | HD 62542 | HD 147888 | HD 37022ccHerbig 1993 lists W(5780) = 64 mÅ, W(5797) = 3 mÅ; Jenniskens et al. 1994 list W(6270) = 14 mÅ, W(6284)= 480 mÅ. | HD 183143ddHerbig 1995 lists W(5780) = 801 mÅ, W(5797) = 238 mÅ, W(6270) = 222 mÅ, W(6284) = 1945 mÅ, W(6614) = 358 mÅ. Tuairisg et al. 2000 list W(5780) = 770 mÅ, W(5797) = 187 mÅ, W(6284) = 2003 mÅ (sum over several DIBs included in our limits), W(6614) = 320 mÅ. |
| AV | 0.31 | 1.02 | 1.02 | 1.71 | 1.87 | 3.94 |
| RV | (3.1) | (3.1) | 2.90 | 3.63 | 5.50 | (3.1) |
| log(H I) (cm-2) | 20.70 | 21.20 | 20.93 | 21.54 | ||
| log(H2) (cm-2) | 20.27 | 20.81 | 17.55 | |||
| log(Htot) (cm-2) | 21.29 | 21.33 | 21.54 | |||
| log(H2) | 0.72 | 0.22 | 3.69 | |||
| W(5780) (mÅ) | 7615 | 30410 | 40 | 2545 | 628 | 75110 |
| W(5797) (mÅ) | 196 | 744 | 18 | 553 | 12 | 1824 |
| W(6270) (mÅ) | 12 | 555 | 12 | 204 | 10 | 1885 |
| W(6284) (mÅ) | 120 | 61245 | 120 | 41540 | 46060 | 185460 |
| W(6614) (mÅ) | 15 | 1233 | 15 | 824 | 103 | 3346 |
| log(CH) (cm-2) | 12.93 | 13.58 | 13.30 | 11.86 | 13.70 | |
| log(CN) (cm-2) | 11.29 | 13.62 | 12.30 | 12.52 | 12.34 | |
| log(C2) (cm-2) | 13.90 | 13.34 | 12.85 | |||
| log(CH+) (cm-2) | 13.21 | 11.82 | 12.81 | 12.00 | 13.67 | |
| log(K I) (cm-2) | 11.08 | 11.71 | 11.90 | 11.98 | 10.48 | 12.21 |