Timing with the EPIC pn Camera of XMM-Newton
Abstract
The EPIC pn CCD camera on board of XMM-Newton is designed to perform high throughput imaging and spectroscopy as well as high resolution timing observations in the energy range of 0.1–15 keV. A temporal resolution of milliseconds or -seconds, depending on the instrument mode and detector, is outstanding for CCD based X-ray cameras. In order to calibrate the different observing modes of the EPIC pn CCD, XMM-Newton observations of the pulsars PSR B1509-58, PSR B0540-69 and the Crab were performed during the calibration and performance verification phase. To determine the accuracy of the on board clock against Coordinated Universal Time (UTC), PSR B1509-58 was observed simultaneously with XMM-Newton and RXTE in addition. The paper summarizes the current status of the clock calibration.
keywords:
Missions: XMM-Newton – EPIC, pn-CCD, timing1 Introduction
The EPIC instruments on board of XMM-Newton, successfully launched on 1999 December 10, are designed for imaging, high throughput spectroscopy, and timing analysis. The EPIC pn camera offers six different observation (readout) modes, four imaging modes, and two fast readout modes. The imaging modes are dedicated to high throughput imaging and spectroscopy, while the fast readout modes are designed for high temporal resolution down to 7.2 s in combination with high spectral resolution. For a detailed description of the EPIC pn readout modes, their implementation, and characteristics see e.g. [*]mkuster-WA2:kendziorra97a, [*]mkuster-WA2:kendziorra99a, [*]mkuster-WA2:kuster99a, or [*]mkuster-WA2:ehle01a.
This paper is structured as follows: In section 2 we give a brief description of the fast readout modes available for the EPIC pn camera and their technical implementation as far as these are of importance for the observer. In section 4 and 5 we present preliminary results of the relative time calibration based on observations of young millisecond pulsars. In section 6 we describe limiting constraints an observer has to take into account when using the EPIC pn camera for observations with high temporal resolution.
2 Fast readout modes
| Obs. Mode | Frame | Life | Time |
|---|---|---|---|
| Time [ms] | Time [ms] | resolution | |
| Small Win. | 5.672 | 4.028 | 5.67 ms |
| Timing | 5.965 | 5.912 | 29.56 s |
| Burst | 4.345 | 0.126 | 7.2 s |
In addition to the imaging modes the design of the EPIC pn camera offers two observational modes designated to temporal analysis of X-ray sources with high time resolution, called Timing and Burst Mode. While Burst Mode is designed for very bright sources up to 6.3 Crab only, Timing Mode is usable for faint sources as well. In both modes spacial information in y-direction is lost due to the continuous readout of the CCD. In contrast to Timing Mode which uses the full size of the CCD, the last 20 lines of the CCD are discarded in Burst Mode. To improve time resolution to the maximum possible, the position of the source on the CCD has to be taken into account. This is done within the XMM Science Analysis System (SAS) for the nominal source position by default. For pointings deviating from the nominal position, the observer has to specify the source position on the CCD during the extraction process.
Beside high temporal resolution, both modes offer the full spectral resolution of the EPIC pn camera. For a report on the status of energy calibration see [*]mkuster-WA2:briel02a or [*]mkuster-WA2:kirsch02a in this volume.
3 Timing accuracy
All XMM-Newton data is tagged with a time stamp (on board time OBT) from a 1 Hz on board clock provided by a temperature compensated oscillator of the XMM-Newton Command and Data Management Unit (CDMU) (see [\astronciteAranci et al.1998]). The EPIC pn event analyzer EPEA further uses this clock pulse as an input for its internal clock which has an accuracy of 16 . All events handled by the EPEA are tagged with this accuracy. A verification of the internal timing of the EPEA was done during ground calibration at the PANTER facility before launch ([\astronciteKendziorra et al.1997]).
On board time (OBT) is further converted to Coordinated Universal Time (UTC) on ground while extracting data using information stored in a time correlation file, delivered with each Observation Data File (ODF). This file contains OBT versus UTC information. To transform event times, OBT is correlated versus UTC using a polynomial fit. The user can influence the accuracy of the fitting routine; for details see [*]mkuster-WA2:lammers01a.
During the extraction process with the SAS, the event times are corrected according to the readout mode used during observation. In imaging modes the photon arrival times are transformed to the center of integration interval, for the best time resolution possible. In the fast readout modes the time resolution can be improved by taking the position of the source and the line in which the photon was detected into account. By default line 190 is used as source position, which is equal to the nominal pointing position.
The last correction that has to be applied is a transformation to the solar system barycentre. This is done via the SAS tool “barycen” which transforms the given event times stored in the event file to Barycentric Dynamical Time (TDB).
4 Observations and data analysis
During commissioning and performance verification phase of XMM-Newton observations of young millisecond pulsars with the purpose of relative and absolute clock calibration were made. In addition we scheduled a simultaneous observation of PSR B1509-58 with RXTE with purpose of absolute time calibration. A summary of all observational data used for the analysis presented in this paper is given in Tab. 2. For all Crab observations in Timing Mode the electronic chopper was set to 25 to reduce telemetry rate. All other observations were performed with electronic chopper set to 0.
| Object | Rev. | Mode | Chopper | Obs. Time |
|---|---|---|---|---|
| [ksec] | ||||
| Crab | 0056 | Timing | 25 | 7.0 |
| 0234 | Burst | 0 | 10.0 | |
| B1509-58 | 0137 | Timing | 0 | 9.6 |
| 0137 | Small Win. | 0 | 11.4 | |
| B0540-69 | 0085 | Timing | 0 | 7.0 |
| 0085 | Small Win. | 0 | 7.0 |
Using the standard SAS procedure (SAS version 5.1.0) we extracted event files and light curves for all observations, objects and detector modes in the energy band 3.0–12.0 keV. To reduce low energy background to a minimum we ignored flux below 3 keV. This is of importance especially for observations during early commissioning phase, e.g. the Crab observation in Rev. 56, when the detector setup was not yet optimized. For observations in fast modes we used line 190 as position of the source in RAWY direction for time correction. In addition we selected 4–5 columns around maximum intensity in RAWX direction as extraction region, to reduce non pulsed flux from nebula emission or background. Further we transformed photon arrival times to TDB, using the SAS tool “barycen” and object coordinates given in Tab. 3.
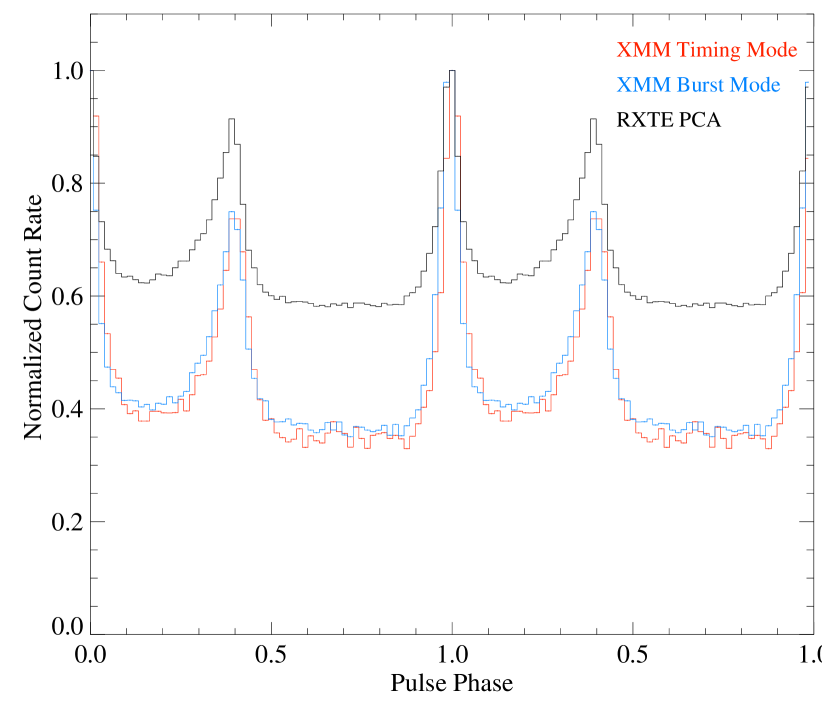
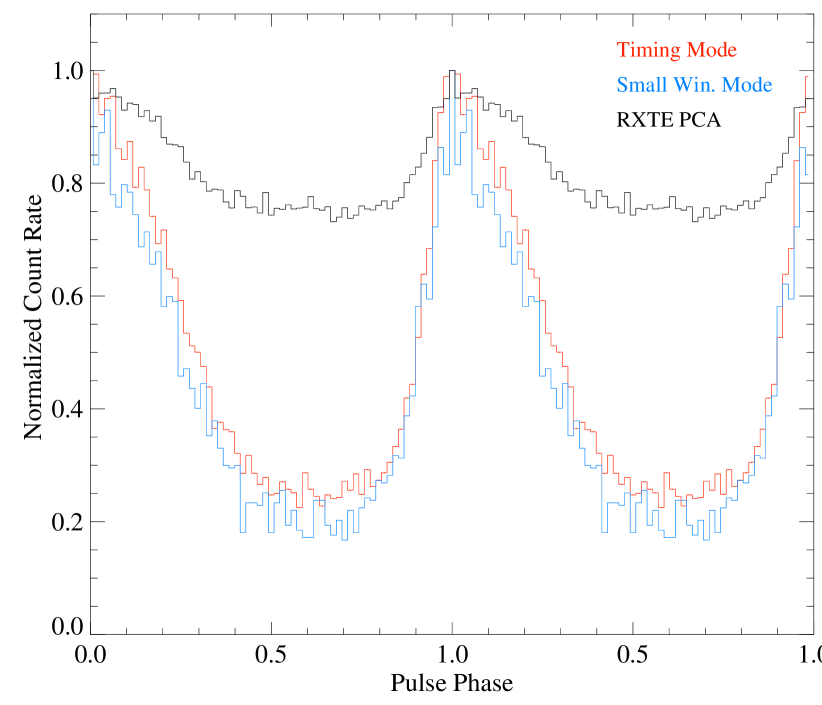
From these light curves we derived pulse periods for each object and observation mode using a -maximization test. The resulting pulse periods are given in Tab. 3. Using Jodrell Banks monthly data base for the Crab ([\astronciteLyne et al.2001]) and Princeton Pulsar Data base ([\astronciteTaylor et al.1993]), we extrapolated radio ephemeris for all sources using the center of observation time of the X-ray observations as reference point. Subsequently we folded the X-ray light curves with the respective pulse period to get pulse profiles shown in Fig. 1 and Fig. 2. For all pulse profiles the maximum flux is set to unity and pulse phase zero is defined by the maximum flux. Therefore Fig. 1 and Fig. 2 do not contain absolute phase information.
5 Observational results
In Fig. 1 the resulting pulse profile for the Crab is shown for Timing Mode, Burst Mode and RXTE PCA observations. The results for PSR B1509-58 in Timing Mode, Small Window Mode and RXTE PCA are shown in Fig. 2.
As Fig. 1 and Fig. 2 clearly demonstrate, we get consistent pulse shape for all observational modes of XMM-Newton. In addition the pulse profiles are well resolved and are in agreement with those we get from RXTE PCA data. As described earlier we took advantage of the imaging capability of XMM-Newton and selected only the central emission region in RAWX direction during data extraction in the fast readout modes. This reduces non pulsed flux from nebula emission and thus we expect higher pulsed fraction for pulse profiles derived from XMM-Newton data compared to RXTE data. The larger amount of statistical uncertainties observed in XMM-Newton data originates in lower effective observation time due to the electronic chopper set during Timing Mode observation or due to low duty cycle in Burst Mode.
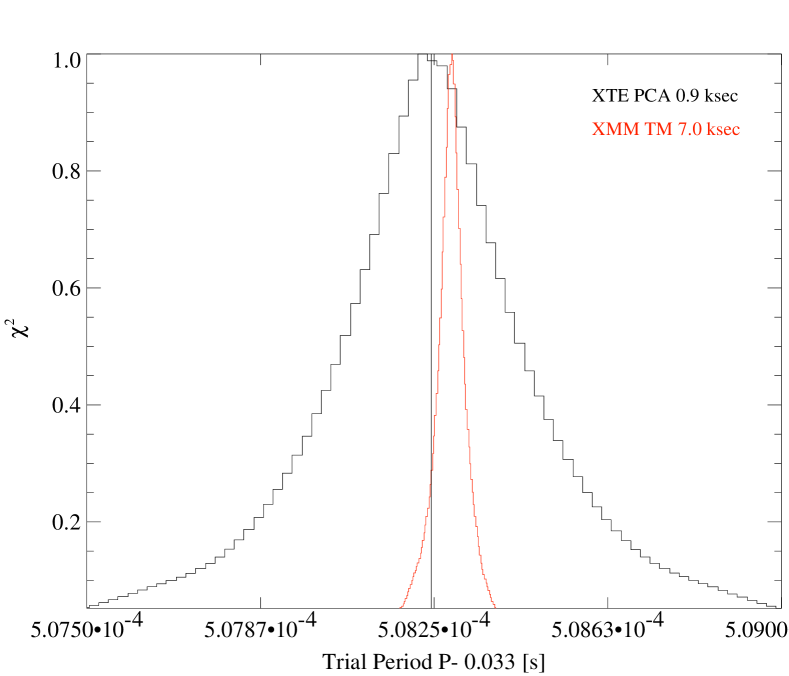
As an example the resulting distribution of the period analysis of the Crab observation of Rev. 0056 is shown in Fig. 3. Within statistical errors the pulse periods we get from RXTE data agree with the extrapolated radio ephemeris marked as solid vertical line. For the XMM-Newton data we get a deviation in pulse period of the order of . This order of magnitude is consistent for all other objects and readout modes, except Small Window mode which has a lower time resolution (compare Tab. 3). We calculated as
| (1) |
where is the extrapolated radio period. These discrepancies are equivalent to a residual velocity component of 0.4–2.2 km/s which might not be taken into account during the corrections applied to the photon arrival times. To cross check our results with EPIC MOS, we analyzed data of PSR B1509-58 observed in MOS timing mode during Rev. 0137, as well. From this analysis we get pulse periods consistent with those derived from EPIC pn data. The observed deviations are too large compared to the specifications which would imply a and prevent a absolute time cross calibration with RXTE for the time being.
To investigate the relative timing in more detail, additional calibration observations of the Crab are scheduled. These observations will take place at different orbital positions of XMM-Newton to be able to separate residual orbital effects.
| Object | RA (J2000.0) | Dec (J2000.0) | Mode | Epoch | |||
|---|---|---|---|---|---|---|---|
| [MJD] | [ms] | [ms] | |||||
| Crab | 05 34 31.973 | +22 00 52.061 | Timing | 51632.8696 | 33.508383 | 33.508424 | |
| Burst | 51988.6595 | 33.521309 | 33.521238 | ||||
| B1509-58 | 15 13 55.617 | -59 08 08.872 | Timing | 51794.3157 | 151.114141 | 151.113045 | |
| Small | 51794.1681 | 151.114125 | 151.112350 | ||||
| B0540-69 | 05 40 11.049 | -69 19 55.188 | Timing | 51691.5783 | 50.519308 | 50.519599 | |
| Small | 51691.0894 | 50.519288 | 50.519297 |
6 Dead time effects
In order to quantify the efficiency of the time resolution with respect to the dead time for each mode in the EPIC pn detector we have simulated synthetic time series for Timing and Burst Mode. These light curves were analyzed using standard time series analysis tools developed at our institute.
The goal of our work was to determine the detection probability of a signal in a power spectrum for the fast readout modes of XMM-Newton. In all simulations our primary goal was to make use of the best possible time resolution allowed in the respective mode. Note that some of the effects described in the following sections, can partially be resolved by rebinning the input light curve or the power spectrum (PSD), this however in any case degrades the time or frequency resolution. A detailed description of the simulations and the parameters used is given by [*]mkuster-WA2:kuster99a.
6.1 Influence of readout sequence
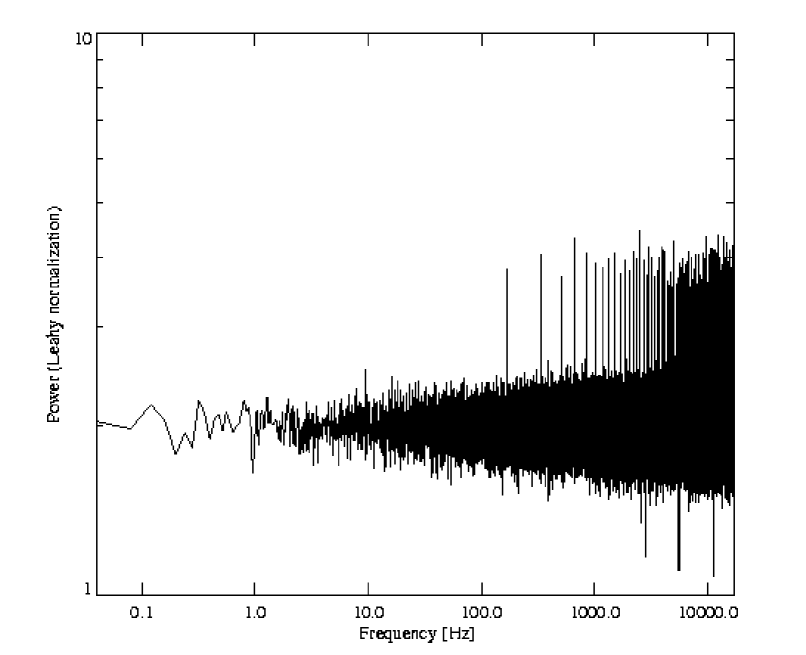
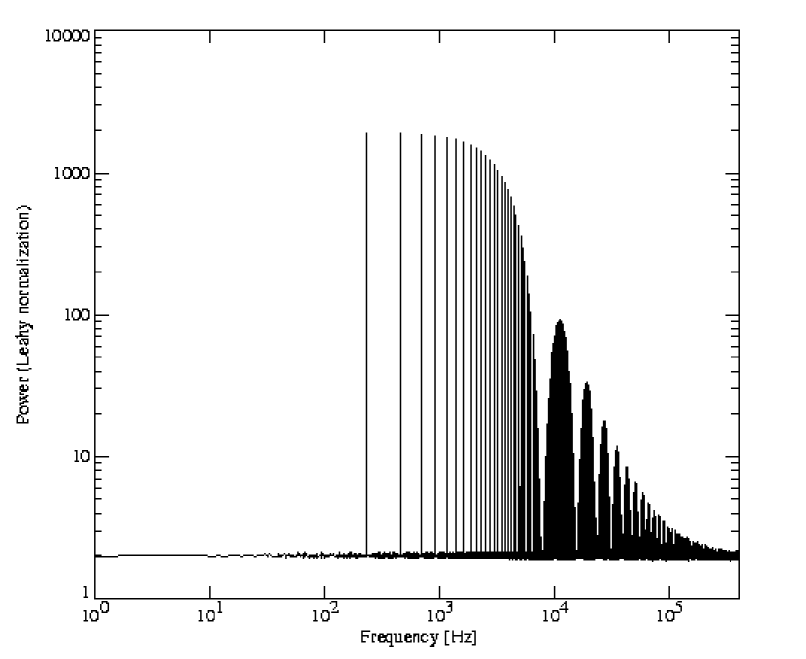
For our synthetic light curves we simulated random Poissonian noise with a time resolution equal to the resolution of the observation mode, and with a mean count rate that corresponds to the “maximum” count rate allowed for the mode according to the telemetry and photon pile up constraints (see [\astronciteEhle et al.2001]). We subsequently folded the data with the readout sequence (dead time function) for the respective mode, and computed the power spectrum in Leahy normalization. We compared the resulting power spectra with those expected for pure white noise.
The results for Timing and Burst Mode show distorted features at large frequencies which are produced by aliasing due to the dead time function of the readout mode (see Fig. 4). The first peak appearing in the power spectrum corresponds to the life/dead time window in both cases: 5.91 ms (169.2 Hz) for the Timing Mode and 4.21 ms (237.5 Hz) for the Burst Mode respectively. Consecutive peaks correspond to multiples of these frequencies. Even with rebinning, for these high time resolution modes the power spectrum is completely dominated by the windowing above these “critical” frequencies, especially in Burst Mode.
In order to determine whether features in the PSD (e.g. QPOs) are detectable above the “critical” frequencies, we analyzed the behavior of the power spectrum in the presence of a variable source. To represent realistic astronomical data, we have simulated a variable X-ray source showing a quasi periodic oscillation (QPO) at kHz frequencies on top of a red noise spectrum and subsequently folded the resulting data with the readout sequence. As the lower left PSD panel of Fig. 4 clearly demonstrates, for Timing Mode the effect of the sampling rate has no influence on the behavior of the QPO in the power spectrum, in the sense that the peak in the range of the critical frequencies can be recognized between the well resolved peaks produced by the sampling. On the other hand, for Burst Mode, the situation is dramatically different. In this case the QPO cannot be detected above the critical frequency (see lower right panel of Fig. 4). The sampling rate effect completely hides any sign of periodic (or quasi periodic) oscillation in the data.
6.2 Influence of detector configuration
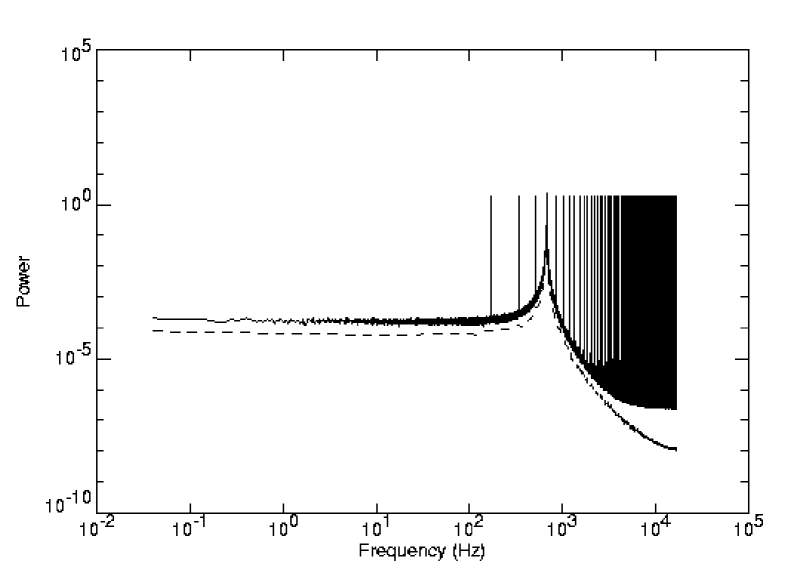
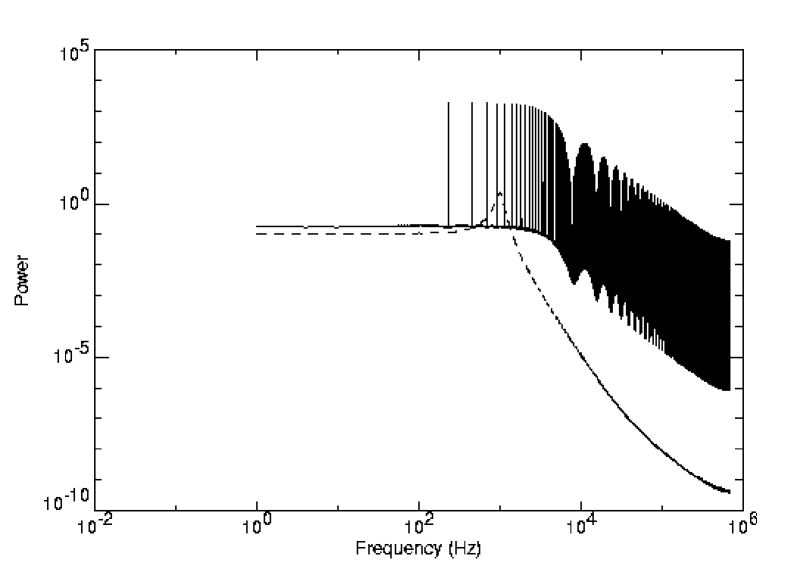
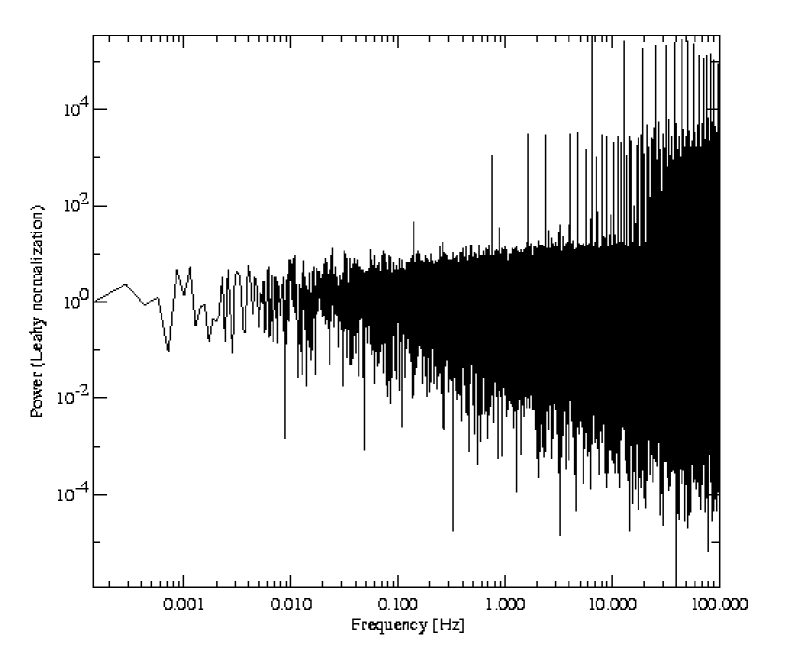
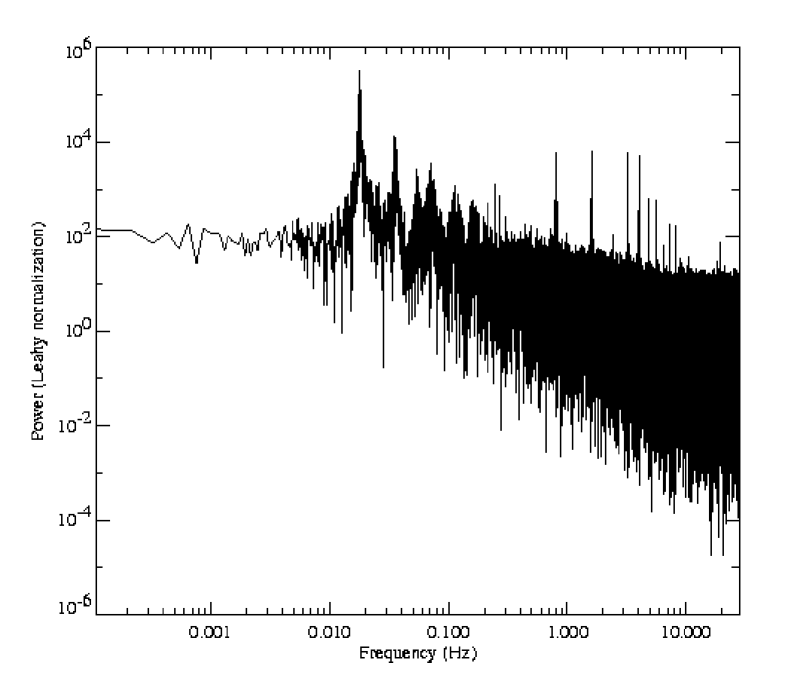
In addition to the internal dead time of the pn-CCD due to the readout sequence, the configuration of the detector can affect the time resolution of an observation as well. In order to fulfill the telemetry constraints of the EPIC Instruments especially for bright sources the observer has the possibility to use the “electronic chopper” implemented in the on board electronics of the EPIC pn camera (see [\astronciteEhle et al.2001]). For a chopper value of , readout frames of the CCD are discarded before processing each th frame. Thus only the data of each th frame is added to the telemetry stream. This adds an additional aliasing window function to the data causing a distortion of the PSD. As an example the PSD of an Crab observation in Timing Mode is shown in the left panel of Fig. 5. During this observation the electronic chopper was set to 25, thus reducing the effective life time by the same factor. As a result the power spectrum is completely dominated by noise above frequencies of 10 Hz.
Depending on count rate a similar effect is caused by counting mode. While the electronic chopper adds a strict periodic dead time window, the effect caused by counting mode generally is quasi-periodic. The observer should be aware of these limiting constraints which are of importance expecially for bright sources when planning an observation.
7 Conclusions
The fast modes of the EPIC cameras provide a time resolution which is outstanding for X-ray CCDs. With this high time resolution it is possible with X-ray CCD detectors to resolve pulsed emission even for fast millisecond pulsars down to pulse periods of 1 msec.
Our preliminary analysis of calibration observations of young millisecond pulsars clearly demonstrates, that the internal timing of the EPIC pn and EPIC MOS camera works as expected. However, currently the accuracy of periods determined from XMM-Newton observations is only of the order of , deviating from an expected uncertainty of . This prevents a calibration of the absolute time for the time being and needs further investigation.
Due to the readout principle of the detector the time resolution is limited by aliasing frequencies caused by dead time effects. This is of importance especially for bright sources and can partially be over come by rebinning the light curve or the power spectrum. However, rebinning always diminishes the effective time resolution as well. In addition the configuration of the detector (electronic chopper or too high telemetry rates) can further degrade the time resolution by additional periodic (el. chopper) or quasi periodic (counting mode) dead time windows.
Acknowledgements.
We want to thank A. Rots who provided PSR B1509-58 data observed with RXTE for cross calibration purposes. This work is partially funded by “Deutsches Zentrum für Luft und Raumfahrtangelegenheiten” (DLR) under grant 50 OX 0002. This work is based on observations obtained with XMM-Newton, an ESA science mission with instruments and contributions directly funded by ESA Member States.References
- [\astronciteAranci et al.1998] Aranci, G., Cotardo, G., Masaro, D. et al. 1998, XMM-HD-LAB-0001, XMM Command and Data Management Unit Design Description, ESA
- [\astronciteBriel et al.2002] Briel, U.G., Dennerl, K., Feyberg, M. et al., this volume
- [\astronciteEhle et al.2001] Ehle, M., Breitfellner, M., Dahlem, M. et al. 2001, The XMM Users’ Handbook, Issue 2.0, ESA
- [\astronciteKendziorra et al.1997] Kendziorra, E., Bihler, E., Grubmiller, W. et al. 1997, Proc. SPIE, 3114, 155
- [\astronciteKendziorra et al.1999] Kendziorra, E., Colli, M., Kuster, M. et al. 1999, Proc. SPIE, 3765, 204
- [\astronciteKirsch et al.2002] Kirsch, M., Kendziorra, E., Feyberg, M. et al., this volume
- [\astronciteKuster et al.1999] Kuster, M., Benlloch, S., Kendziorra, E. et al. 1999, Proc. SPIE, 3765, 673
- [\astronciteLammers2001] Lammers, U. 2001, The XMM ODF Access Layer Library, ESA
- [\astronciteLeahy et al.1983] Leahy, D.A., Darbo, W., Elsner, R.F. et al. 1983, ApJ, 266, 160
- [\astronciteLyne et al.2001] Lyne, A.G., Jordan, C.A., Roberts, M.E. 2001, Jodrell Banks Observatory, University of Manchester
- [\astronciteMuno et al.1999] Muno, M.P., Morgan, E.H., Remillard, R.A. et al. 1999, ApJ, 527, 321
- [\astronciteTaylor et al.1993] Taylor, J.H., Manchester, R.N., Lyne, A.G. 1993, ApJS, 88, 529