IRAS 21391+5802: The Molecular Outflow and its Exciting Source
Abstract
We present centimeter and millimeter observations of gas and dust around IRAS 21391+5802, an intermediate-mass source embedded in the core of IC 1396N. Continuum observations from 3.6 cm to 1.2 mm are used to study the embedded objects and overall distribution of the dust, while molecular line observations of CO, CS, and CH3OH are used to probe the structure and chemistry of the outflows in the region. The continuum emission at centimeter and millimeter wavelengths has been resolved into three sources separated from each other, and with one of them, BIMA 2, associated with IRAS 21391+5802. The dust emission around this source shows a very extended envelope, which accounts for most of the circumstellar mass of . This source is powering a strong molecular outflow, elongated in the E–W direction, which presents a complex structure and kinematics. While at high outflow velocities the outflow is clearly bipolar, at low outflow velocities the blueshifted and redshifted emission are highly overlapping, and the strongest emission shows a V-shaped morphology. The outflow as traced by CS and CH3OH exhibits two well differentiated and clumpy lobes, with two prominent northern blueshifted and redshifted clumps. The curved shape of the clumps and the spectral shape at these positions are consistent with shocked material. In addition, CS and CH3OH are strongly enhanced toward these positions with respect to typical quiescent material abundances in other star-forming regions. These kinematical and chemical evidences suggest that the clumps are tracing gas entrained within the surface of interaction between the molecular outflow and the dense ambient quiescent core, and that the morphology of the molecular outflow is a result of this interaction. The circumstellar mass together with the power-law index of the dust emissivity measured, , and the fact that the source is driving a molecular outflow are consistent with the source BIMA 2 being an embedded intermediate-mass protostar. In addition, the source fits very well correlations between source and outflow properties found for low-mass Class 0 objects. The other two sources in the region, BIMA 1 and BIMA 3 have a mass of , and their dust emissivity index, and , respectively, is consistent with more evolved objects. BIMA 1 is also driving a very collimated and small bipolar outflow elongated in the N–S direction.
1 Introduction
It is well known that Young Stellar Objects (YSOs) are embedded in dust and gas. For low-mass stars, circumstellar dusty material can be found in two basic structures: envelopes and disks. Theory outlines an evolutionary scenario in which these structures evolve from envelopes to disks as the central object evolves (Adams, Lada, & Shu 1987; Shu, Adams, & Lizano 1987) from the youngest Class 0 objects, surrounded by infalling envelopes, to the optically visible T Tauri stars, with circumstellar disks. Looney, Mundy, & Welch (2000) have carried out sub-arcsecond millimeter wavelength observations of the dust emission around low-mass objects, and have shown that the more embedded objects have most of their emission in large scale structures, consistent with envelopes, while optical/IR objects have compact continuum emission, associated with disks, with little or no extended emission. Molecular line observations also show a tendency of the gas emission to be stronger toward protostar candidates than toward T Tauri stars (e.g. Ohashi et al. 1991, 1996; Chen, Fukui, & Yang 1992).
This well-defined evolutionary sequence found for low-mass stars, however, does not have a counterpart for higher mass stars, such as Herbig Ae and Be stars and their intermediate-mass precursors with masses in the range . Circumstellar disks, similar to those surrounding T Tauri stars, have been detected around Herbig Ae stars (Guilloteau & Dutrey 1998; Mannings & Sargent 1997, 2000; Natta et al. 2001), but not around Herbig Be stars (Natta, Grinin, & Mannings 2000; Fuente et al. 2001). The non-detection of circumstellar disks around Herbig Be stars has been interpreted as a consequence of the rapid evolution of the circumstellar structures and of the outflows as compared to T Tauri and Herbig Ae stars (Natta et al. 2000; Fuente et al. 2001). Regarding the intermediate-mass very YSOs, the situation is even less studied and less well understood due to the difficulty of identifying the youngest truly protostars, which are still in the infalling envelope phase. In addition, these objects are rare in comparison with their low-mass counterparts and tend to be located at greater distances. The immediate vicinity of intermediate-mass protostars is a very complex environment, where the extended emission is usually resolved into more than one source when observed at high resolution (e.g. G173.58+2.45: Shepherd & Watson 2002). In addition, the molecular outflows driven by intermediate-mass objects are more energetic. Thus, their interaction with the circumstellar gas and dust material surrounding the protostars is expected to be stronger and more dramatic, disrupting the envelopes and pushing away the dense gas at high velocities. Although these outflows are, in general, less collimated and more chaotic than those of low-mass stars (e.g. NGC 7129: Fuente et al. 2001), this could probably be due to observational constraints. Since these regions are located, on average, further away, these outflows are usually observed with less linear spatial resolution than nearby low-mass flows. However, when observed with high angular resolution their appearance seems to be more collimated and less chaotic (e.g. HH 288: Gueth, Schilke, & McCaughrean 2001). Therefore, there is little doubt that the study of intermediate-mass star-forming regions is a very complicated task, but attractive at the same time, due to all the phenomena that are taking place in such environments. It is also clear that in order to understand the heterogeneity of the more evolved Herbig Ae and Be stars, it is necessary to study such objects at a very early stage of their evolution, when both envelopes and circumstellar disks exist around them.
In an attempt to build our understanding of intermediate-mass stars and compare their morphology and evolution with those of low-mass stars, we carried out interferometric radio observations of the dust and gas around IRAS 21391+5802, a very young intermediate-mass object. IRAS 21391+5802 is a cold far-infrared source, with a bolometric luminosity estimated to range from 235 (Saraceno et al. 1996) to 440 (Sugitani et al. 2000). It is deeply embedded in the bright-rimmed globule IC 1396N, which is located at a distance of 750 pc (Matthews 1979). This source exhibits all of the signposts of an extremely young object, such as strong submillimeter and millimeter continuum dust emission (Wilking et al. 1993; Correia 2000; Sugitani et al. 2000; Codella et al. 2001), high-density gas (Serabyn, Güsten, & Mundy 1993; Cesaroni, Felli, & Walmsley 1999; Codella et al. 2001), and water maser emission (Felli, Palagi, & Tofani 1992; Tofani et al. 1995; Patel et al. 2000). Sugitani et al. (1989) discovered an extended CO bipolar outflow, which has also been mapped by Codella et al. (2001). In addition, recent near-infrared images by Nisini et al. (2001) have revealed the presence of a collimated H2 jet driven by IRAS 21391+5802.
2 Observations
2.1 VLA observations
The 3.6 cm continuum observations were carried out in 2000 September 23 using the Very Large Array (VLA) of the NRAO111The National Radio Astronomy Observatory is a facility of the National Science Foundation operated under cooperative agreement by Associated Universities, Inc. in the D configuration. The field was observed for a total of about 1 hr 45 m, and the phase center was set to the position , , which coincides with the 3.1 mm position of one of the sources in the field, BIMA 2 (see ). Absolute flux calibration was achieved by observing 3C 286, with an adopted flux density of 5.18 Jy. Phase was calibrated by observing 2148+611, which has a bootstrapped flux of Jy. CLEANed maps were made using the task IMAGR of the Astronomical Image Processing System (AIPS) software of NRAO, with the ROBUST parameter of Briggs (1995) set equal to 5, which is close to natural weighting. The resulting synthesized beam was at P.A. °, and the rms noise of the maps was 20 Jy beam-1. For the maps made with uniform weighting the synthesized beam was at P.A. °, and the rms noise was slightly higher, 32 Jy beam-1.
2.2 BIMA observations
Millimeter interferometric observations were carried out with the BIMA array222The BIMA array is operated by the Berkeley-Illinois-Maryland Association with support from the National Science Foundation. in the B and the C configurations between March 2000 and January 2001. The digital correlator was configured to observe simultaneously the continuum emission and some molecular lines. Details of the observations are given in Table 1. The phase center was located at , , the position of IRAS 21391+5802. Amplitude and phase were calibrated by observations of BL Lac, whose flux density was determined relative to Uranus. The uncertainty in the amplitude calibration is estimated to be %. The data were calibrated and analyzed using standard procedures in the Multichannel Image Reconstruction Image Analysis and Display (MIRIAD) software package (Sault, Teuben, & Wright 1995). The quality of the continuum data at 2.7 mm was not good enough to use the data for mapping and analysis.
3 Results
3.1 Centimeter continuum emission
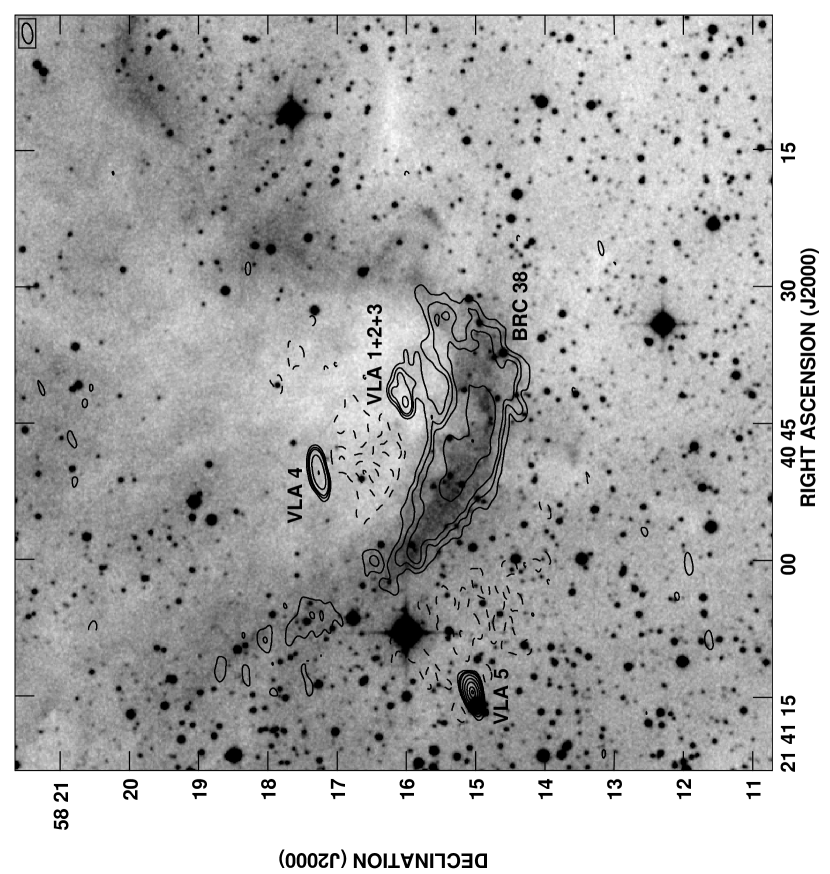
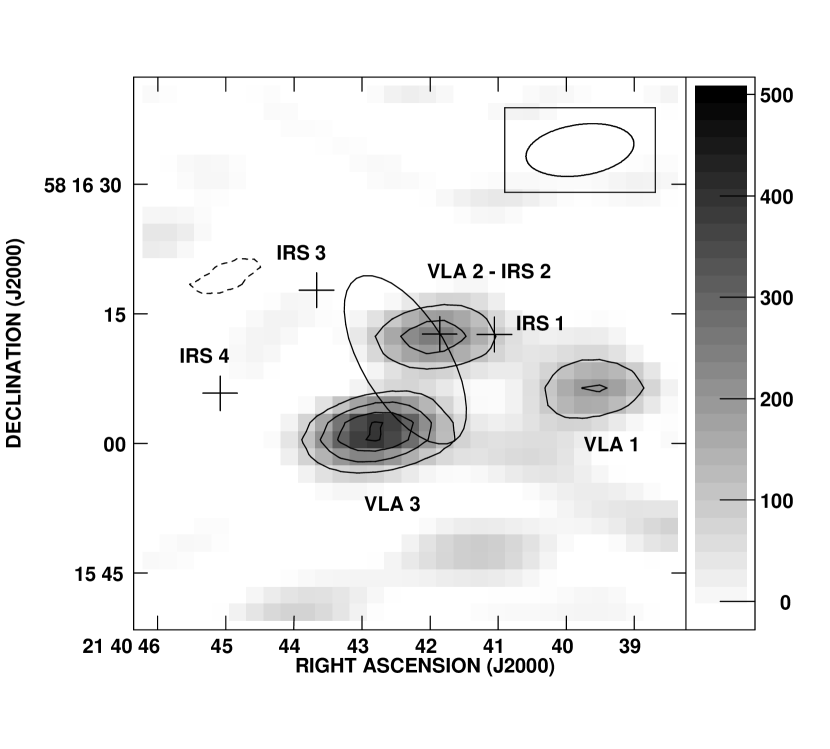
In Figure 1 we show the natural-weight map at 3.6 cm superposed on the red image of the Digitized Sky Survey333The Digitized Sky Survey was produced at the Space Telescope Science Institute under U.S. Government grant NAG W-2166. The images of these surveys are based on photographic data obtained using the Oschin Schmidt Telescope on Palomar Mountain and the UK Schmidt Telescope. The plates were processed into the present compressed digital form with the permission of these institutions. 2. The extended 3.6 cm emission matches the optical emission of a bright-rimmed cloud, catalogued as BRC 38 by Sugitani, Fukui, & Ogura (1991) and belonging to the HII region IC 1396N. Above the 5 detection threshold, in addition to the extended emission, we detected 5 sources, VLA 1 to 5. The first three, unresolved in the natural-weight map, appear resolved into three sources separated from each other in the uniform map, shown in Figure 2. The central positions and flux densities of the detected sources are given in Table 2. The spectral indices between 21 and 3.6 cm were obtained using the NRAO VLA Sky Survey (Condon et al. 1998) to measure the 21 cm flux densities, which provides an angular resolution of . The results are shown in Table 2.
The spectral index of BRC 38 is , characteristic of optically thin free-free emission of a HII region. VLA 4 has a spectral index of , which is consistent with non-thermal emission and is probably a background source. The emission of VLA 5, with a measured spectral index of 0.14, may have a thermal component or is time variable (and non-thermal), giving an apparently positive spectral index. As seen in Figure 1, VLA 5 is close to an optical star of spectral type F identified as Cl Trumpler 37 1030 by Alknis (1958). However, the offset of between the radio continuum emission and the star is too large, and it suggests that they are likely not associated. VLA 1, VLA 2 and VLA 3 coincide with the sources BIMA 1, BIMA 2 and BIMA 3 respectively, detected at mm wavelengths with BIMA (see next section). VLA 2 lies inside the error ellipse of IRAS 21391+5802 and coincides with the near infrared source IRS 2 (Wilking et al. 1993). VLA 3 also lies within the error ellipse of the IRAS source, and it is the strongest of the three sources. Water masers have been found associated with both sources (Tofani et al. 1995)
3.2 Dust emission
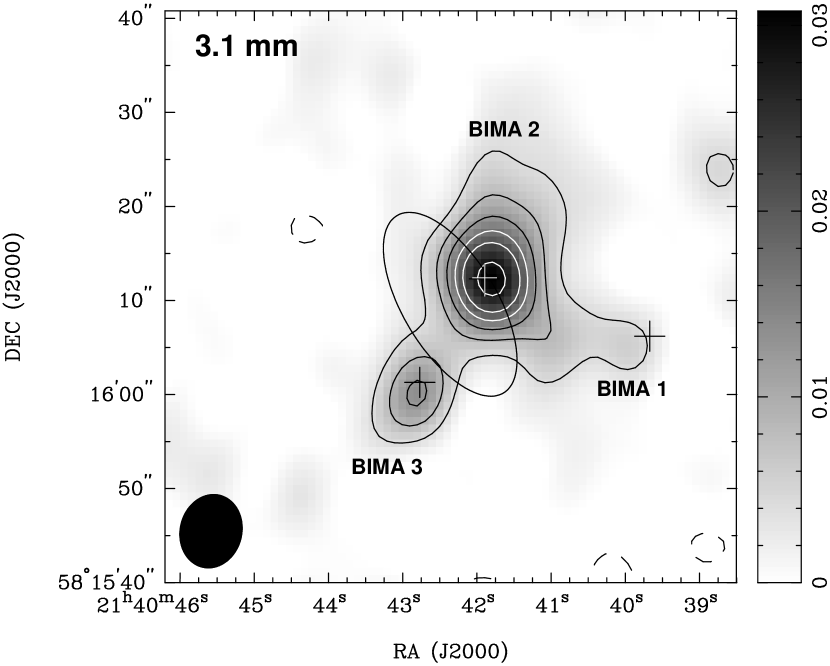
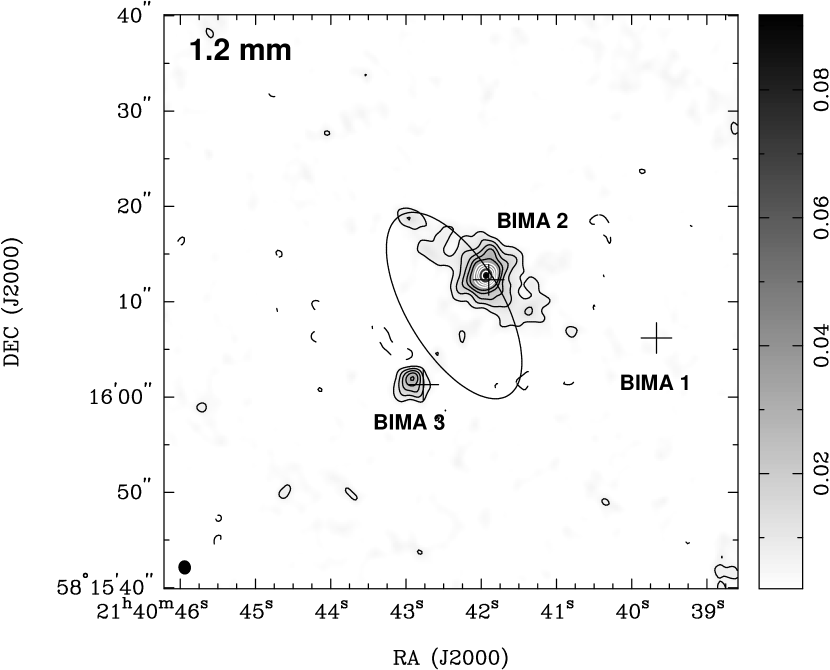
The millimeter continuum emission around the embedded IRAS 2139+5802 was imaged at 3.1 and 1.2 mm with the BIMA, and the maps are shown in Figure 3. As can be seen in this figure, the continuum emission is dominated by an extended clumpy structure, especially at 3.1 mm, which splits into two main peaks visible at both wavelengths and separated ( AU at the distance of the source), and a weaker peak toward the west, visible at 3.1 mm; hereafter we will refer to these three clumps as BIMA 1, BIMA 2 and BIMA 3. Codella et al. (2001) detected two unresolved continuum sources by using the OVRO interferometer at millimeter wavelengths, called A and B, which are coincident with BIMA 2 and BIMA 3, respectively. The dust emission has not been resolved at submillimeter wavelengths by using the JCMT telescope (Correia 2000), which provides a resolution of at 450 m, similar to the resolution of our 3.1 mm map. However, the extended submillimeter emission suggests the presence of multiple objects in the region. A possible explanation for this could be that the interferometer is likely resolving out some of the extended cold dust emission, and thus, it is more sensitive to more compact structures. In fact, extrapolating the flux density of 10.5 Jy obtained at 850 m by Correia (2000) to millimeter wavelengths by using typical spectral indices in the range 3–4, it is clear that the interferometer observations are indeed missing a significant amount of emission. Embedded sources are very often members of multiple systems, as already noticed in deeply embedded low-mass cores (Looney et al. 2000; Motte & André 2001), which indicates that truly isolated star formation is rare. The positions and flux densities of the millimeter sources at 3.1 and 1.2 mm are given in Table 3. At millimeter wavelengths the contribution by free-free emission, which is expected to be dominant at centimeter wavelengths (e.g. Anglada 1995; Anglada et al. 1998; Beltrán et al. 2001) is likely small as compared to the thermal dust emission. Wilking et al. (1989) observed the region at 2 cm with the VLA and did not detect any of the sources at a level of 0.51 mJy. By using this upper limit for the flux density at 2 cm, we determined the spectral index at centimeter wavelengths, for BIMA 1, for BIMA 2, and for BIMA 3. On the other hand, Reynolds (1986) modeled the emission for an inhomogeneous source, for which the free-free emission can come from both optically thin and optically thick regions, and found that for a jet with constant velocity, temperature and ionization fraction the spectral index should be always . This case is the most likely scenario for outflow central sources (e.g. Anglada et al. 1998; Beltrán et al. 2001). Thus, for BIMA 1 we assumed an upper limit for the spectral index of 1.3. Extrapolating the fluxes obtained at 3.6 cm to millimeter wavelengths with these spectral indices, we found that the expected free-free emission at millimeter wavelengths is mJy (% of the millimeter emission; see Table 3) for BIMA 1, mJy (%) for BIMA 2, and mJy (%) for BIMA 3. Thus, for BIMA 2 and BIMA 3 the dust emission dominates at millimeter wavelengths, while for BIMA 1 it is not clear from our results.
The strongest source detected at millimeter wavelengths in the region is BIMA 2. As can be seen in the maps, BIMA 2 is the object associated with the infrared source IRAS 21391+5802. Its millimeter emission clearly shows two components, a centrally peaked source, plus an extended component, elongated roughly in the N–S and the NE–SW direction at 3.2 mm and 1.3 mm, respectively. The comparison of the peak intensities measured at both wavelengths with the total integrated flux densities (see Table 3) indicates that a considerable fraction of the flux density (%) arises from the envelope. By fitting elliptical Gaussians to the maps, we measured the deconvolved size of the source, which is AU at P.A. at 3.1 mm, and AU at P.A. at 1.2 mm (see Table 3). Note that the deconvolved size is dependent on the synthesized beam, indicating that the source does not have a perfect Gaussian shape structure. These sizes are consistent with the values found for envelopes around low- and intermediate-mass protostars (e.g. Wilking et al. 1989; André, Ward-Thompson, & Barsony 1993; Hogerheijde & Sandell 2000; Looney et al. 2000; Fuente et al. 2001). This source also exhibits centimeter emission (see Table 2), and it is driving a molecular outflow detected in the region (see next section).
The source BIMA 3, located ( AU in projection) southeast of BIMA 2, has also been detected at both millimeter wavelengths. The source is associated with centimeter emission (see Table 2) and with water maser emission (Tofani et al. 1995), indicating that BIMA 3 is a young stellar object, too. However, its emission is more compact than the emission around BIMA 2, and it has only been resolved at 1.2 mm (see Table 3), with a deconvolved size of AU at P.A. . This deconvolved size is also very dependent on the angular resolution, having a value of AU at P.A. if we use only the B configuration data.
Finally, the other source detected in the region is BIMA 1. This source is a faint unresolved clump only detected, as stated before, at 3.1 mm (see Fig. 3). This source, also detected at centimeter wavelengths (see Table 2), is ( AU) southwest of BIMA 2, and ( AU) northwest of BIMA 3, and it could be the driving source of a very collimated N–S bipolar outflow discovered in the region (see next section).
3.3 The molecular outflow
The molecular outflow associated with IRAS 21391+5802 has been previously studied through lower resolution CO (Sugitani et al. 1989; Codella et al. 2001), CS (Serabyn et al. 1993; Codella et al. 2001), SiO and HCO+ observations (Codella et al. 2001). The observations reported in this study improve significantly the angular resolution of the maps of the region: the angular resolution of for the CO is at least 6 times better in beam area than previous observations, revealing the structure of the molecular outflow in great detail.
3.3.1 CO emission
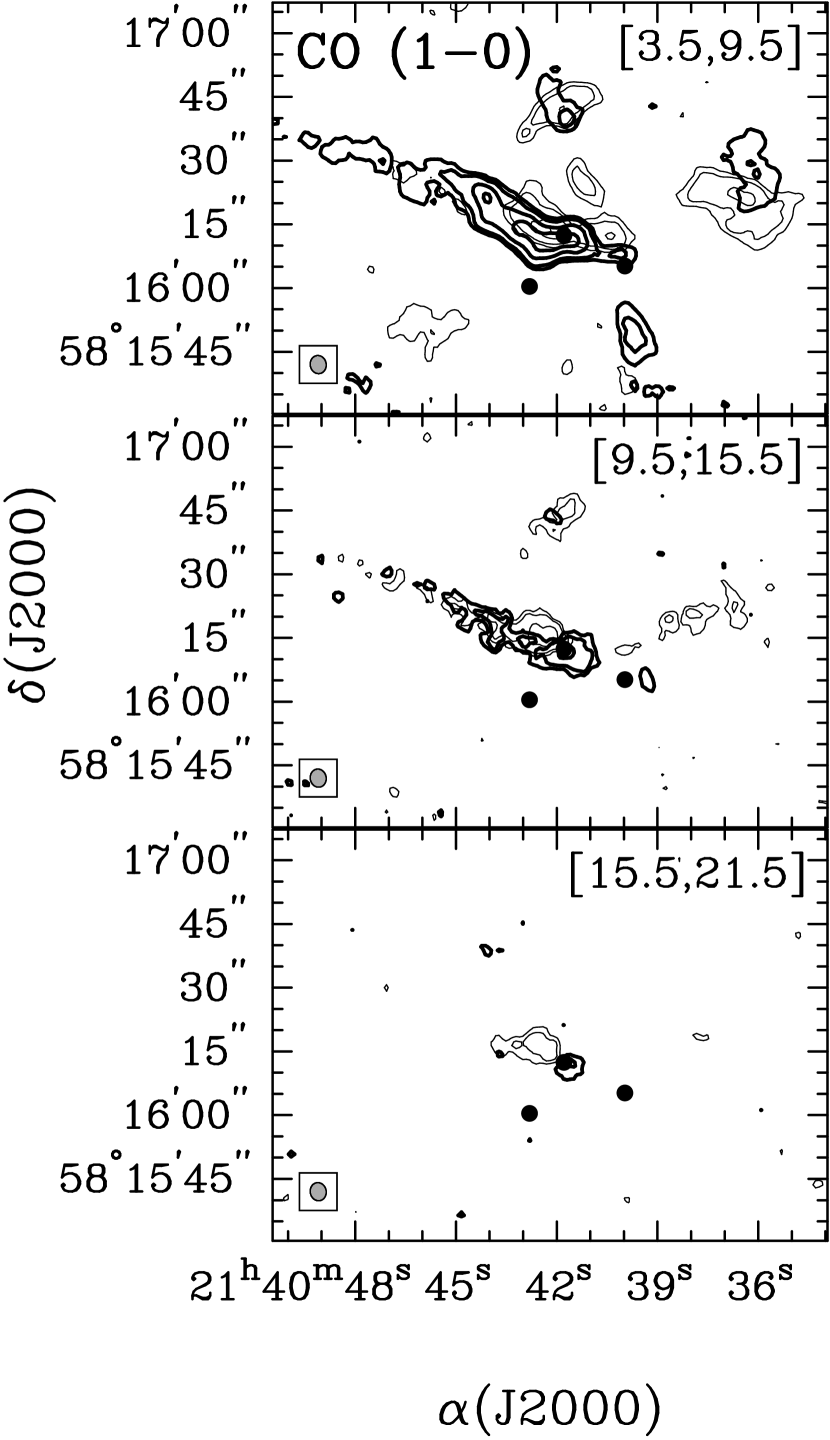
Figure 4 shows the maps of the integrated CO (=10) emission in different blueshifted and redshifted velocity intervals. Taking into account that the systemic velocity, , is roughly km s-1 (Patel et al. 1995), the interval of velocities [,] km s-1 corresponds to the low velocity outflow, [,] km s-1 to the intermediate velocity outflow, and [,] km s-1 to the high velocity outflow. Due to the strong self-absorption observed for the central velocity channels ( km s-1), also visible in single-dish observations (Wilking et al. 1989; Codella et al. 2001), it was not possible to map and study the cloud structure. Additionally, extended emission also causes negative contours due to the fact that the interferometer is filtering out part of the emission. The CO emission traces at least two molecular outflows in the region: a stronger outflow along the E–W direction and centered at the position of BIMA 2, and a collimated, weaker and smaller bipolar outflow elongated along the N–S direction on both sides of BIMA 1 (see Fig. 4). This latter outflow is only detected at low velocities, and its presence is also marginally revealed in CO (=21) single-dish observations of Codella et al. (2001). Taking into account the blueshifted and redshifted emission closer to BIMA 1, the total extent of this outflow is ( pc).
The E–W outflow presents a more complex structure and kinematics. At high velocities the outflow shows a very well defined bipolar morphology, with the blue lobe toward the southwest, and the red lobe toward the northeast. However, at lower velocities the blueshifted and redshifted emission are highly overlapping, and the strongest emission shows a V-shaped morphology that is probably tracing the bright-rim seen in CO (=21) single-dish observations by Codella et al. (2001). These authors explain this morphology as a result of the interaction of the outflow with the ambient cloud (see for a discussion of the outflow morphology). The presence of additional outflows in the region could also be a possible explanation for the complexity of the gas emission. The outflow is highly collimated, and the collimation remains even at low velocities with respect to the cloud. The morphology of the outflow at low velocities, with blueshifted and redshifted gas in both lobes, also suggests that the axis of the outflow is close to the plane of the sky. In addition to the main structure, there are also visible at low velocities some blueshifted and redshifted clumps. In particular, at northwest from BIMA 2, there is a big bow-shock shaped clump (see Fig. 4) that coincides spatially with a CS (=21) clump (see ), suggesting perhaps that there is a shocked surface at the position of this clump.
3.3.2 CS emission
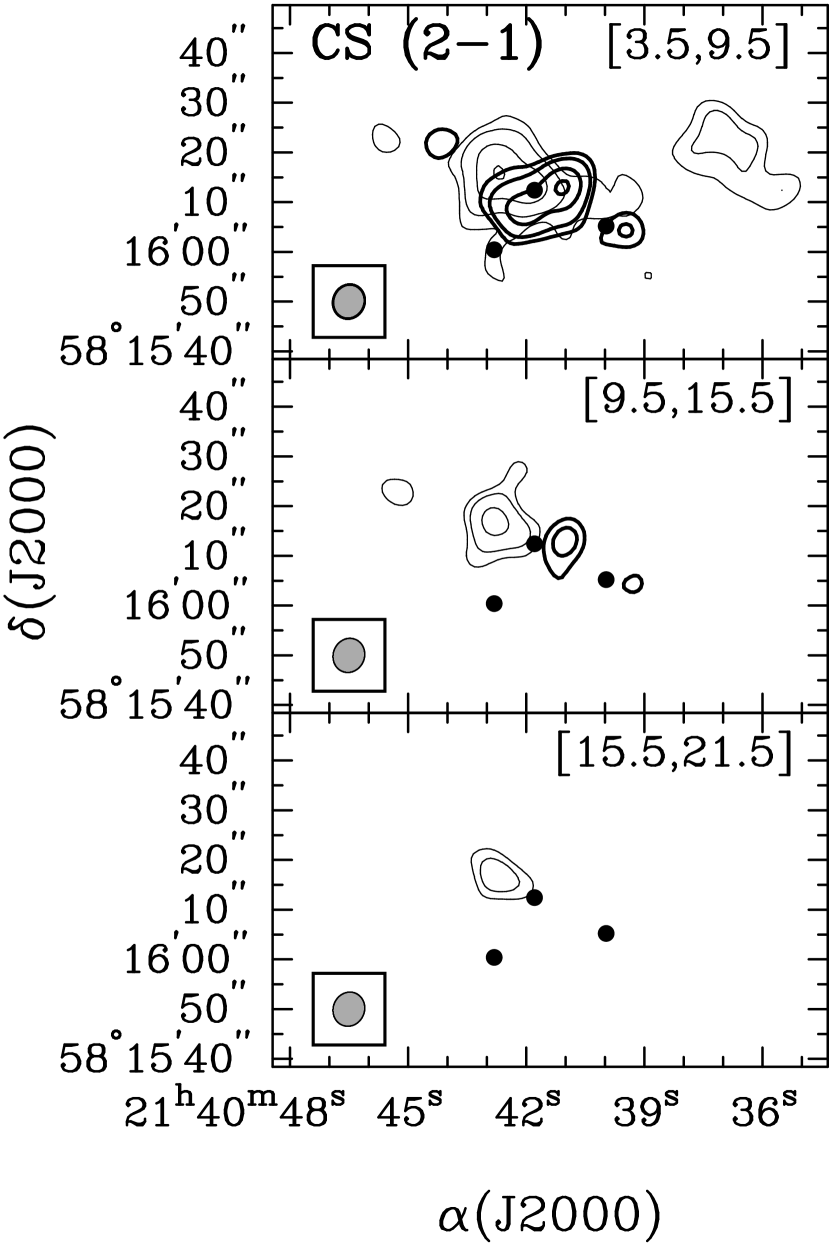
The emission of the high-density tracer CS is found to be associated with the E–W molecular outflow driven by BIMA 2. Serabyn et al. (1993) already detected CS at high velocities through the spectra of different rotational transitions showing prominent wing emission. However, this is the first time that this outflow has been mapped with high spatial resolution. Figure 5 shows the CS (=21) emission at the same velocity intervals as shown for the CO (=10) emission (see previous section). As can be seen in this figure, the lobes of the outflow are very well defined, with the redshifted emission NE, and the blueshifted emission toward the SW. The CS (=21) emission shows a different morphology at different velocities, just as in the case of the CO emission. While at high velocities the outflow is clearly bipolar, the blueshifted and the redshifted emission start to overlap at lower velocities, and their structures become less collimated. At low velocities, a redshifted emission clump is also visible in CS northwest of BIMA 2, at the same position as the bow-shock shaped clump seen in CO. In addition, at low and intermediate velocities, a redshifted clump located northeast from IRAS 21391+5802 is detected. Finally, there is also blueshifted emission possibly associated with BIMA 1.
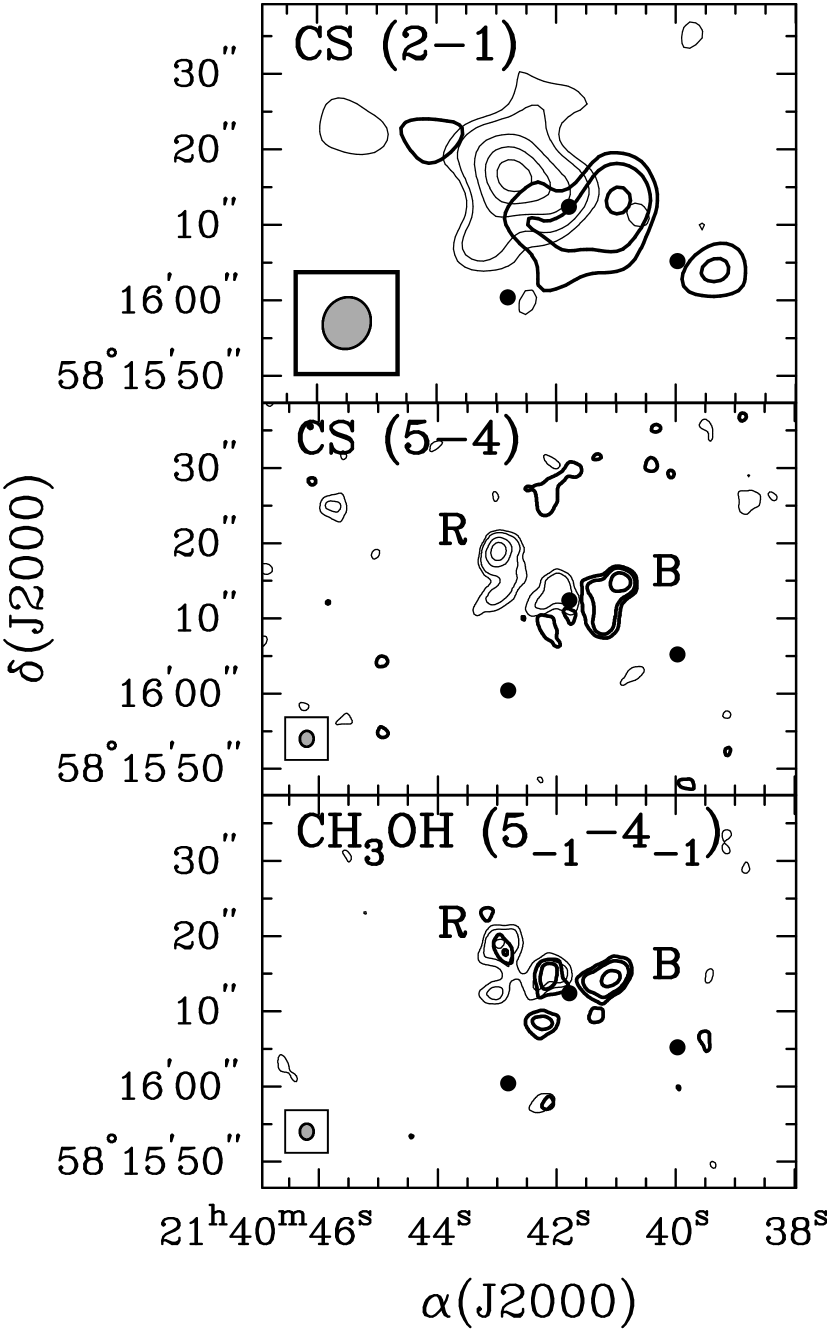
The molecular outflow as traced by the CS (=54) emission shows two well differentiated and clumpy lobes (see Fig. 6). Both the blueshifted and redshifted lobes, which have been integrated for a velocity interval [] km s-1, split into several clumps, with the emission of the northern clump in both lobes being the more prominent and strong. Hereafter we call these northern blueshifted and redshifted clumps, B and R, respectively. Additionally, the northeastern clump visible in the CS (=21) transition is also detected in CS (=54) (see Fig. 6). No outflowing CS (=54) emission has been found associated with BIMA 1 nor BIMA 3.
3.3.3 CH3OH emission
The molecular outflow as traced by CH3OH (=5-14-1) resembles in internal structure and extent the emission as traced by CS (=54) (Fig. 6). Both lobes, integrated over [] km s-1, are also split into several clumps. The northern blueshifted and redshifted clumps are also the strongest ones, and their positions coincide with the positions of the B and R clumps detected in CS (=54). The northeastern clump detected in CS (=21) and CS (=54) is not visible in CH3OH. High-velocity gas has not been detected toward BIMA 1 nor BIMA 3.
4 Analysis
4.1 Dust emission
Using the integrated flux densities at 3.1 and 1.2 mm, we measured the millimeter spectral index (where ) for the three sources (see Table 3). As the emission for BIMA 2 is very extended, the observations at 1.2 mm, which have a small synthesized beam, are resolving out part of the emission. Thus, in order to obtain a more accurate value of the spectral index, it is better to use the flux densities measured by using the same range of visibilities (5–28 k) at both wavelengths. By doing this, we measured a spectral index for BIMA 1, for BIMA 2, and for BIMA 3. For the sources less resolved (BIMA 1 and BIMA 3) the values obtained do not differ significantly from the values given in Table 3.
Assuming that the dust emission is in the Rayleigh-Jeans regime and is optically thin, the spectral index can be related directly to the power-law index of the dust emissivity (where ), through . For BIMA 2 the derived value of is . Such a value of is consistent with the values found for Class 0 low- and intermediate-mass objects (Dent, Matthews, & Ward-Thompson 1998; Testi & Sargent 1998; Chini et al. 2001). Saraceno et al. (1996) have measured a value for this source from ISO-LWS and JCMT data, with an angular resolution of and , respectively. The value measured for BIMA 3 is , and for BIMA 1 is . Those values are considerably lower than the value obtained for BIMA 2, and could be indicative of a different evolutionary status (see § 5.2). Note that Codella et al. (2001) have measured a higher value, , for BIMA 2 and BIMA 3, by combining together data from both sources obtained with different angular resolution.
The circumstellar masses for the three sources were estimated, assuming that the dust emission is optically thin, by using
| (1) |
where is the flux density, is the distance, is the dust mass opacity coefficient, and is the dust temperature. We used the flux densities measured at 3.1 mm, the dust opacity given by (/cm2 g-1) (Hildebrand 1983), with the dust emissivity indices found from the spectral index (see above), and a dust temperature of 25 K (temperature estimates for this region range from 20 to 27 K; Serabyn et al. 1993; Codella et al. 2001). For BIMA 2, the mass derived was 5.1 , while for BIMA 1 and BIMA 3 the mass was 0.07 . The mass estimated for BIMA 2 is consistent with the value of 8.3 derived by Saraceno et al. (1996) through single-dish observations, which do not resolve out extended emission. However, Codella et al. (2001) estimated a mass of 20 for BIMA 2, and 4 for BIMA 3. These high values for the mass are due to the different value of the dust mass opacity coefficient used by them. This shows clearly how the dust opacity law can affect dramatically the estimate of the mass.
4.2 Physical parameters of the CO outflows
Assuming that the CO emission is in LTE and is optically thin, and following the derivation of Scoville et al. (1986), we calculated the mass of the gas associated with the two outflows detected in the region by using
| (2) |
where is the CO excitation temperature, is the distance in kiloparsecs, and is the line flux density measured in Jy. The excitation temperature is 20 K (Codella et al. 2001). We assumed an [H2]/[CO] abundance ratio of 104, and a mean atomic weight of the gas . In Table 4 we give the masses, the CO momentum, the kinetic energy, and the momentum rate in the outflow. We also report the range of outflow velocities for the outflows. Note that due to the missing flux, the absorption by the ambient cloud, and the possibility that CO is optically thick in portions of the flow, the masses calculated should be considered as lower limits. In addition, the integration range chosen will miss the part of the outflow at lower velocities that is not included. We estimated the optical depth from the observed brightness temperature and by taking K, and we found that our assumption that the emission is optically thin is correct if beam dilution is unimportant. However, in order to get a better estimate of the optical depth of the emission, observations of a CO isotope, such as 13CO, would be needed. Note that Codella et al. (2001) assume an optical depth of 10 for the E–W outflow emission at velocities below 20 km s-1 with respect to the cloud velocity. For such high optical depths, the opacity correction factor is essentially the optical depth, , dominating the uncertainty in the measurement of the masses. Thus, as we cannot rule out the possibility that the gas is clumpy and not optically thin, the estimated molecular mass may be a lower limit. The inclination angle, , of the outflow with respect to the plane of the sky is also an important factor of uncertainty when estimating the momentum, the kinetic energy, and the momentum rate in the outflow. As stated before, the morphology of the outflow suggests that is small, and thus, we adopted a value (Codella et al. [2001] assume a value in the range 10–).
4.3 Properties of the shocked material
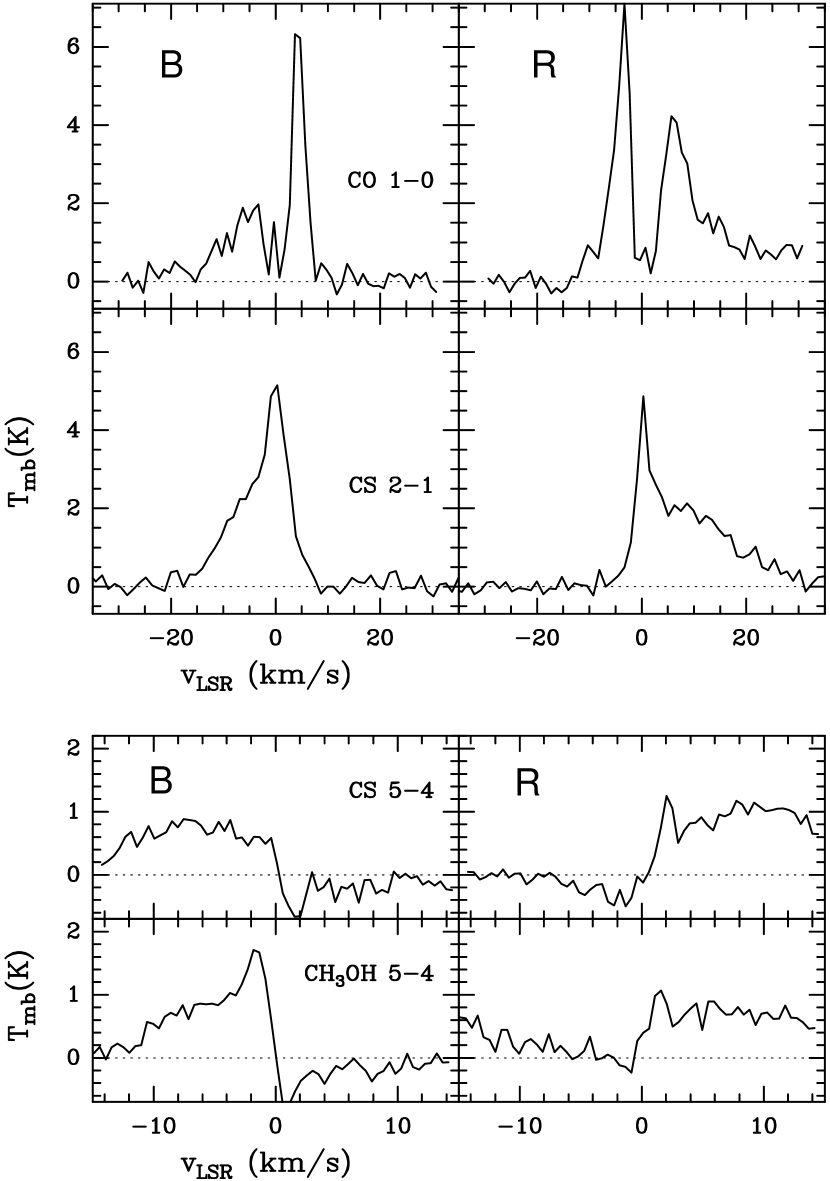
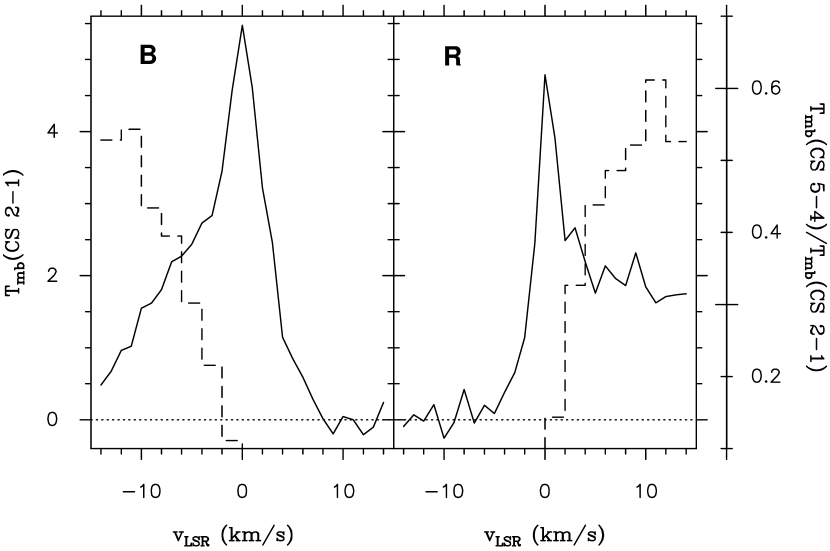
We convolved the CS (=54), CH3OH, and CO maps with a Gaussian to obtain the same resolution as the CS (=21) maps, , and thus, to derive the properties of the shocked material. In Figure 7 we show the spectra of the observed transitions at the CS (=54) peak intensity position of the B and R clumps. The spectra at both positions show a remarkable mirror symmetry in velocity for the CS and the CH3OH transitions. The spectral line profiles for CS (=21), which peak near the ambient cloud velocity and then exhibit a high-velocity blue (B) or red (R) wing, indicate that the accelerated gas contains a mixture of velocities, and that most of the material is moving at low outflow velocities (Tafalla & Bachiller 1995). This mixture of velocities together with the curved shape of the clumps (see Fig. 6) suggest that the gas has been accelerated by a bow-shock, because in such a case, the curvature of the bow-shock produces a variety of shock velocities (e.g. Hartigan, Raymond, & Hartmann 1987). On the other hand, CS (=54) and CH3OH exhibit a similar profile. The lack of emission of these two transitions at ambient velocities at the peak position of the clumps B and R is probably due to a problem of missing flux. Extended emission being filtered out by the interferometer would cause extended absorption. This is suggested by the negative contours seen clearly for ambient velocities in the channel maps of CS (=54) and CH3OH convolved to the same resolution as CS (=21) (not presented here), and by the negative fluxes at ambient velocities (see Fig. 7). Interestingly, the emission in the wings of CS (=54) is roughly constant with velocity, whereas the wings of CS (=21) clearly decrease with the outflow velocity. This probably suggests that the temperature of the high density-gas increases with the outflow velocity, although it could also be due to an increase of the density with the outflow velocity. Figure 8 shows the CS (=21) spectra and the (=54) to (=21) ratio at the position of the B and R clumps. This ratio varies from 0.2 for a of km s-1 to 0.6 for a of km s-1. Assuming optically thin emission, this implies a variation in the excitation temperature from 7 to 12 K, thus the temperature of the gas traced by CS increases with the outflow velocity. These two temperatures should be considered as lower limit: first, the optically thin assumption may not be true, and second, it is possible that the CS (=54) filling factor is smaller than that of the CS (=21). Yet, taking into account that the kinetic temperature measured in the outflow is 20 K (Codella et al. 2001), one would expect much higher kinetic temperatures for the shocked material. Thus, the emission of the shock is subthermalized, and the excitation temperature measured is much lower than the real temperature of the shocked gas.
In order to estimate the CS and CH3OH beam averaged column densities, we assumed optically thin emission and adopted an excitation temperature of 11 K, which is the average value of the CS wings. For CO, the adopted excitation temperature is 20 K (Codella et al. 2001). The column densities of CO, CS, and CH3OH at the peak intensity positions of the B and R clumps are given in Table 5. The fractional abundance of CS and CH3OH with respect to CO at these two positions are shown in Table 6, together with their typical values for other low- and intermediate-mass star-forming regions, and for the quiescent and shocked regions in the low-mass star-forming region L1157. CS and CH3OH show an enhancement of roughly 2 and 3 orders of magnitude, respectively, with respect to the values of typical star-forming regions, and similar to the shocked material in the L1157 molecular outflow.
5 Discussion
5.1 Interaction of the outflow with the dense material
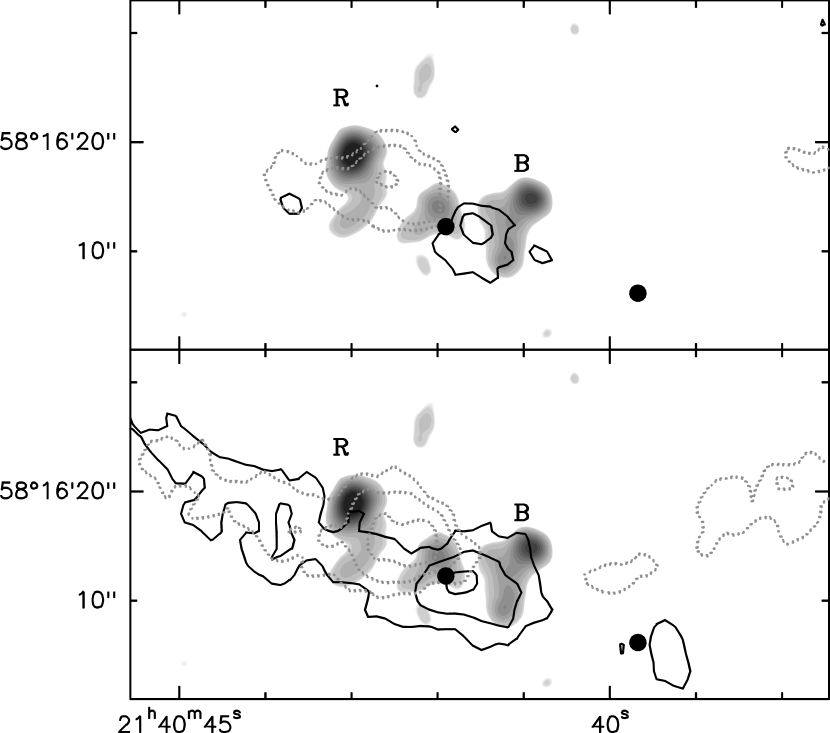
Figure 9 shows the outflow component of CS (=54) overlapping with the moderate and high velocity component of the CO (=10) emission. As can be seen in this figure, the B and R clumps of CS are located immediately ahead of the blueshifted and redshifted CO emission of the high outflow velocity component, which traces a well defined bipolar structure. Further away from the driving source, the molecular outflow is only detected at moderate or low outflow velocities.
Interestingly, the initially well defined bipolarity of the molecular outflow, with a well defined axis, appears more chaotic after its passage through these clumps. First, west of clump B, the outflow is deflected: from the driving source to clump B the molecular outflow emission is blueshifted and has a position angle , whereas further away from clump B the outflow is redshifted and its direction changes significantly, to . Second, the east lobe emission, between the driving source and clump R, is mainly redshifted at moderate and high outflow velocities, whereas further away from clump R the outflow emission is slightly stronger in the blue wing than in the red wing.
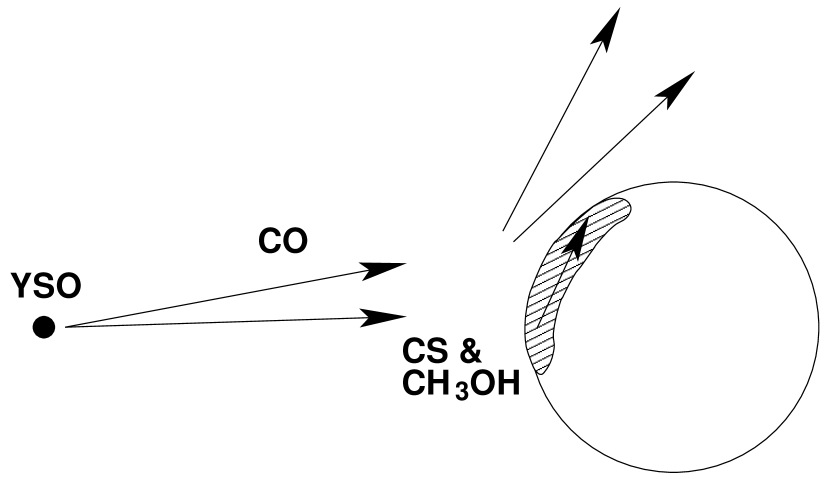
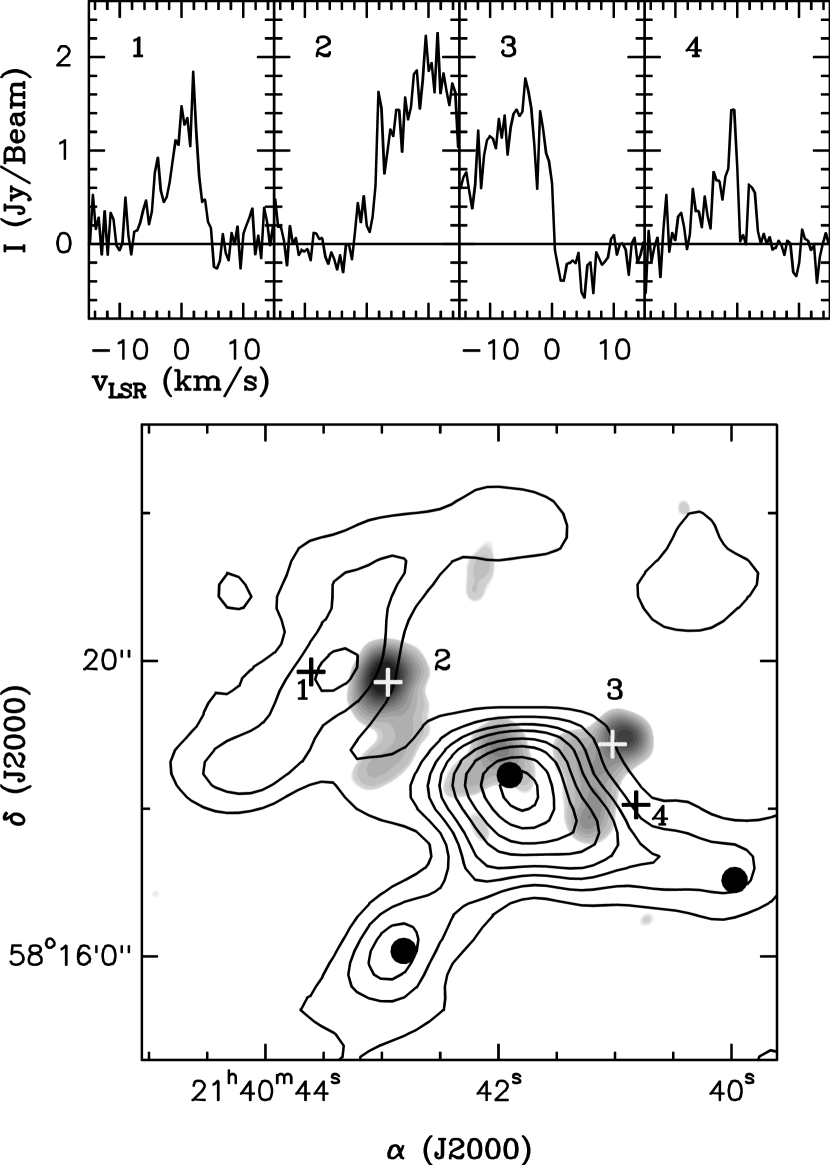
In addition, there is a strong abundance enhancement of CS and CH3OH toward the positions of clumps B and R (see Table 6). This is a clear evidence of strong shocks, where the CS and CH3OH abundances increase from the evaporation or dust sputtering within the shocks. This has been observed in other regions, and in particular in L1157 for these two molecules as well as several others (Mikami et al. 1992; Avery & Chiao 1996; Bachiller & Pérez Gutiérrez 1997; Zhang, Ho, & Wright 2000). These kinematical and chemical evidences strongly suggest that the CS clumps are tracing gas entrained within the surface of interaction between the molecular outflow and the dense ambient quiescent core. In order to trace and map the dense core material that is behind the clumps, higher resolution observations of low excitation molecular lines would be needed. The geometry of the interaction, sketched in Fig. 10, suggests the shocked cloudlet model scenario, where an inverted bow-shock is produced in the windward side of a dense ambient clump (Schwartz 1978; Davis, Dent, & Bell Burnell 1990). Here the bow-shock region is traced by the CS and CH3OH emission (clumps B and R). This scenario is supported by Figure 11, where we superposed the integrated intensity of the CS (=54) emission at ambient velocities, , and the shocked dense gas. As it can be seen in this figure, whereas the spectra at the positions of the B and R clumps are indicative of shocks, the spectra at the other two positions, which are located downstream of the clumps B and R, show a more quiescent shape, with emission peaking at ambient velocities.
5.2 Evolution of intermediate-mass stars
The centimeter and millimeter continuum emission around IRAS 21391+5802 has been resolved into three sources (see Fig. 2 and 3), with different morphologies and properties. Although all the sources seem to be young stellar objects, these differences suggest that they could be in different evolutionary stages. BIMA 2, the source associated with IRAS 21391+5802, has the strongest millimeter emission, and it is also the most massive object in IC 1396N. The source is associated with centimeter continuum emission, water maser emission (Tofani et al. 1995), and it is driving a powerful molecular outflow. Its millimeter emission, which accounts for most of the dust emission in the region, exhibits a very extended component, elongated in a north-south direction, consistent with an envelope surrounding the source. As seen in , the ratio of its intensity peak to its flux density indicates that there is still plenty of material which can be incorporated into the central star. The estimated power-law index of the dust emissivity for BIMA 2, (see ), is consistent with the values found for embedded low- and intermediate-mass objects (Dent et al. 1998; Testi & Sargent 1998; Chini et al. 2001). The circumstellar mass , is also consistent with the masses in the range 3.5–12 found around other intermediate-mass protostars (Fuente et al. 2001; Shepherd & Watson 2002). This mass is also in agreement, although being slightly higher, with the envelope masses of 1.4–2.3 found by Bontemps et al. (1996) for low-mass Class 0 sources. Thus, based on the dust emission results, BIMA 2 seems to have the characteristics of a very young intermediate-mass object. Note that the morphology and properties of the dust emission do not differ significantly from the properties of the low-mass counterpart Class 0 objects.
In order to further compare the properties of BIMA 2 with the low-mass case, we also checked whether this object is consistent with some correlations between source and outflow properties found for low-mass young objects. In particular, we checked for the correlation between the circumstellar envelope mass and the momentum rate in the CO outflow given by Bontemps et al. (1996). To do this, first we corrected the momentum rate for projection and optical depth effects using the same correction factor as Bontemps et al. (1996), by taking , where is the observed momentum rate. We found that BIMA 2 agrees well with this correlation, and, what is more, its position in the diagram is consistent with the source being a Class 0 object, which confirms the classification of BIMA 2 as a very YSO. These authors have also found a correlation between the normalized outflow momentum rate, , and the normalized envelope mass, . For IRAS 21391+5802, there are some bolometric luminosity estimates, –440 (Saraceno et al. 1996; Sugitani et al. 2000). However, these estimates include the whole region around the IRAS coordinates. Thus, in order to derive a bolometric luminosity for BIMA 2, we used the relationship between the momentum rate and the bolometric luminosity given by Cabrit & Bertout (1992), and we inferred a luminosity of . By using this luminosity estimate we found that the source also fits very well the correlation of normalized momentum and envelope mass as found by Bontemps et al. (1996), and BIMA 2 also lies in the Class 0 region of this diagram.
Another correlation fitted well by the source is the one between the radio continuum luminosity at centimeter wavelengths and the momentum rate of the outflow not corrected for inclination obtained by Anglada (1996). This correlation is in agreement with the predictions of a simple model of shock ionization in a plane-parallel geometry (Curiel, Cantó, & Rodríguez 1987; Curiel et al. 1989), which would be able to produce the required ionization in thermal radio jets. Regarding the morphology of the outflow, at low outflow velocities it is very complex and chaotic (see Fig. 4), as also noticed in other intermediate-mass star-forming regions (e.g. NGC 7129: Fuente et al. 2001). However, unlike the NGC 7129 FIRS1 outflow, the collimation of the BIMA 2 outflow is very high, even at low velocities, similar to the low-mass protostellar flow in HH 211 (Gueth & Guilloteau 1999). The complexity of the molecular outflows driven by intermediate-mass protostars is likely a result of the more complex protostellar environment itself. Taking into account that the outflows are usually more energetic for higher mass objects, that the dust emission is often resolved into more than one object, and that these sources are embedded in larger amounts of material, it is to be expected that the interactions between the high-velocity gas and the circumstellar material will be more active and more complex, disrupting and pushing more material. As seen in , the chemistry of the shocked material in the outflow, which shows an enhancement in the abundance of CS and CH3OH, is different from that of the quiescent material in the cloud. Interestingly, the abundances of these species are quite similar for all shocked regions, regardless of whether they are related to intermediate- or low-mass star-forming regions such as L1157 (Bachiller & Pérez Gutiérrez 1997).
BIMA 3 is the other source for which the millimeter continuum emission has been resolved, although only at 1.2 mm. Its emission is more compact than the emission around BIMA 2, and has a deconvolved size of AU, which is still consistent with envelope sizes. The source is associated with centimeter continuum emission and with water maser emission (Tofani et al. 1995). The more compact appearance of the dust emission, together with the fact that the source does not seem to be associated with any molecular outflow suggest that BIMA 3 might be a less massive and/or more evolved object than BIMA 2. On one hand, the circumstellar mass obtained for this source is consistent with the values found for low-mass objects (Bontemps et al. 1996; Motte & André 2001). On the other hand, the evolved stage seems to be confirmed by the spectral index, , obtained at millimeter wavelengths for this source. In order to obtain this value, the millimeter emission would have to be either optically thick, or optically thin with a dust emissivity index . Although the deconvolved size of the emission depends on the angular resolution (see ), the size derived, even the one derived with the highest resolution, is too large to interpret this emission as an optically thick disk-like structure, which would be gravitationally unstable. Typical circumstellar dusty disk radii are on the order of 100 AU for T Tauri stars (e.g. Dutrey et al. 1996), and in the range 100–300 AU for Herbig Ae stars (Mannings & Sargent 1997, 2000; Natta et al. 2000). In addition, such a structure would be excessively massive. Perhaps a more plausible explanation is that the emission is optically thin and . A smaller value of around compact objects has been interpreted as caused by larger grains, indicating grain growth in dense regions (Mannings & Emerson 1994); grain shape evolution or chemical evolution are also possible causes (Ossenkopf & Henning 1994; Pollack et al. 1994).
The third source in the region, BIMA 1, is also associated with centimeter continuum emission, and it is probably the driving source of the collimated N–S bipolar outflow discovered in the region (see ). These observational facts indicate that BIMA 1 is also a YSO, although less massive than BIMA 2. However, due to the fact that its millimeter continuum emission has not been resolved, it is not possible to say too much about its evolutionary stage. The spectral index obtained for this source is , which in the case that the millimeter continuum emission is optically thin would correspond to a low value of , and might be interpreted as grain growth. However, as the deconvolved size of BIMA 1 is AU at 1.2 mm, we cannot rule out the possibility that what we are seeing is an optically thick circumstellar disk (e.g. L1641-N: Chen, Zhao, & Ohashi 1995). Assuming , cm2 g-1 at 3.1 mm, and (Beckwith et al. 1990), we obtain a disk mass for a disk radius of 100 AU. In case the emission is optically thin, the value derived for the circumstellar mass is , a value consistent with a low-mass object.
6 Conclusions
We studied with the VLA and the BIMA arrays the dust and the gas at centimeter and millimeter wavelengths surrounding IRAS 21391+5802, an intermediate-mass source embedded in the core of IC 1396N.
The continuum emission at centimeter and millimeter wavelengths has been resolved into three sources, BIMA 1, BIMA 2, BIMA 3, separated of each other. The strongest source at millimeter wavelengths is BIMA 2, which is most likely the object associated with IRAS 21391+5802, and its dust emission shows a very extended envelope elongated in the N–S and the NE–SW direction at 3.2 mm and 1.3 mm, respectively. The power-law index of the dust emissivity measured from 3.1 to 1.2 mm is for BIMA 2, and its circumstellar mass is . The dust emission around BIMA 1 has not been resolved, and the emission around BIMA 3 has only been resolved at 1.2 mm. The dust emissivity index is for BIMA 1, and for BIMA 3, and the circumstellar mass is for both objects.
The CO emission traces at least two molecular outflows in the region: a stronger E–W outflow centered at the position of BIMA 2, and a collimated, weaker, and smaller outflow elongated along the N–S direction on both sides of BIMA 1. The morphology and kinematics of the E–W outflow are very complex: while at high outflow velocities its morphology is clearly bipolar, at low outflow velocities the blueshifted and redshifted emission are highly overlapping, and the emission is deflected showing a V-shaped morphology. Unlike other outflows driven by intermediate-mass objects, the E–W outflow is highly collimated, and the collimation remains even at low outflow velocities.
The E–W outflow as traced by CS and CH3OH shows two well differentiated and clumpy lobes, with two prominent curved northern blueshifted and redshifted clumps. CS and the CH3OH are strongly enhanced toward the position of these clumps with respect to typical quiescent material abundances in other star-forming regions. The CS (=54) to (=21) ratio at both positions increases from 0.2 for a of km s-1 to 0.6 for a of km s-1, indicating that the excitation temperature of the gas traced by CS increases with the outflow velocity. All these morphological, kinematical and chemical evidences suggest that the clumps are tracing gas entrained within the surface of interaction between the molecular outflow and the dense ambient quiescent core. They also suggest that the morphology of the molecular outflow, which is being deflected toward the north at low outflow velocities, is a result of this interaction.
All the objects in IC 1396N seem to be young stellar objects, but in different evolutionary stages. The youngest one is BIMA 2: its circumstellar mass together with the dust emissivity index, and the fact that the source is driving a molecular outflow are consistent with the source being an embedded intermediate-mass protostar. In addition, the source also fits very well correlations between source and outflow properties for low-mass Class 0 objects given by Bontemps et al. (1996). By using the relationship between the momentum rate and the bolometric luminosity (Cabrit & Bertout 1992), we inferred a bolometric luminosity of for this source. For BIMA 1 and BIMA 3, the small dust emissivity index measured is suggestive of grain growth in dense regions (e.g. Mannings & Emerson 1994). This fact together with the more compact appearance of their dust emission suggest that they are more evolved low-mass objects.
As compared with the low-mass counterparts, the morphology and properties of the dust emission around the intermediate-mass protostar BIMA 2 do not differ significantly. In addition, the properties of the outflow driven by BIMA 2 are also consistent with those of the outflows driven by low-mass young objects (Bontemps et al. 1996). The complexity of the molecular outflow, as compared with the low-mass case, is likely a result of the more complex protostellar environment itself. Interestingly, the properties of the shocked regions are quite similar to the ones related to low-mass star-forming regions. The correlation between its flux density at centimeter wavelengths and the momentum rate in the CO outflow agrees with the one found by Anglada (1996) for thermal radio jets, which can be understood under the shock ionization model of Curiel et al. (1987, 1989).
References
- Adams et al. (1987) Adams, F. C., Lada, C. J., & Shu, F. H. 1987, ApJ, 312, 788
- Alknis (1958) Alknis, A. 1958, Trudy Astrofiz. Lab. Riga, 7, 33
- André et al. (1993) André, P., Ward-Thompson, D., & Barsony, M. 1993, ApJ, 406, 122
- Anglada (1995) Anglada, G. 1995, in Disks, Outflows and Star Formation, eds. S. Lizano & J. M. Torrelles, RevMexAASC, 1, 67
- Anglada (1996) Anglada, G. 1996, in ASP Conf. Ser. 93, Radio Emission from the Stars and the Sun, eds. A. R. Taylor & J. M. Paredes (San Francisco: ASP), 3
- Anglada et al. (1998) Anglada, G., Villuendas, E., Estalella, R., Beltrán, M. T., Rodríguez, L. F., Torrelles, J. M., & Curiel, S. 1998, AJ, 116, 2953
- Avery & Chiao (1996) Avery, L. W., & Chiao, M. 1996, ApJ, 463, 642
- Bachiller & Pérez Gutiérrez (1997) Bachiller, R., & Pérez Gutiérrez, M. 1997, ApJ, 487, L93
- Beckwith et al. (1990) Beckwith, S. V. W., Sargent, A. I., Chini, R. S., & Güsten, R. 1990, AJ, 99, 924
- Beltrán et al. (2001) Beltrán, M. T., Estalella, R., Anglada, G., Rodríguez, L. F., & Torrelles, J. M. 2001, AJ, 121, 1556
- Blake et al. (1994) Blake, G. A., van Dishoeck, E. F., Jansen, D. J., Groesbeck, T. D., & Mundy, L. G. 1994, ApJ, 428, 680
- Bontemps et al. (1996) Bontemps, S., André, P., Terebey, S, & Cabrit, S. 1996, A&A, 311, 858
- Briggs (1995) Briggs, D. 1995, Ph.D. thesis, New Mexico Institute of Mining and Technology
- Cabrit & Bertout (1992) Cabrit, S., & Bertout, C. 1992, A&A, 261, 274
- Cesaroni et al. (1999) Cesaroni, R., Felli, M., & Walmsley, C. M. 1999, A&AS, 136, 333
- Chen et al. (1992) Chen, H., Fukui, Y., & Yang, J. 1992, ApJ, 398, 544
- Chen et al. (1995) Chen, H., Zhao, J.-H., & Ohashi, N. 1995, ApJ, 450, L71
- Chini et al. (2001) Chini, R., Ward-Thompson, D., Kirk, J. M., Nielbock, M., Reipurth, B., & Sievers, A. 2001, A&A, 369, 155
- Codella et al. (2001) Codella, C., Bachiller, R., Nisini, B., Saraceno, P., & Testi, L. 2001, A&A, 376, 271
- Condon et al. (1998) Condon, J. J., Cotton, W. D., Greisen, E. W., Yin, Q. F. Perley, R. A., Taylor, G. B., & Broderick, J. J. 1998, AJ, 115, 1693
- Correia (2000) Correia, J. C. 2000, Ph.D. thesis, Queen Mary and Westfield College, University of London
- Curiel et al. (1987) Curiel, S., Cantó, J., & Rodríguez, L. F. 1987, RevMexAA, 14, 595
- Curiel et al. (1989) Curiel, S., Rodríguez, L. F., Cantó, J., Bohigas, J., Roth, M., & Torrelles, J. M. 1989, Ap. Letters & Comm., 27, 299
- Davis et al. (1990) Davis, C. J., Dent, W. R. F., & Burnell, S. J. B. 1990, MNRAS, 244, 173
- Dent et al. (1998) Dent, W. R. F., Matthews, H. E., Ward-Thompson, D. 1998, MNRAS, 301, 1049
- Dutrey et al. (1996) Dutrey, A., Guilloteau, G., Duvert, G., Prato, L., Simon, M., Schuster, K., & Ménard, F. 1996, A&A, 309, 493
- Felli et al. (1992) Felli, M., Palagi, F., & Tofani, G. 1992, A&A, 255, 293
- Fuente et al. (2001) Fuente, A., Neri, R., Martín-Pintado, J., Bachiller, R., Rodríguez-Franco, A., & Palla, F. 2001, A&A, 366, 873
- Gueth & Guilloteau (1999) Gueth, F. & Guilloteau, S. 1999, A&A, 343, 571
- Gueth, Schilke, & McCaughrean (2001) Gueth, F., Schilke, P., & McCaughrean, M. J. 2001, A&A, 375, 1018
- Guilloteau & Dutrey (1998) Guilloteau, S., & Dutrey, A. 1998, A&A, 339, 467
- Hartigan et al. (1987) Hartigan, P., Raymond, J., & Hartmann, L. 1987, ApJ, 316, 323
- Hildebrand (1983) Hildebrand, R. H. 1983, QJRAS, 24, 267
- Hogerheijde & Sandell (2000) Hogerheijde, M. R., & Sandell, G. 2000, ApJ, 534, 880
- Lada (1985) Lada, C. J. 1985, ARA&A, 23, 267
- Looney et al. (2000) Looney, L. W., Mundy, L. G., Welch, W. J. 2000, ApJ, 529, 477
- Mannings & Emerson (1994) Mannings, V., & Emerson, J. P. 1994, MNRAS, 267, 361
- Mannings & Sargent (1997) Mannings, V., & Sargent, A. I. 1997, ApJ, 490, 792
- Mannings & Sargent (2000) Mannings, V., & Sargent, A. I. 2000, ApJ, 529, 391
- Matthews (1979) Matthews, T. J. 1979, A&A, 75, 345
- McMullin et al. (1994) McMullin, J. P., Mundy, L. G., & Blake, G. A. 1994, ApJ, 437, 305
- Mikami et al. (1992) Mikami, H., Umemoto, T., Yamamoto, S., & Saito, S. 1992, ApJ, 392, L87
- Motte & André (2001) Motte, F., & André, P. 2001, A&A, 365, 440
- Natta et al. (2000) Natta, A., Grinin, V. P., & Mannings, V. 2000, in Protostars and Planets IV, eds. V. Mannings, A. Boss, & S. S. Russell (Tucson: University of Arizona Press), 559
- Natta et al. (2001) Natta, A., Prusti, T., Neri, R., Wooden, D., Grinin, V. P., & Mannings, V. 2001, A&A, 371, 186
- Nisini et al. (2001) Nisini, B., Massi, F., Vitali, F., Giannini, T., Lorenzetti, D., Di Paola, A., Codella, C., D’Alessio, F., & Speziali, R. 2001, A&A, 376, 553
- Ohashi et al. (1996) Ohashi, N., Hayashi, M., Kawabe, R., & Ishiguro, M. 1996, ApJ, 466, 317
- Ohashi et al. (1991) Ohashi, N., Kawabe, R., Ishiguro, M., & Hayashi, M. 1991, AJ, 102, 205
- Ossenkopf & Henning (1994) Ossenkopf, V., & Henning, T. 1994, A&A, 291, 943
- Patel et al. (1995) Patel, N. A., Goldsmith, P. F., Snell, R. L., Hezel, T., & Xie, T. 1995, ApJ, 447, 721
- Patel et al. (2000) Patel, N. A., Greenhill, L. J., Herrnstein, J., Zhang, Q., Moran, J., Ho, P. T. P., & Goldsmith, P. F. 2000, ApJ, 538, 268
- Pollack et al. (1994) Pollack, J. B., Hollenback, D., Beckwith, S. W. V., Simonelli, D. P., Roush, T., & Fong, W. 1994, ApJ, 421, 615
- Saraceno et al. (1996) Saraceno, P., Ceccarelli, C., Clegg, P., et al. 1996, A&A, 315, L293
- Sault et al. (1995) Sault, R. J., Teuben, P. J., & Wright, M. C. H. 1995, in ASP Conf. Ser. 77, Astronomical Data Analysis Software and Systems IV, ed. R. A. Shaw, H. E. Payne, & J. J. E. Hayes (San Francisco: ASP), 433
- Schwartz (1978) Schwartz, R. D. 1978, ApJ, 223, 884
- Scoville et al. (1986) Scoville, N. Z., Sargent, A. I., Sanders, D. B., Claussen, M. J., Masson, C. R., Lo, K. Y., & Phillips, T. G. 1986, ApJ, 303, 416
- Serabyn et al. (1993) Serabyn, E., Güsten, R., & Mundy, L. 1993, ApJ, 404, 247
- Shepherd & Watson (2002) Shepherd, D. S., & Watson, A. M. 2002, ApJ, 566, 1
- Shu et al. (1987) Shu, F. H., Adams, F. C., & Lizano, S. 1987, ARA&A, 25, 23
- Sugitani et al. (1989) Sugitani, K., Fukui, Y., Mizuno, A., & Ohashi, N. 1989, ApJ, 342, L87
- Sugitani et al. (1991) Sugitani, K., Fukui, Y., Ogura, K. 1991, ApJS, 77, 59
- Sugitani et al. (2000) Sugitani, K., Matsuo, H., Nakano, M., Tamura, M., & Ogura, K. 2000, AJ, 119, 323
- Tafalla & Bachiller (1995) Tafalla, M., & Bachiller, R. 1995, ApJ, 443, L37
- Testi & Sargent (1998) Testi, L., & Sargent, A. I. 1998, ApJ, 508, L91
- Tofani et al. (1995) Tofani, G., Felli, M., Taylor, G., & Hunter, T. 1995., A&A, 112, 299
- van Dishoeck et al. (1995) van Dishoeck, E. F., Blake, G. A., Jansen, D. J., & Groesbeck, T. D. 1995, ApJ, 447, 760
- Wilking et al. (1989) Wilking, B., Mundy, L., Blackwell, J. H., & Howe, J. E. 1989, ApJ, 345, 257
- Wilking et al. (1993) Wilking, B., Mundy, L., McMullin, J., Hezel, T., & Keene, J. 1993, AJ, 106, 250
- Zhang et al. (2000) Zhang, Q., Ho, P. T. P., & Wright, M. C. H. 2000, AJ, 119, 1345
Figure captions
VLA natural-weight map of the 3.6 cm emission (solid contours) overlaid with an optical image from the Digitized Sky Survey 2 (grey levels). The resulting synthesized beam, shown in the upper right corner, is with . The contour levels are , , -4, 4, 7, 10, 20, 40, 70, 110, and 130 times the rms of the map, .
VLA uniform-weight map at 3.6 cm. The synthesized beam, with , is shown in the upper right corner. The contour levels are , 3, 6, 9, and 12 times the rms of the map, Jy beam-1. The error ellipse of IRAS 21391+5802 is indicated. Plus signs correspond to near infrared sources of Wilking et al. (1993).
BIMA map of the 3.1 mm (top panel), and the 1.2 mm (bottom panel) continuum emission toward the core of IC 1396N. The synthesized beam is with for the 3.1 mm map, and with for the 1.2 mm map. The contour levels are , 3, 6, 9, 12, 15, 20, 25, 30, and 40 times for the 3.1 mm map, and for the 1.2 mm map. The error ellipse of IRAS 21391+5802 is indicated. Crosses show the positions of the 3.6 cm sources (this paper).
CO (=10) emission integrated in different velocity intervals, (top panel), (middle panel), and (bottom panel). The thick contours depict the blueshifted integrated emission with respect to the systemic velocity, and the thin contours the redshifted emission. The synthesized beam, with , is shown in the lower left corner. The black dots show the positions of the 3.1 mm sources (this paper). The contours are 3, 5, 10, and 15 times , , and .
CS (=21) emission integrated in different velocity intervals, (top panel), (middle panel), and (bottom panel). The thick contours depict the blueshifted integrated emission with respect to the systemic velocity, and the thin contours the redshifted emission. The synthesized beam, with , is shown in the lower left corner. The symbols are as in Fig. 4. The contours are 3, 5, 10, and 15 times .
Integrated intensity of the CS (=21) emission (top panel) in a velocity interval , and a synthesized beam of with P.A.=, CS (=54) emission (middle panel) in a velocity interval , and a synthesized beam of with P.A.=, and CH3OH (=54) emission (bottom panel) in a velocity interval , and a synthesized beam of with P.A.=. The synthesized beam is shown in the lower left corner. The thick contours depict the blueshifted integrated emission with respect to the systemic velocity, and the thin contours the redshifted emission. The symbols are as in Fig. 4. The contours are 3, 5, 10, 15, and 20 times , , and .
Spectra of the molecules observed taken at the CS (=54) peak intensity position of the clumps B (left panels) and R (right panels).
CS (=21) spectrum (solid line) versus the (=54) to (=21) ratio (dashed line) at the position of the B (left panel) and R (right panel) clumps. The enhancement of the lines ratio with outflow velocity is not seen away from these strongly shocked regions.
Overlap of the shocked dense gas traced by the CS (=54) line (grey scale) and the molecular outflow traced by the CO (=10) line (solid and dashed contours for the blueshifted and redshifted emission), at high (top panel) and intermediate (bottom panel) outflow velocities. CO and CS maps are the same as those on Fig. 4 and 6 respectively.
Sketch showing the geometry of the interaction of the CO outflow with the dense material, which is traced by CS and CH3OH.
Superposition of the integrated intensity of the CS (=54) emission over the velocity interval (contours), and the shocked dense gas (grey scale). The contours of the ambient gas emission are 3, 6, 9, 12, 16, 20, 25, and 30 times 0.12 . The black dots show the positions of the 3.1 mm sources (this paper). The crosses indicate the positions where the spectra (top panel) have been taken.
| BL LacaaPhase calibrator. | Spectral | ||||||||
|---|---|---|---|---|---|---|---|---|---|
| Flux | Synthesized Beam | Bandwidth | resolution | TsysbbRange of system temperatures during the observations. | |||||
| Epoch | Config. | Observation | (GHz) | (Jy) | HPBW | P.A. | (MHz) | (km s-1) | (K) |
| 2000 May 12 | C | continuum | 96.25 | 3.8 | 1200 | 160–500 | |||
| CS 2–1 | 97.9810 | 25 | 0.30 | ||||||
| 2000 Mar 04 | B | continuum | 112.2 | 4.8 | 725 | 400–980 | |||
| CO 1–0 | 115.2712 | 25 | 0.51 | ||||||
| 2000 Apr 05 | C | continuum | 112.2 | 3.1 | 725 | 350–930 | |||
| CO 1–0 | 115.2712 | 25 | 0.51 | ||||||
| 2000 Nov 17 | C | continuum | 243.3 | 1.8 | 1200 | 500–1200 | |||
| CH3OH 5-1–4-1 | 241.7672 | 25 | 0.12 | ||||||
| CS 5–4 | 244.9356 | 25 | 0.12 | ||||||
| 2001 Jan 28 | B | continuum | 243.3 | 1.9 | 1200 | 270–550 | |||
| CH3OH 5-1–4-1 | 241.7672 | 25 | 0.12 | ||||||
| CS 5–4 | 244.9356 | 25 | 0.12 | ||||||
| Integrated Flux | Integrated Flux | |||||
|---|---|---|---|---|---|---|
| PositionaaTypical uncertainty in position is . | Density at 3.6 cmbbCorrected for primary beam response. | Density at 21 cmccFrom the NRAO VLA Sky Survey (Condon et al. 1998). | Spectral | |||
| Source | (mJy) | (mJy) | IndexddSpectral index between 21 and 3.6 cm. | Identification | ||
| (1) | eeUpper limit for non-detected sources is 4. | BIMA 1 | ||||
| (2) | eeUpper limit for non-detected sources is 4. | IRAS 21391+5802, BIMA 2 | ||||
| (3) | eeUpper limit for non-detected sources is 4. | BIMA 3 | ||||
| (4) | ||||||
| (5) | ||||||
| Extended | ||||||
| emission | ffFlux density integrated inside a box of with center given in the position columns. Errors are calculated as , where is the box to beam areas ratio (see Beltrán et al. 2001). | ffFlux density integrated inside a box of with center given in the position columns. Errors are calculated as , where is the box to beam areas ratio (see Beltrán et al. 2001). | BRC 38 | |||
| (J2000)aaPosition reported is the measured at 3.1 mm. Typical uncertainty in position is . | (J2000)aaPosition reported is the measured at 3.1 mm. Typical uncertainty in position is . | bbPeak intensity. The uncertainty in the values of the flux density is . | ccIntegrated flux density, corrected for primary beam response. The uncertainty in the values of the flux density is . | Source sizeddDeconvolved size and P.A. obtained by fitting an elliptical Gaussian. | MassffTotal (gas+dust) circumstellar mass, obtained assuming a dust temperature of 25 K (see ). | |||||
|---|---|---|---|---|---|---|---|---|---|---|
| Source | (h m s) | ( ′ ′′) | (mm) | (mJy beam-1) | (mJy) | () | (AU) | P.A. | eeSpectral index between 3.1 and 1.2 mm. | () |
| BIMA 1 | 21 40 39.97 | 58 16 05.2 | 3.1 | ggSource not resolved. | ggSource not resolved. | ggSource not resolved. | 0.07 | |||
| 1.2 | hhUpper limit for non-detected sources is . | hhUpper limit for non-detected sources is . | ggSource not resolved. | ggSource not resolved. | ggSource not resolved. | |||||
| BIMA 2 | 21 40 41.79 | 58 16 12.4 | 3.1 | 5.1 | ||||||
| 1.2 | iiPeak intensity inside the beam obtained by combining the C and the B configurations, at P.A.= . | |||||||||
| BIMA 3 | 21 40 42.81 | 58 16 00.4 | 3.1 | ggSource not resolved. | ggSource not resolved. | ggSource not resolved. | 0.07 | |||
| 1.2 | iiPeak intensity inside the beam obtained by combining the C and the B configurations, at P.A.= . | |||||||||
| aa Range of outflow velocities with respect to the local standard of rest (LSR). Momenta and kinetic energies are calculated relative to the cloud velocity, which is taken to be km s-1. | bb The excitation temperature is 20 K. The molecular mass was estimated following Scoville et al. (1986). | cc The inclination angle with respect to the plane of the sky assumed to measure the momenta and kinetic energies is . The CO momentum, the kinetic energy, and the momentum rate in the outflow were estimated following Lada (1985). | cc The inclination angle with respect to the plane of the sky assumed to measure the momenta and kinetic energies is . The CO momentum, the kinetic energy, and the momentum rate in the outflow were estimated following Lada (1985). | cc The inclination angle with respect to the plane of the sky assumed to measure the momenta and kinetic energies is . The CO momentum, the kinetic energy, and the momentum rate in the outflow were estimated following Lada (1985). | |
|---|---|---|---|---|---|
| Lobe | (km s-1) | () | ( km s-1) | ( erg) | ( yr-1) |
| E–W OUTFLOW | |||||
| Blue | [] | 7.2 | 1.8 | 5.7 | |
| Red | [] | 6.4 | 1.8 | 6.3 | |
| Total | 13.6 | 3.6 | 12.0 | ||
| N–S OUTFLOW | |||||
| Blue | [] | 0.7 | 0.1 | 0.2 | |
| Red | [] | 0.5 | 0.1 | 0.2 | |
| Total | 1.2 | 0.2 | 0.4 |
| (CO) | (CS) | (CH3OH) | |
|---|---|---|---|
| Position | (cm-2) | (cm-2) | (cm-2) |
| B | |||
| R |
| IRAS 21391+5802 | L1157ccBachiller & Pérez Gutiérrez (1997). | |||||
|---|---|---|---|---|---|---|
| Molecule | Clump B | Clump R | IRAS 16932422aaBlake et al. (1994); van Dishoeck et al. (1995). | L1641-NbbMcMullin et al. (1994). | Cloud | Outflow |
| CS | ||||||
| CH3OH | ||||||