Heavy Element Abundances and Dust Depletions
in the Host Galaxies of Three Gamma–Ray Bursts
Abstract
We have derived the column densities of heavy elements in three gamma–ray burst (GRB) optical transients, associated with the circumburst or interstellar medium (ISM) of the host galaxy. In comparison with the same elements observed in damped Lyman– (DLA) systems along QSO sight lines, we find evidence for much higher column densities of Zn II. The gap between the QSO–DLA and GRB–DLA distributions is smoothly bridged by observations of the interstellar absorption in the Milky Way and the Magellanic Clouds. Very small [Fe/Zn], [Si/Zn], and [Cr/Zn] values in GRB–DLAs indicate large dust depletions. Once the dust–to–metals ratios are determined, we find an optical extinction mags, to be compared with typical in most QSO–DLAs. Our inference of high dust content appears to be in contradiction with the typical low reddening previously found in GRBs. One possible way to reconcile is a dust grain–size distribution biased towards big grains, which would give a grey extinction. Possibly the small dust grains have been destroyed by the GRBs themselves. Our findings support the idea that primarily optically selected QSOs probe mainly low gas/dust regions of high redshift galaxies, while the more powerful GRBs can be detected through denser regions of their ISM (molecular clouds and star forming regions). Therefore GRB–DLAs and QSO–DLAs together provide a more complete picture of the global properties of the interstellar medium in high redshift galaxies.
1 INTRODUCTION
Gamma–ray bursts (GRBs) are among the most dramatic events in the Universe. Their luminosities are so high ( ergs are emitted in a few seconds) that they can be seen at the highest redshifts. However, since the decline in their energy emission is very fast, the investigation and understanding of their physical nature is is not particularly easy (Piran 2001). For instance, the redshift of the afterglow or host galaxy has been measured in only 24 cases111see http://www.mpe.mpg.de/jcg/grbgen.html for the complete list of GRB redshifts.
Only eight of these objects have been targeted quickly enough by ground–based telescopes to obtain low resolution spectra of the optical transient, and all show a common peculiarity: very strong UV absorption lines of low ionization species (Fiore 2001; Fynbo et al. 2002). This is similar to what is seen in damped Lyman– systems (DLAs) associated with intervening galaxies along QSO sight lines. GRB–DLAs are certainly an unexplored and important source of information on the circumburst and/or interstellar medium (ISM) of the GRB host galaxy. Here we explore in more detail their properties and compare them with those of QSO–DLA galaxies.
We use the curve of growth (COG) analysis to derive column densities of low ionization species in several GRB–DLAs. As for QSO–DLAs, we neglect ionization effects to derive the abundances of several heavy elements. The low ionization of the gas is warranted by the large equivalent widths of the low ionization lines, and the low equivalent widths of the moderate and high ionization lines. The difference in abundances between weakly and greatly dust depleted elements provides an estimate of the dust content.
The COG analysis was applied to QSO–DLAs (Blades et al. 1982; Turnshek et al. 1989) before the advent of high resolution spectroscopy, which allows a direct fitting of individual absorption lines. Since GRB emission fades very rapidly, high resolution (FWHM km s-1) spectra of GRB afterglows are very hard to obtain.
In this work, we interpret strong differences between GRB–DLAs and QSO–DLAs as the result of the difference in the densities of the intervening gas. Since GRBs are, at least for some time, brighter than primarily optically selected QSOs, they can be observed even if their sight lines cross very dense and dusty regions, such as molecular clouds, where extinction is very severe. On the other hand, QSO sight lines are easier to detect when intersecting less dusty interstellar clouds.
This bias in QSO–DLAs has been already suggested in the past (see, for instance, Fall & Pei 1993; Boissé et al. 1998). More recently, Ellison et al. (2001) have studied a small sample of radio–selected QSOs and tentatively found more DLAs than in optically selected QSOs. Even if this result is affected by small number statistics (significant at level), it supports the idea of dust obscuration in optically selected QSO–DLAs.
Our analysis is alternative to and independent of the dust content estimate obtained so far for GRBs. The dust reddening in GRB afterglows has been derived in several objects (see for instance Reichart 1998; Jensen et al. 2001; Rhoads & Fruchter 2001; Fynbo et al. 2001; Galama & Wijers 2001) and in most cases it has been found to be small or negligible. The method applied assumes initial power law emission from the GRBs, and steep extinction curves such as those in the Milky Way (MW) or Large & Small Magellanic Clouds (MC). Possible discrepancies with the results of our analysis challenge the two initial assumptions of very steep extinction and initial power law emission of the central source.
For this study, we examine the absorption lines of three of the eight GRBs with UV rest frame spectra, namely GRB990123 (, Kulkarni et al. 1999), GRB010222 (, Masetti et al. 2001; Jha et al. 2001; Salamanca et al. 2001; Mirabal et al. 2002), and GRB000926 (, Castro et al. 2001). We exclude GRB970508 (, Metzger et al. 1997), GRB990510 (, Vreeswijk et al. 2001) GRB000301C (, Jensen et al. 2001), GRB990712 (, Vreeswijk et al. 2001), and GRB011211 (Holland et al. 2002) for poor quality of the spectra and therefore lack of interesting absorption features.
2 GRB–DLAs COLUMN DENSITY DETERMINATION
Similarly to QSO–DLAs, GRB–DLAs show strong Fe II, Mg II, and Si II absorptions, together with relatively weak Zn II and Cr II. Table 1 lists oscillator strengths (from the recent compilation by Prochaska et al. 2001) and rest frame equivalent widths of absorption lines in the three GRBs used in the present analysis. The large of all these species relative to higher ionization species like C IV, Si III and Si IV, indicate that the medium is weakly ionized. From the equivalent widths (EWs), we derive column densities and directly compare the results with typical column densities in QSO–DLAs. Comparing column densities instead of metallicities [X/H] has the advantage that the H I column density (known only in GRB000926 with large uncertainty; Fynbo et al. 2002) is not required. Moreover, it is not necessary to make any assumptions about the dust depletion, cosmic abundance or ionization level of the considered element, but we can still search for similarities and differences between GRB–DLAs and QSO–DLAs.
A direct comparison is complicated by the fact that normally QSO–DLAs are observed at high spectral resolution (FWHM km s-1) in a large wavelength range (thanks to echelle spectroscopy), allowing a good determination of column densities of many ions, even in cases where saturated or weak lines in complex features are detected (see for instance Lu et al. 1996; Pettini et al. 1997; Prochaska & Wolfe 1999). On the other hand, the typical resolution of GRB optical spectra is FWHM km s-1. Moreover, the majority of absorption lines are saturated, and it is not possible to use the linear part of the COG to determine column densities. However, the lines are numerous and so, even if the uncertainty may be large, it is possible to make an abundance analysis using the general COG analysis (Spitzer 1978). Since the typical resolution of GRB spectra does not allow the separation of the different components of a complex feature, due to the many clouds along the line of sight, in our analysis we adopt a large “effective” Doppler parameter, being the result of the superposition of many narrow absorption lines. For reference, we note that typical velocities in QSO–DLAs are km s-1 or more. The COG analysis applied with the single component approximation was used for QSO–DLA studies before high resolution spectroscopy of QSOs became possible (see for instance Blades et al. 1982; Turnshek et al. 1989). In fact, Jenkins (1986) showed that the COG technique applied to complex features gives nearly the correct answer (the simulated–to–true column density ratio rarely goes below 0.8) even if different lines have very different saturation levels or Doppler parameters. This general result is also confirmed by Savage & Sembach (1991).
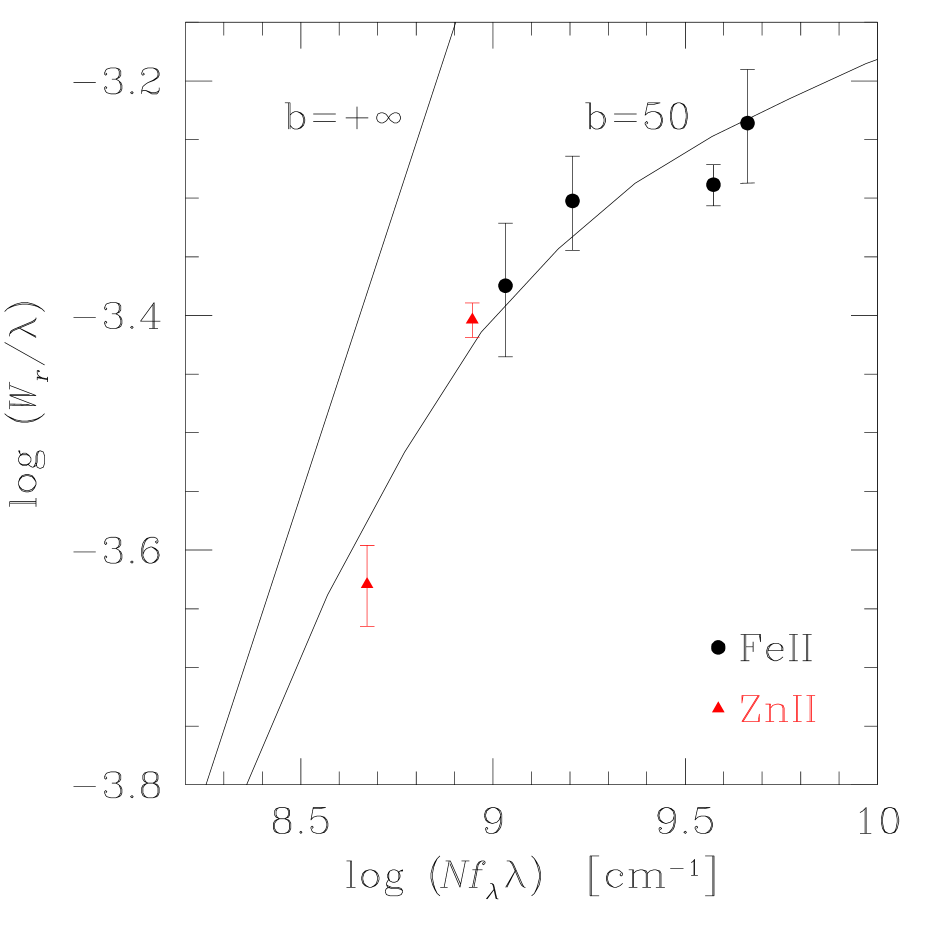
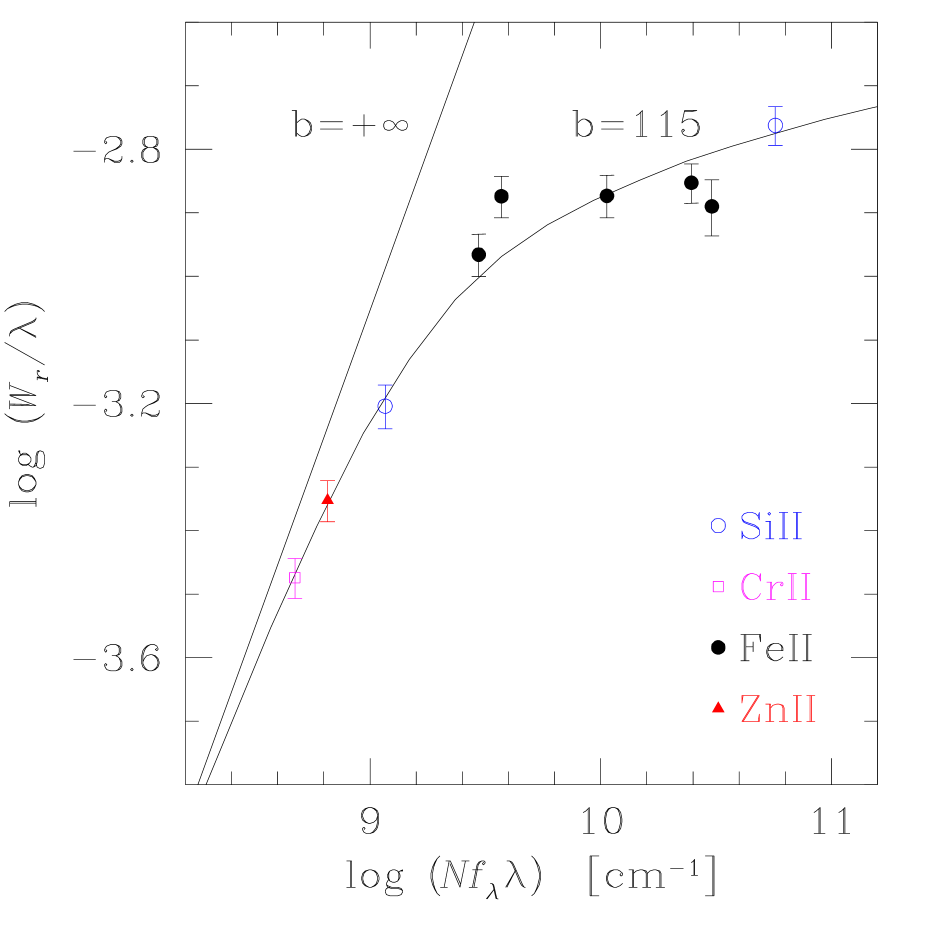
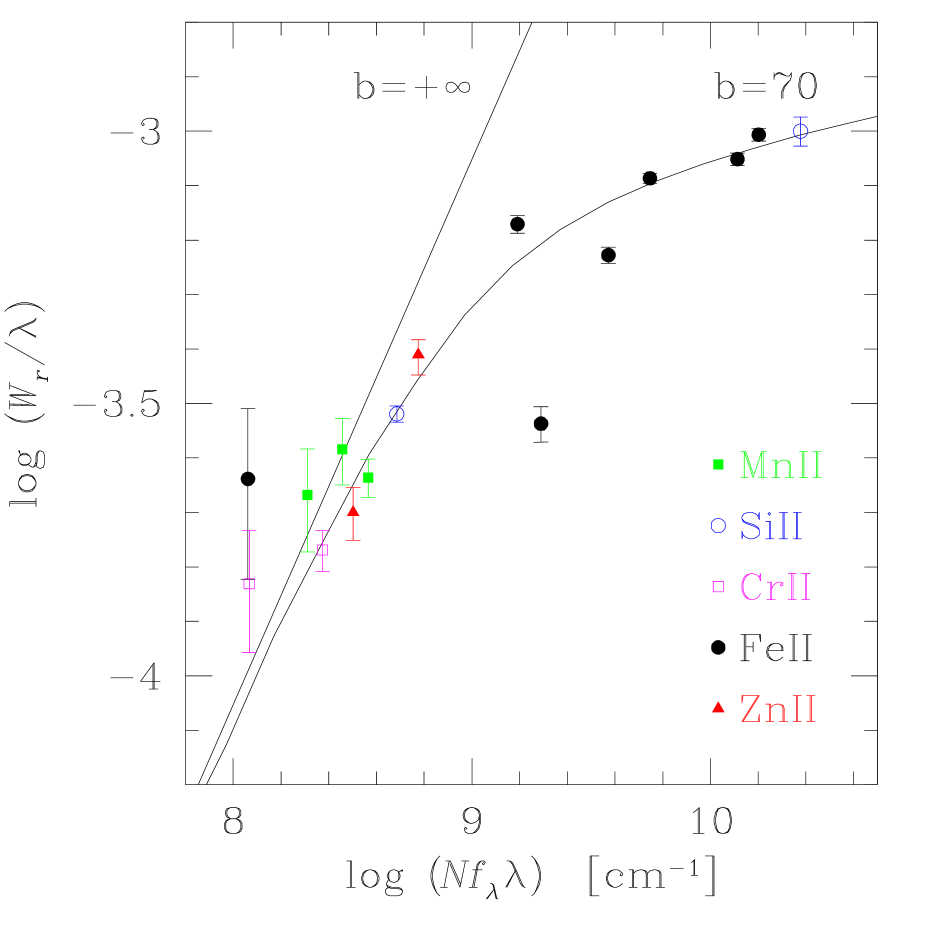
The best–fitting column density is determined by using simultaneously different EWs of various ions and choosing the COG with an effective Doppler parameter that minimizes the . Once the best effective Doppler parameter is determined, the error on the column density for each ion is determined by varying for which . In the following § 2.1–2.3, we discuss column density measurements in each individual GRB. Figures 1–3 show the best–fitting and column densities, and the corresponding COG. Estimated column densities are given in Table 2.
2.1 GRB990123
The optical transient of GRB990123 at was observed with the Keck/LRIS (Kulkarni et al. 1999) for a final resolution and signal–to–noise ratio of FWHM Å ( km s-1) and S/N , respectively. The very weak Fe II EW gives inconsistent results with other Fe II lines, and thus this detection has not been considered in our analysis. Fe II is not reliable because it is probably partly blended with the Fe II 2382 line.
For the four remaining Fe II lines, we get a best–fit of Fe II and km s-1(Figure 1). From the EW of Zn II and considering km s-1, we derive a Zn II column density of Zn II, and calculate a Zn II contribution to the Zn II + Cr II blend of Å, to be compared with the detected Å. This means that the contribution of the Cr II line to the blend is negligible or non existing. Therefore we recalculate the Zn II column density from the Zn II and Zn II doublet, from which we derive Zn II
2.2 GRB000926
GRB000926 at was observed with the Keck/ESI echelle spectrograph (Castro et al. 2001), with a good signal–to–noise ratio (S/N ) and relatively high resolution (FWHM km s-1). Castro et al. (2001) also show a low resolution spectrum, with EW measurements that are systematically larger than those obtained from the high resolution spectrum, but the authors claim that the high resolution measurements are more accurate, so we only use these. The spectrum shows at least two absorbing clouds separated by 168 km s-1. In our analysis, we consider the total equivalent widths of the two components together, since the resolution does not allow them to be clearly separated.
The observed Si II and Si II lines, and the five detected Fe II lines give Si II and Fe II, respectively ( km s-1, Figure 2). If we assume km s-1, we get Cr II from the Cr II EW. This corresponds to Å and Å for Cr II and Cr II , respectively. Neither of these measurements is consistent with those observed ( Å and Å, respectively); this might indicate a contamination of the Cr II line by an unidentified absorption associated with an intervening metal system. Moreover, the Cr II is probably corrupted by a noise spike in the spectrum (see Figure 3 of Castro et al. 2001) probably due to a remnant of the strong sky line at Å. The same contamination might also effect the Zn II line (the EW is inconsistently lower than expected from Zn II ), therefore the Zn column density is determined from Zn II only: Zn II for km s-1. The lack of Fe II detection is puzzling. If, for instance, we assume Fe II Å (way above the detection limit in the spectrum), the line is almost unsaturated, and Fe II for km s-1, inconsistent with what is found from the other Fe II lines.
Fynbo et al. (2001) report a tentative H I column density measurement of H I cm-2. This leads to a relatively high metallicity with [Zn/H] .
2.3 GRB010222
The optical transient of GRB010222 at was observed with the FLWO 1.5m telescope (Jha et al. 2001; FWHM Å or km s-1, S/N ), with the 3.58m TNG (Masetti et al. 2001; FWHM Å or km s-1, S/N ), with the 4.2m WHT (Salamanca et al. 2001; FWHM Å or km s-1, S/N ), and with Keck/LRIS and ESI (Mirabal et al. 2002; FWHM Å or km s-1, and FWHM Å or km s-1). Even though the different spectra span a time interval of hours, starting 5 hours after the burst, the absorption line equivalent widths do not show significant time variability (Mirabal et al. 2002). Therefore, to obtain a better estimate of column densities, we combined the EWs of the same lines from different observations weighted according to the errors. We constrain the effective Doppler parameter to km s-1, using the Si II and Si II lines, and seven Fe II lines (Figure 3). We get Si II and Fe II. The Fe II lines are scattered in the COG diagram, probably because of non–uniform EW measurements by the four groups.
The Zn II line at Å is blended with the Mg I line. The contamination of Mg I to this doublet is estimated using the Mg I line at Å and Mg I Å. Assuming an effective Doppler parameter km s-1, we get Mg I and Mg I Å. We then assume that the feature at Å is dominated by the Zn II absorption, with Å and the lower error determined by a possible contamination from Mg I .
The Cr II EW is very low, therefore it must be weakly or not at all saturated. From Cr II and Cr II lines, we get Cr II. From this, we calculate a contribution of Cr II to the Zn II + Cr II doublet of Cr II Å. For this doublet we only use the measurements given by Jha et al., Salamanca et al. and Mirabal et al. (weighted mean Å), because the spectrum by Masetti et al. shows strong blending with other absorption lines. Once the Cr II contribution is taken into account, we derived Zn II Å. Using also the Zn II detection, we obtain Zn II for km s-1. The Mn II column density is obtained from the Mn II triplet. For km s-1, we get Mn II.
3 HEAVY ELEMENT ABUNDANCES IN GRB–DLAs
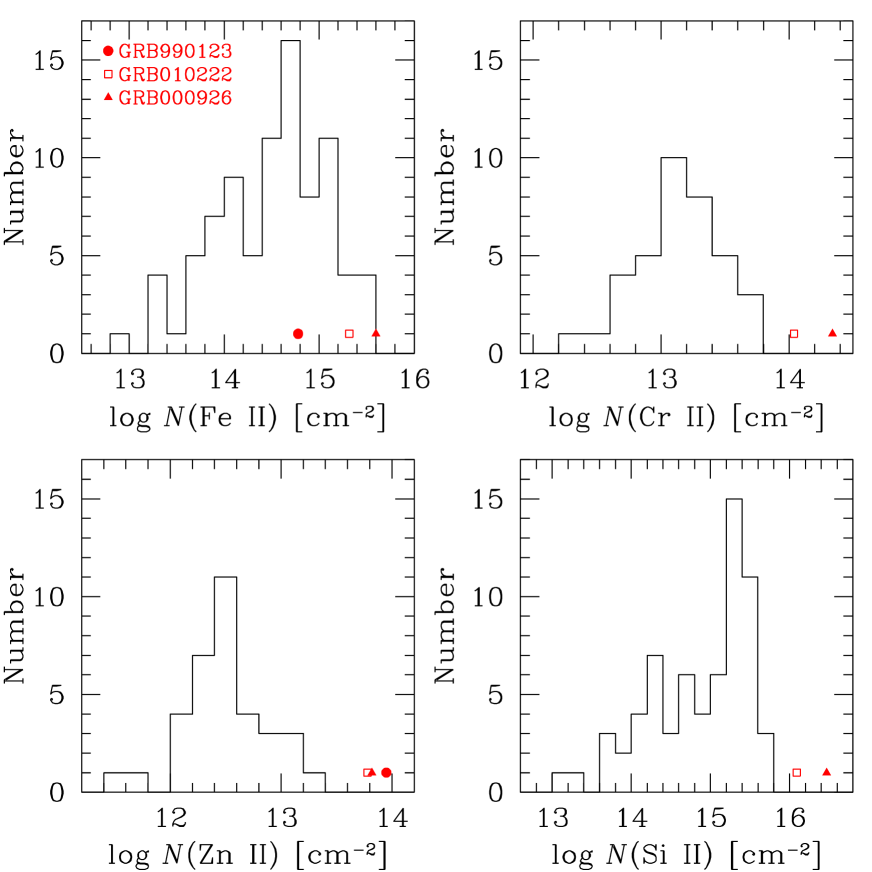
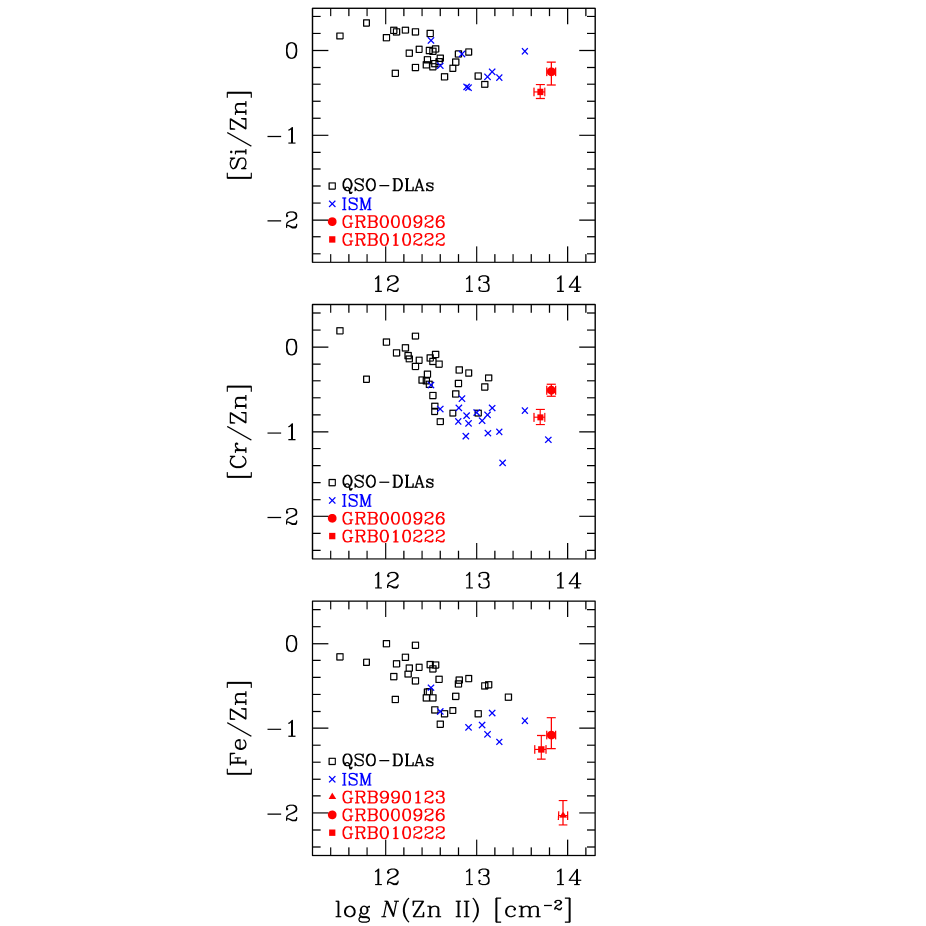
Figure 4 displays the QSO–DLA column density histograms222We have not used Al II measurements detected in GRB000926 and GRB010222, because not included in the QSO–DLA sample, and because [Fe/Al] and for GRB000926 and GRB010222, respectively, which is not particularly interesting for our discussion. of Fe II, Cr II, Zn II, and Si II. These column densities are obtained from a large compilation of QSO–DLA measurements collected from the literature (see Savaglio 2000 for a description of the compilation). The sample contains 98 QSO absorption line systems associated with mostly neutral gas clouds (H I column density larger than cm-2) of the ISM in galaxies, for which the column density of one or more of the following elements is measured: Zn II, Si II, Cr II, Fe II. The symbols in Figure 4 indicates the column densities of the same ions measured for the three GRB–DLAs. This reveals several differences between QSO–DLAs and GRB–DLAs. The Zn II column density in GRB–DLAs shows the most striking difference, being much larger than in QSO–DLAs. For Si and Cr the deviations are also very large. Fe II behaves differently, being quite consistent with the upper part of the Fe II QSO–DLA distribution.
If the gas is nearly neutral, as suggested by the large EWs of the low ionization lines, the ionization correction can be neglected and it is possible to calculate the element relative abundance from ions with ionization potential above 13.6 eV. This assumption is also widely used to derive abundances in QSO–DLAs. Table 3 shows the comparison between heavy element relative abundances in QSO–DLAs (mean values, column four) and in the three GRB–DLAs (columns five, six and seven) . Columns two and three also give the number of QSO–DLAs considered and the mean redshift, respectively. For both GRB–DLAs and QSO–DLAs, the standard solar abundances from Grevesse, Noels, & Sauval (1996) are adopted. The very low [Fe/Zn] values in three GRB–DLAs (, , and ) are much smaller than in QSO–DLAs: [Fe/Zn] in 32 objects. This is an indication of strong dust content in the GRB circumburst medium and/or in the ISM of the host galaxy, because while Fe is heavily depleted on dust in the ISM of galaxies, Zn is marginally depleted only in the densest clouds (Savage & Sembach 1996a). The plot of [X/Zn] abundances as a function of the Zn II column density is also very interesting (Figure 5). In QSO–DLAs these show a trend, the [X/Zn] being smaller for larger Zn II). The [X/Zn] values for GRB–DLAs are located at the extension of the [X/Zn] vs. Zn II) distribution in QSO–DLAs. The gap between QSO–DLAs and GRB–DLAs is filled by a completely different class of absorbers: those in the ISM of the MW and MC. Low values of [Fe/Zn] are also an indication of high dust content. Petitjean, Srianand, & Ledoux (2002) discuss the gas density in QSO–DLAs with H2 detection, and suggest that the dust depletion might be larger in denser clouds. If this can be extended to GRB–DLAs, it might imply that their gas density is higher than in QSO–DLAs.
The small [X/Zn] values found in GRB–DLAs might be a general property of high metal column density systems rather than a peculiarity of GRBs themselves. GRBs are initially brighter than QSOs, hence detectable even in cases of heavy dust obscuration. In other words, QSO–DLAs and GRB–DLAs might probe the same population of galaxies, but different regions: the sight lines of the former cross moderately dense regions, while the sight lines of the latter might cross denser regions such as molecular clouds in a star forming environment.
As already discussed in § 2, the COG analysis may underestimate column densities if the lines are strongly saturated, as in the case of Fe II. This would artificially create a large dust depletion if [Fe/Zn] were used as an indicator. However, the underestimate of saturated lines is in most cases not larger than 0.1 dex (Jenkins 1986). Moreover, an independent check of consistency is provided by the comparison of Fe II with Si II and Cr II. Si II and Fe II have similar problems with saturation, but Si is much less dust depleted (Savage & Sembach 1996a). The iron–to–silicon relative abundance is low in the two GRB–DLAs discussed here, indicating high depletion of iron in dust: [Fe/Si] and in GRB000926 and GRB010222, respectively. Also [Cr/Zn] is a dust indicator. Cr II absorption lines are generally weakly saturated, but the column densities in the same two GRB–DLAs are low compared to Zn II: [Cr/Zn] = and in the same two GRBs.
There are indications that the H I column density in GRB–DLAs is larger than in typical QSO–DLAs. In 89 QSO–DLAs with H I, only 15 (17%) have H I. The H I column density has been estimated in GRB000301C by Jensen et al. (2001), who report H I cm-2. GRB000926 has also been observed with the Nordic Optical Telescope (Fynbo et al. 2002) and a very strong Ly absorption line identified, with column density cm-2. This is in a very noisy part of the spectrum, but if we assume that this H I column density is close to the correct value and neglect ionization correction, we derive [Si/H] , [Zn/H] , [Cr/H] , [Fe/H] , suggesting a large metallicity and dust depletion for a large H I GRB–DLA. In comparison, in 8 QSO–DLAs with H I, and measured Zn II and Cr II, we find [Zn/H] and [Cr/H].
4 DUST DEPLETION AND EXTINCTION
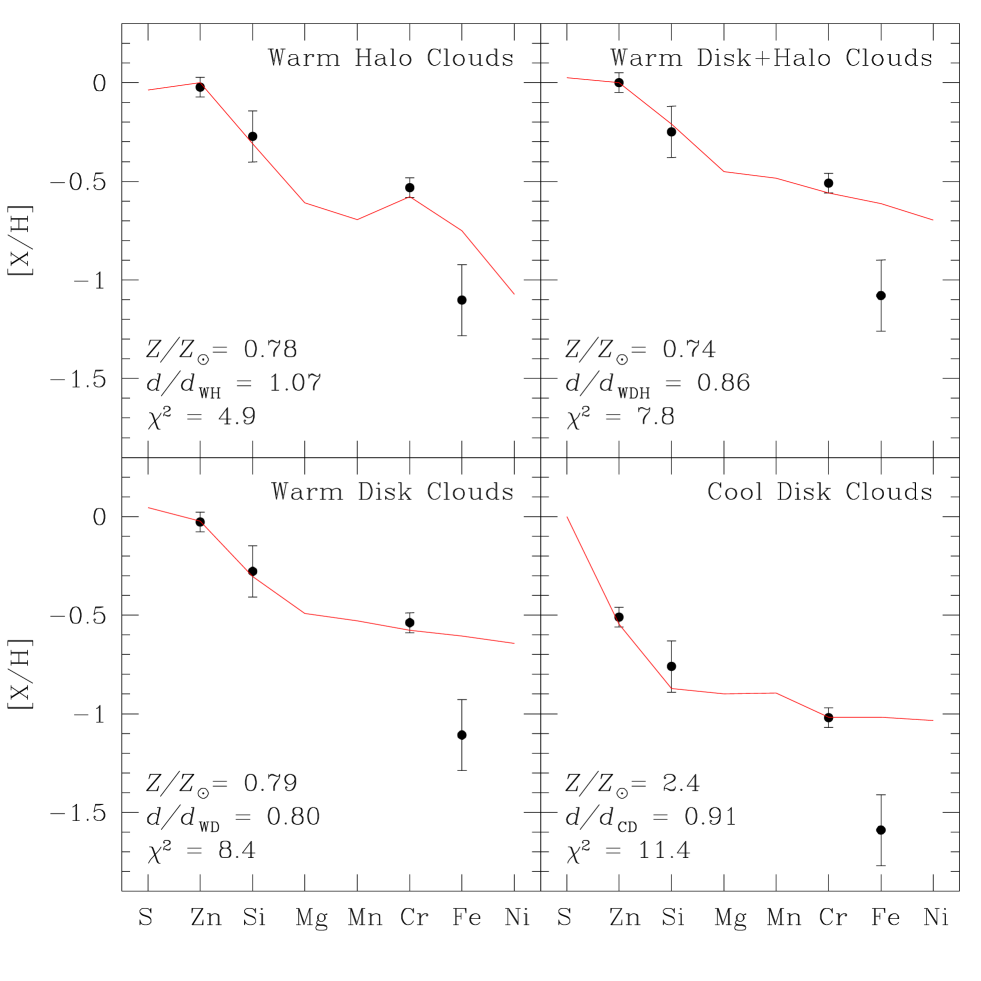
Since four elements are measured in GRB000926, it is possible to derive its dust depletion pattern. We adopt the method described in Savaglio (2000). Basically, we consider the four depletion patterns observed in the Milky Way, e.g. the depletion patterns in the warm halo (WH), warm disk+halo (WDH), warm disk (WD), and cool disk (WC) clouds (Savage & Sembach 1996a). For each depletion pattern, we find the best–fit values for the dust–to–metals ratio (, where depends on the depletion pattern assumed) and the metallicity compared to solar . The result for GRB000926 at is shown in Figure 6. The best fit is given by the warm halo cloud pattern, with . This is higher than the metallicities in QSO–DLAs: in 21 DLAs at (Savaglio 2000).
We can now estimate the obscuration of the GRB due to dust distributed along its line of sight. This is proportional to the column density of metals. The extinction in the V–band, due to dust, can be approximated by:
| (1) |
where 0.54 is the typical value of in the solar neighborhood for a column density of gas with H I. For GRB000926, we find mag. This is much higher than in QSO–DLAs, where extinction is typically lower than 0.1 mag.
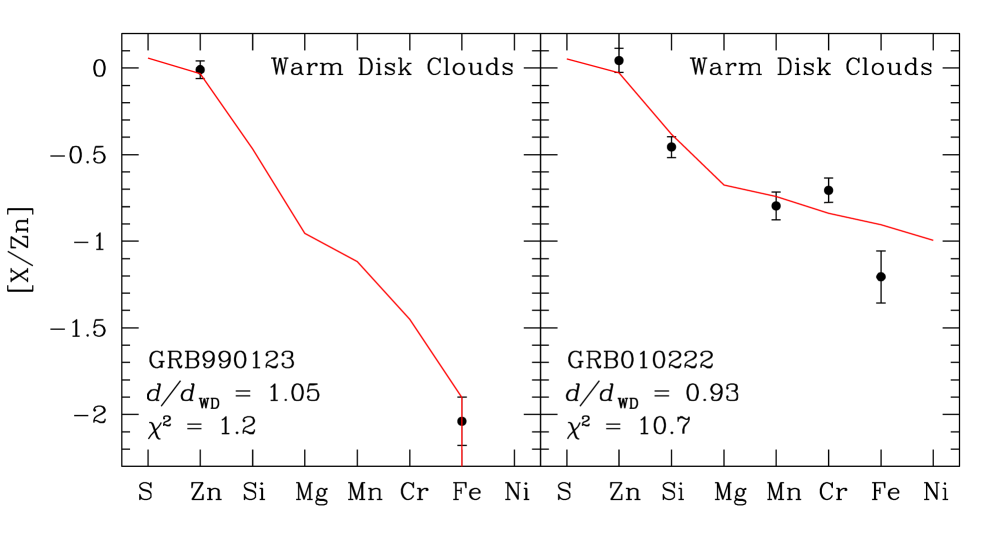
The depletion pattern and extinction can also be calculated for GRB990123 and GRB010222, because this depends on the product of metallicity and H I column density, i.e., the column density of metals. We consider the Zn II column density and neglect the dust depletion correction for this element. Best–fits for these two GRB–DLAs give a warm halo cloud depletion pattern (Figure 7), and dust extinctions of and 0.7 mags for GRB990123 and GRB010222, respectively.
5 DISCUSSION
We have used the curve of growth to study the heavy element absorption lines associated with three GRBs, namely GRB990123 (Kulkarni et al. 1999), GRB000926 (Castro et al. 2001), and GRB010222 (Masetti et al. 2001; Jha et al. 2001; Salamanca et al. 2001; Mirabal et al. 2002). These are the only GRBs with available UV spectra obtained so far with quality good enough to detect high S/N absorption lines. All GRB spectra show very high Zn II absorption associated with the circumburst medium or interstellar medium of the host galaxy, from which we derive a mean column density of Zn II at . This is times larger than the largest Zn II column density detected so far in QSO–DLAs. High Zn II columns indicate high metallicity and/or low ionization of the gas, also supported by the presence of strong Fe II, Si II, and Cr II, as well as Mg II together with Mg I. Moreover, the GRB–DLAs analyzed here satisfied the criteria found by Rao & Turnshek (2000) that are used for QSO–DLA selection, namely Mg II Å and Fe II Å.
Since the metal column densities are so high, the dust extinction can be very important. A good indicator of dust content is given by the [Fe/Zn] values; in the GRB–DLAs these are much smaller (higher dust depletion) than those seen in QSO–DLAs: [Fe/Zn] in the former, [Fe/Zn] in the latter. The combination of large column densities of metals and large dust depletion can lead to large extinction in GRB–DLAs. If we compare metal column densities with the ones in the solar neighborhood, where extinction is very well studied, we find optical extinction of and 1.1 magnitudes. This is much larger than that found for most QSO–DLAs: . We notice, however, that another possible explanation for the very low [Fe/Zn] values would be a nucleosynthetic production of Fe and Zn in GRBs and/or their environment being different from the standard solar pattern.
These strong differences between QSO–DLAs and GRB–DLAs do not necessarily indicate a difference in the nature of the host galaxies. Indeed, the distribution of the Zn relative abundances as a function of Zn II column density in GRB–DLAs and QSO–DLAs is consistent for these two classes of objects. [Fe/Zn], [Cr/Zn], and [Si/Zn] decrease as a function of Zn II) for QSO–DLAs and GRB–DLAs, which are located in the upper left part and in the lower right part of the diagram, respectively. The QSO–DLA and GRB–DLA distributions are bridged by the heavy element abundances in the diffuse and dense ISM of the Milky Way and the Magellanic Clouds. This suggests that the galaxies associated with the absorbing gas around GRBs are not different from those of QSO–DLAs. The important difference is in the column densities of the intervening ISM: GRBs are (at least for some time) much brighter than optically selected QSOs, so their sight lines can probe much denser and dustier regions of galaxies. Indications of a bias effect in QSO–DLAs due to dust obscuration have been pointed out by several authors (Fall & Pei 1993; Boissé et al. 1998; Savaglio 2000; Petitjean et al. 2002).
Reichart (1998), Jensen et al. (2001), Rhoads & Fruchter (2001), Fynbo et al. (2001), and Galama & Wijers (2001) have estimated the dust extinction in GRBs from curvature in their spectra, assuming that the intrinsic GRB spectra from the UV to IR bands are power laws. This approach gives a small extinction only if MW or MC laws are assumed: for GRB970508, GRB000301C, GRB000926, and GRB990123. The result for GRB990123 is supported by the lack of spectral slope variation going from the optical to x–ray bands (Castro-Tirado et al. 1999). Šimon et al. (2001) have found that the color variation during GRB decline in 17 objects (three of which are the ones studied in this paper) is relatively small, suggesting similar and low reddening in these GRBs. However, they also notice that another sample of five GRBs (not included in the first one, for lack of complete photometric information) have much redder colors. Low extinction can be explained by sublimation of dust grains due to UV emission (Waxman & Draine 2000). Fruchter, Krolik, & Rhoads (2001) suggest grain destruction by GRB heating and grain charging. These effects can be present up to a distance of pc from the GRB source.
This is in principle in contradiction with our findings. However, the dust disruption mechanisms suggested by Fruchter et al. (2001), or other mechanisms, such as sputtering (Draine & Salpeter 1979), predict that small grains are destroyed first. Dust destruction of small grains would still give a large content of dust, if the initial grain–size distribution is dominated by large grains, as suggested in models of MW an MC extinction curves (Weingartner & Draine 2001). Therefore, what remains in dust can still be an important fraction of the total metal content. Grain coagulation favored by high densities, leading to the formation of large grains, is also possible (Mathis 1990). In these cases, MW or MC extinction curves might be inappropriate to describe dust obscuration. A dust grain distribution skewed toward large grains would give a grey extinction, therefore may explain the low reddening found in GRB afterglows (Stratta et al. 2002). This is a plausible speculation, but quantitative calculations, needed to determine if it works in practice, are beyond the scope of this paper. A first attempt is instead presented by Perna & Lazzati (2002), who have developed a detailed numerical code that describes, among other effects, the dust destruction under an intense X–ray and UV radiation field the very first seconds after the burst. Alternative explanations are unknown systematic effects. For instance, the low reddening suggested relies on the assumption of an intrinsic power law emission of the optical afterglow, which in principle cannot be tested. It might also be that the extinction in itself is a power law, and when combined with the intrinsic GRB power law emission, would still give a power law spectrum. Therefore, this would require low or no rectification.
The main result of the present work is the strong difference between QSO–DLA and GRB–DLA heavy element column densities. GRB–DLAs occur most likely along the sight line of much brighter sources, and are embedded in star forming and therefore metal rich regions, where the dust extinction is probably not negligible. This is another evidence supporting the idea that DLAs in front of the fainter QSO radiation, can be detected and studied in detail only when the sight line crosses less dense, metal polluted and/or extincted regions of high redshift galaxies.
References
- (1) Blades, J. C., Hunstead, R. W., Murdoch, H. S., Pettini M. 1982, MNRAS, 200, 1091
- (2) Boissé, P., Le Brun, V., Bergeron, J., & Deharveng, J.-M. 1998, A&A, 333, 841
- (3) Cardelli, J. A., Sembach, K. R., & Savage, B. D. 1995, ApJ, 440, 241
- (4) Castro, S., Galama, T. J., Harrison, F. A., Holtzman, J. S., Bloom, J. S., Djorgovski, S. G., & Kulkarni, S. R. 2001, ApJ, submitted (astro-ph/0110566)
- (5) Castro-Tirado, A. J., et al. 1999, Science, 283, 2069
- (6) Draine, B. T., & Salpeter, E. E. 1979, ApJ, 231, 438
- (7) Ellison, S. L., Yan, L., Hook, I. M., Pettini, M., Wall, J. V., & Shaver, P. 2001, A&A, 379, 393
- (8) Fall, S. M., & Pei, Y. C. 1993, ApJ, 402, 479
- (9) Fiore, F. 2001, ASP Conf. Ser. 251, New Century of X-ray Astronomy, ed. H. Inoue & H. Kunieda (San Francisco: ASP), 168
- (10) Fynbo, J., et al. 2001, A&A, 2001, 373, 796
- (11) Fynbo, J., et al. 2002, MPA/ESO proceedings of the conference “Lighthouses of the Universe”, p187, (astro-ph/0110603)
- (12) Fruchter, A., Krolik, J. H., & Rhoads, J. E. 2001, ApJ, 563, 597
- (13) Galama, T. J., & Wijers, A. M. J. 2001, ApJ, 549, L209
- (14) Grevesse, N., Noels, A., & Sauval, A. J. 1996, in ASP Conf. Ser. 99, Cosmic Abundances, ed. S. S. Holt & G. Sonneborn (San Francisco: ASP), 117
- (15) Holland, S. T., et al. 2002, AJ, 124, 639
- (16) Jenkins, E. B. 1986, ApJ, 304, 739
- (17) Jensen, B. L., et al. 2001, A&A, 370, 909
- (18) Jha, S., et al. 2001, ApJ, 554, L155
- (19) Kulkarni, S. R., et al. 1999, Nat, 398, 389
- (20) Lu, L., Sargent, W. L. W, Barlow, T. A., Chruchill, C. W., & Vogt, S. S. 1996, ApJS, 107, 475
- (21) Masetti, N., et al. 2001, A&A, 374, 382
- (22) Mathis, J. S. 1990, ARA&A, 28, 37
- (23) Metzger M. R., Djorgovski S. G., Kulkarni S. R., Steidel, C. C., Adelberger, K. L., Frail, D. A., Costa, E., & Frontera, F. 1997, Nat, 387, 878
- (24) Mirabal, N., et al. 2002, ApJ, 578, 818
- (25) Perna, R., & Lazzati, D. 2002, ApJ, 580, 261
- (26) Petitjean, P., Srianand, R., & Ledoux, C. 2002, MNRAS, 332, 383
- (27) Pettini, M., Smith, L. J., King, D. L., & Hunstead, R. W. 1997, ApJ, 486, 665
- (28) Piran, T. 2001, van Paradijs Memorial Symposium, June 6-8 Amsterdam, in press (astro-ph/0111314)
- (29) Prochaska, J. X., & Wolfe, A.M. 1999, ApJS, 121, 369
- (30) Prochaska, et al. 2001, ApJS, 2001, 137, 21
- (31) Rao, S. M., & Turnshek, D. A. 2000, ApJS, 130, 1
- (32) Reichart, D. E. 1998, ApJ, 495, L99
- (33) Rhoads, J. E., & Fruchter, A. S., 2001, ApJ, 546, 117
- (34) Roth, K. C., & Blades, J. C. 1995, ApJ, 445, L95
- (35) Roth, K. C., & Blades, J. C. 1997, ApJ, 474, L95
- (36) Salamanca, I., et al. 2001, MNRAS, submitted
- (37) Savage, B. D., & Sembach, K. R. 1991, ApJ, 379, 245
- (38) Savage, B. D., & Sembach, K. R. 1996a, ARA&A, 34, 279
- (39) Savage, B. D., & Sembach, K. R. 1996b, ApJ, 470, 893
- (40) Savaglio, S. 2000, IAU Symposium: “The Infrared Background and its Cosmological Implications”, ed. M. Harwit & M. G. Hauser, Vol. 204, p307
- (41) Sembach, K. R., & Savage, B. D. 1996, ApJ, 457, 211
- (42) Šimon, V., Hudec, R., Pizzichini, G., Masetti, N., 2001, A&A, 377, 450
- (43) Spitzer, L. 1978, Physical Processes in the Interstellar Medium (New York: Wiley)
- (44) Spitzer, L., & Fitzpatrick, E. L. 1995, ApJ, 445, 196
- (45) Stratta, G., et al. 2002, ApJ, submitted
- (46) Turnshek, D. A., Wolfe A. M., Lanzetta K. M., Briggs, F. H., Cohen, R. D., Foltz, C. B., Smith, H. E., Wilkes, B. J. 1989, ApJ, 344, 567
- (47) Vreeswijk, P. M., et al. 2001, ApJ, 546, 672
- (48) Waxman, E., & Draine, B. T. 2000, ApJ, 537, 796
- (49) Weingartner, J. C., & Draine, B. T. 2001, ApJ, 548, 296
- (50) Welty, D. E., Frisch, P. C., Sonneborn, G., & York, D. G. 1999, ApJ, 512, 636
- (51) Welty, D. E., Lauroesch, J. T., Blades, J. C., Hobbs, L. M., & York, D. G. 1997, ApJ, 489, 672
| (Å) | ||||
| GRB990123 | GRB000926 | GRB010222 | ||
| Line | ||||
| Zn II | 0.489 | c,dc,dfootnotemark: | ||
| Zn II | 0.256 | aaCr II contribution to the Zn II + Cr II blend is negligible. | bbNoisy region of the spectrum, given only upper limit based on the total EW + , reported by Castro et al. 2001. | c,ec,efootnotemark: |
| Si II | 0.127 | – | ffWeighted mean from Masetti et al. 2001, Salamanca et al. 2001, Jha et al. 2001, and Mirabal et al. 2002. | |
| Si II | 0.00218 | – | ffWeighted mean from Masetti et al. 2001, Salamanca et al. 2001, Jha et al. 2001, and Mirabal et al. 2002. | |
| Cr II | 0.105 | – | ggWeighted mean from Salamanca et al. 2001 and Mirabal et al. 2002. | |
| Cr II | 0.0515 | – | ggWeighted mean from Salamanca et al. 2001 and Mirabal et al. 2002. | |
| Cr II | 0.078 | – | bbNoisy region of the spectrum, given only upper limit based on the total EW + , reported by Castro et al. 2001. | c,ec,efootnotemark: |
| Fe II | 0.058 | – | ggWeighted mean from Salamanca et al. 2001 and Mirabal et al. 2002. | |
| Fe II | 0.00244 | – | – | hhMirabal et al. 2002. |
| Fe II | 0.114 | iiWeighted mean from Masetti et al. 2001, Jha et al. 2001, and Mirabal et al. 2002. | ||
| Fe II | 0.0313 | – | jjWeighted mean from Jha et al. 2001 and Mirabal et al. 2002. | |
| Fe II | 0.320 | jjWeighted mean from Jha et al. 2001 and Mirabal et al. 2002. | ||
| Fe II | 0.0691 | – | ffWeighted mean from Masetti et al. 2001, Salamanca et al. 2001, Jha et al. 2001, and Mirabal et al. 2002. | |
| Fe II | 0.239 | ffWeighted mean from Masetti et al. 2001, Salamanca et al. 2001, Jha et al. 2001, and Mirabal et al. 2002. | ||
| Mn II | 0.3508 | – | – | ffWeighted mean from Masetti et al. 2001, Salamanca et al. 2001, Jha et al. 2001, and Mirabal et al. 2002. |
| Mn II | 0.2710 | – | – | ccWeighted mean from Jha et al. 2001, Salamanca et al. 2001, and Mirabal et al. 2002. |
| Mn II | 0.1927 | – | – | hhMirabal et al. 2002. |
| (cm-2) | |||
| Ion | GRB990123 | GRB000926 | GRB010222 |
| Zn II | |||
| Si II | – | ||
| Cr II | – | ||
| Fe II | |||
| Mn II | – | – | |
| QSO–DLAs | GRB–DLAs | ||||||
|---|---|---|---|---|---|---|---|
| X/Zn | No. | [X/Zn] | GRB990123 | GRB000926 | GRB010222 | ||
| Fe/Zn | 32 | 1.994 | |||||
| Si/Zn | 28 | 2.064 | – | ||||
| Cr/Zn | 30 | 2.013 | – | ||||
| Mn/Zn | 11 | 1.392 | – | – | |||