AN 322 (2001) 5/6, 411–418
Search for progenitors of supernovae type Ia with SPY††thanks: Based on data obtained at the Paranal Observatory of the European Southern Observatory for programs 165.H-0588, 167.D-0407, and 266.D-5658 \fnmsep††thanks: Based on observations collected at the German-Spanish Astronomical Center, Calar Alto, operated by the Max-Planck-Institut für Astronomie Heidelberg jointly with the Spanish National Commission for Astronomy
Abstract
We have started a large survey for double degenerate (DD) binaries as potential progenitors of type Ia supernovae with the UVES spectrograph at the ESO VLT (ESO SN Ia Progenitor surveY – SPY). About 400 white dwarfs were checked for radial velocity variations during the first 15 months of this project, twice the number of white dwarfs investigated during the last 20 years. We give an overview of the SPY project and present first results Fifty four new DDs have been discovered, seven of them double lined (only 18 and 6 objects of these groups were known before, respectively). The final sample is expected to contain 150 to 200 DDs. Eight new pre-cataclysmic binaries were also detected. SPY is the first DD survey which encompasses also non-DA white dwarfs. SPY produces an immense, unique sample of very high resolution white dwarf spectra, which provides a lot of spin-off opportunities. We describe our projects to exploit the SPY sample for the determination of basic parameters, kinematics, and rotational velocities of white dwarfs. A catalogue with a first subset of our white dwarf data has already been published by Koester et al. ([2001]).
1 Introduction
Supernovae of type Ia (SN Ia) play an outstanding role for our understanding of galactic evolution and the determination of the extragalactic distance scale. However, the nature of their progenitors is still unknown (e.g. Livio [2000]). There is general consensus that the event is due to the thermonuclear explosion of a white dwarf when a critical mass (very likely the Chandrasekhar limit, ) is reached, but the nature of the progenitor system remains unclear. It must be a binary, with matter being transfered to the white dwarf from a companion until the critical mass is reached. However, two options exist for the nature of the companion: either another white dwarf in the so-called double degenerate (DD) scenario (Iben & Tutukov [1984]), or a red giant/subgiant in the so-called single degenerate (SD) scenario (Whelan & Iben [1973]), with the system possibly appearing as a symbiotic binary (Munari & Renzini [1992]) or a supersoft X-ray source (van den Heuvel et al. [1992]).
The solution of the SD vs. DD dilemma is of great importance for assessing the role of SNe Ia in a variety of astrophysical situations, and – perhaps even more importantly – their effectiveness as accurate cosmological probes (cf. Leibundgut [2000]). As is widely known, current studies of high- SNe Ia favour an accelerating, –dominated universe (Riess et al. [1998]; Leibundgut [2001]). Yet, the result depends on the assumption that the light-curves of high- SNe Ia are intrinsically identical to those of the local SNe Ia. If instead high- SNe Ia were just mag dimmer at maximum, then a universe would be preferred (Riess et al. [1998]; Leibundgut [2000]). Knowing whether the progenitors are SD or DD systems would constrain the possible explosion models and improve the use of SNe Ia as cosmological probes.
Several systematic radial velocity (RV) searches for DDs have been undertaken starting in the mid 1980’s (e.g. Robinson & Shafter [1987]; Bragaglia et al. [1990]; Saffer, Livio & Yungelson [1998]; Maxted & Marsh [1999]). Before 2001, combining all the surveys, white dwarfs have been checked for RV variations with sufficient accuracy yielding 18 DDs with periods (Marsh [2000]; Maxted et al. [2000a]). None of the 18 systems seems massive enough to qualify as a SN Ia precursor. This is not surprising, as theoretical simulations suggest that only a few percent of all DDs are potential SN Ia progenitors (Iben, Tutukov & Yungelson [1997]; Nelemans et al. [2001]).
In order to perform a definitive test of the DD scenario we have embarked on a large spectroscopic survey of 1500 white dwarfs using the UVES spectrograph at the UT2 telescope (Kueyen) of ESO VLT to search for RV variable white dwarfs (ESO SN Ia Progenitor surveY – SPY). Details of our observations are given in Sect. 2. SPY will overcome the main limitation of all efforts so far to detect DDs that are plausible SN Ia precursors: the samples of surveyed objects were too small.
The SPY program has now just reached mid term, but already dramatically increased the number of white dwarfs checked for RV variations and the number of known DDs. Our sample includes many short period binaries, several with masses closer to the Chandrasekhar limit than any system known before. An overview of our DD results is given in Sect. 3.
SPY produces a unique sample of high-quality, high-resolution spectra of white dwarfs. This is a large, homogeneous database of enormous value for many other areas of research. Spin-off opportunities in general and projects started by us to exploit this treasure chest are discussed in Sect. 4.
2 Observations and data reduction

Targets for SPY are drawn from five sources: the white dwarf catalog of McCook & Sion ([1999]), the Hamburg ESO Survey (HES; Wisotzki et al. [2000]; Christlieb et al. [2001]), the Hamburg Quasar Survey (Hagen et al. [1995]; Homeier et al. ([1998]), the Montreal-Cambridge-Tololo survey (MCT; Lamontagne et al. [2000]), and the Edinburgh-Cape survey (EC; Kilkenny et al. [1997]). Our selection criteria were spectroscopic confirmation as white dwarf (at least from objective prism spectra) and .
Spectra were taken with the UV-Visual Echelle Spectrograph (UVES) of the UT2 telescope (Kueyen) of the ESO VLT. UVES is a high resolution Echelle spectrograph, which can reach a resolution of 110,000 in the red region with a narrow slit (cf. Dekker et al. [2000] for a description of the instrument). Our instrument setup (Dichroic 1, central wavelengths 3900 Å and 5640 Å) uses UVES in a dichroic mode with a EEV CCD windowed to in the blue arm, and two CCDs, a EEV and a MIT-LL, in the red arm. Nearly complete spectral coverage from 3200 Å to 6650 Å with only two 80 Å wide gaps at 4580 Å and 5640 Å is achieved. In the standard setting used for our observations UVES is operated with an decker in the blue arm and an decker in the red arm.
Our program is implemented as a service mode program. It takes advantage of those observing conditions, which are not usable by most other programs (moon, bad seeing, clouds) and keeps the VLT busy when other programs are not feasible. A wide slit () is used to minimise slit losses and a binning is applied to the CCDs to reduce read out noise. Our wide slit reduces the spectral resolution to (0.36 Å at H) or better, if seeing disks were smaller than the slit width. Depending on the brightness of the objects, exposure times of 5 min or 10 min were chosen. The S/N per binned pixel (0.03 Å) of the extracted spectrum is usually 15 or higher. Due to the nature of the project, two spectra at different, “random” epochs separated by at least one day are observed.
Although our program is carried out during periods of less favourable observing conditions, the seeing is often smaller than the selected slit width of . This can, in principle, cause wavelength shifts, if the star is not placed in the center of the slit. However, since according to the standard observing procedure the star is first centered on a narrow slit before the exposure with the broader slit is started, it can be expected that the star is usually well centered in the slit. We note that possible wavelength shifts can be corrected with the telluric absorption features present in the red region of our spectra.
Data reduction:
ESO provides a data reduction pipeline for UVES, based on MIDAS procedures. The raw data are bias and interorder background subtracted and extracted with an optimum extraction algorithm. The orders are flatfielded, rebinned, and merged. Wavelength calibration is performed by means of ThAr calibration lamp exposures. The quality of the reduced spectra is in most cases very good; especially the removal of the interorder sensitivity variation and merging of the orders works very well. Sometimes the reduction pipeline produces artifacts of varying strength, e.g. a quasiperiodic pattern in the red region similar in appearance to a fringing pattern. In a few cases either the blue or the red part of the spectrum has extremely strong artifacts of unknown orign. A “UVES” context for MIDAS is available, which provides reduction routines adapted for the UVES spectrograph and can be used to re-reduce spectra. As an example of the quality achievable with the pipeline reduction one spectrum without extraction problems is shown in Fig. 1.
Remaining large scale variations of the spectral response function are removed by utilizing nearly featureless spectra of DC white dwarfs or of sdO stars with narrow spectral lines, which are normalised and used to derive an approximate response function. This function was applied to the other spectra. Since the sampling of the spectra is much higher than needed for many purposes (besides measuring RVs), we produced a version of the spectra, which were rebinned to 0.1 Å stepsize and smoothed with a Gaussian of 0.2 Å FWHM. This produces only a slight degradation of the resolution while considerably improving the signal-to-noise level.
Radial velocity measurement:
Since SPY produces a large number of spectra, which have to be checked for RV variations, a fast and reliable algorithm to measure RV shifts is necessary. One often applied standard technique is cross correlation of observed spectra. The RV shift is measured from the peak of the correlation function. However, it turned out that this method is not well suited for the determination of RVs from the narrow cores of the broad Balmer lines of DA white dwarfs. This can be understood as follows. If we limit the correlation to, say, the inner 10 Å of the line to avoid spurious signals caused by normalization problems etc., the boundaries of the integration interval are located in the line wings. Contributions from both interval boundaries (which generally do not cancel out) result in a large extra signal in addition to the real correlation signal, which makes the determination of the correlation peak very difficult or even impossible.
We overcome this problem by applying a correlation based on a test instead of the usual cross correlation. Our procedure starts with a noise estimate from the rms scatter computed within a moving box. Cosmics etc. are flagged out with an clipping algorithm. Since it is important for computing a realistic that the spectra have the same flux level, we scale the second spectrum to the first one using a low order polynomial to account for possible differences of the continuum slope. Afterwards is calculated as a function of RV difference, by shifting the second spectrum in small RV steps (0.1 km s-1) and calculate by direct numerical integration (without rebinning). Since the calculation of for two noisy spectra results in some noise in the resulting curve, finally a slight smoothing (Gaussian of FWHM 1 km s-1) is applied. The RV shift is evaluated from the minimum . Error margins can be estimated by determining the intervals corresponding to a certain as described in Press et al. ([1992]).
From a formal point of view tests were invented to test and find best fitting models. Nevertheless, our method works and produces reliable results with the observed spectra as well. We performed several tests: Two observed spectra were correlated with a model spectrum and the RV shifts added, which yielded virtually the same result as the direct correlation of both observed spectra. We also made experiments with simulated spectra, produced from model spectra by adding artificial noise and known RV shifts. These RV differences could always be reproduced from the correlation within the estimated error limits. One great advantage of our procedure is its flexibility and that it can easily be applied to measure RV shifts in stars of different spectral types (Balmer lines of DA white dwarfs, He I lines of DBs, and metal lines of sdB stars like HE 10470436 discussed below). We routinely measure RVs with an accuracy of km s-1 or better, therefore running only a very small risk of missing a merger precursor, which have orbital velocities of 150 km s-1 or higher.
3 Results on double degenerates
We have analysed spectra of 387 white dwarfs taken during the first 15 months of the SPY project and detected 54 new DDs, 7 are double-lined systems (only 6 were known before). The great advantage of double-lined binaries is that they provide us with a well determined total mass. Since it is likely that the SPY sample contains even more double-lined systems (with a faint secondary), we will check follow-up observations of apparently single-lined systems for the signature of the secondary. Our sample includes many short period binaries (some examples are discussed in Sect. 3.1), several with masses closer to the Chandrasekhar limit than any system known before. In addition, we detected 8 RV variable systems with a cool main sequence companion (pre-cataclysmic variables; pre-CVs). Some examples of single-lined and double-lined DDs are shown in Fig. 2. A more detailed inventory of the SPY sample is given in Table 1. Our observations have already increased the DD sample by a factor of four. After completion, a final sample of 150 to 200 DDs is expected.
| Spectral type | total | RV variable | detection rate |
|---|---|---|---|
| All | 387 | 62 | 16% |
| DA | 310 | 53 | 17% |
| non-DA (DB,DO,DZ) | 53 | 1 | 2% |
| WD+dM | 24 | 8 | 33% |

Follow-up observations of this sample are mandatory to exploit its full potential. Periods and white dwarf parameters must be determined to find potential SN Ia progenitors among the candidates. Good statistics of a large DD sample will also set stringent constraints on the evolution of close binaries, which will dramatically improve our understanding of this phase of stellar evolution. During our follow-up observations we have detected a very promising potential SN Ia precursor candidate. However, some additional spectra are necessary to verify our RV curve solution. Results will be reported elsewhere.
Although important information like the periods, which can only be derived from follow-up observations, are presently lacking for most of the stars, the large sample size already allows us to draw some conclusions. (Note that fundamental white dwarf parameters like masses are known from the spectral analysis described below). One interesting aspect concerns white dwarfs of non-DA classes (basically the helium-rich spectral types DB, DO, and DZ, in contrast to the hydrogen-rich DAs). SPY is the first RV survey which performs a systematic investigation of both classes of white dwarfs: DAs and non-DAs. Previous surveys were restricted to DA white dwarfs, because the sharp NLTE core of H provides a very accurate RV determination. This feature is not present in non-DA (DB, DO) spectra, but the use of several helium lines enables us to reach a similar accuracy. Thus the low number of DDs found for the non-DA spectral types is statistically significant (Table 1) and indicates that important evolutionary channels for the formation of DDs produce preferentially hydrogen-rich white dwarfs of the DA variety.
3.1 Highlights of our follow-up results
Follow-up observations are necessary to determine the system parameters of the DDs. We concentrated on candidates with high RV variations, indicating short periods, because the probability to find potential SN Ia candidates among these systems is highest. However, let us note that probably some of the “small RV” DDs could be short period systems (possibly even SN Ia progenitors) with low inclination angles and/or unfavourable phase differences of the SPY observations. Follow-up observations have been carried out at the VLT as well as with the 3.5 m telescope of the Calar Alto observatory/Spain.
In the following paragraphs we present results for two of our most interesting binaries: the subdwarf B + white dwarf system HE 1047–0436 (Napiwotzki et al. [2001a]) and the double-lined DA+DA binary HE 1414–0848 (Napiwotzki et al. [2001b]) with a mass only 10% below the Chandrasekhar limit.
HE 1047–0436:
HE 1047–0436 was discovered by the Hamburg ESO Survey (HES) as a potential hot white dwarf and, therefore, included in our survey. The UVES spectra (Fig. 3) showed that it is in fact a subluminous B star (sdB) with a rather large RV shift of 160 km s-1, which made the star a prime target for further study. SdB stars are pre-white dwarfs of low mass () still burning helium in the core, which will evolve directly to the white dwarf stage omitting a second red giant phase.
Recently, sdBs with white dwarf components have been proposed as potential SNe Ia progenitors by Maxted et al. ([2000b]) who discovered that KPD 1930+2752 is a sdB+WD system. Its total mass exceeds the Chandrasekhar mass and the components will merge within a Hubble time, which makes KPD 1930+2752 a SN Ia progenitor candidate (although this interpretation has been questioned recently, Ergma et al. [2001]).
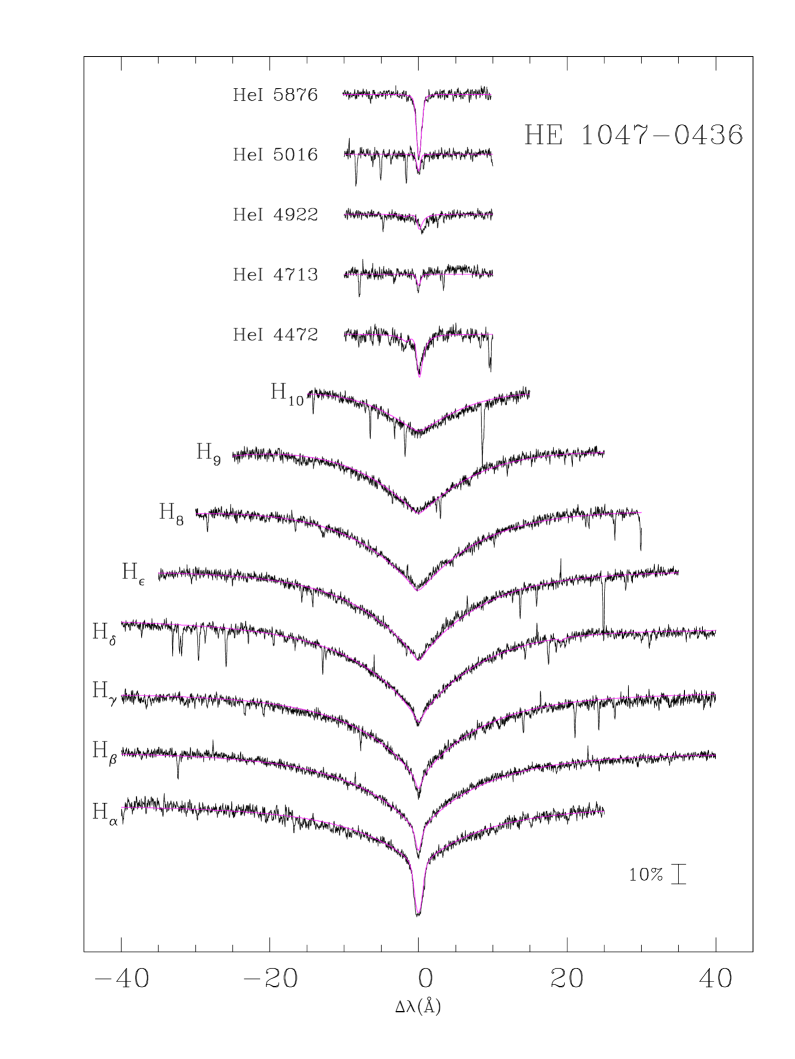


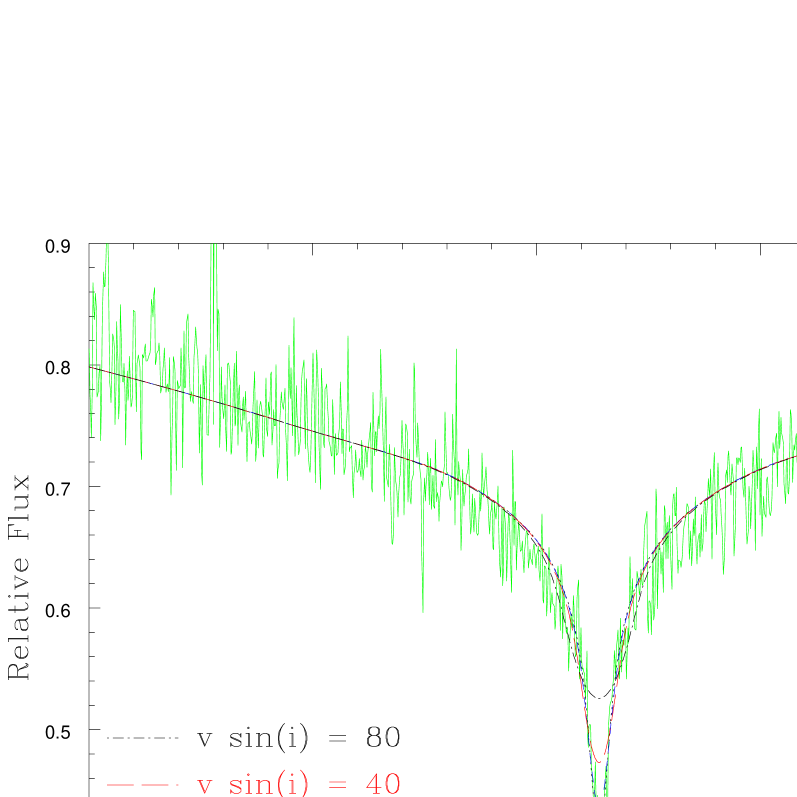
The high RV shift of HE 1047–0436 prompted us to perform follow-up observations (Napiwotzki et al. [2001a]). The orbital period of , a semi-amplitude of 94 km s-1, and a minimum mass of the invisible companion of are derived from the analysis of the RV curve (Figs. 4 and 5). We use an upper limit on the projected rotational velocity of the sdB star to constrain the system inclination and the companion mass to , bringing the total mass of the system closer to the Chandrasekhar limit. However, the system will merge due to loss of angular momentum via gravitational wave radiation only after several Hubble times. Atmospheric parameters ( K, ) and metal abundances are also derived (cf. Fig. 3). The resulting values are typical for sdB stars (cf. e.g. Edelmann et al. [2002]).
HE 1414–0848:

HE 14140848 is a double-lined DA+DA binary (Fig. 6). The orbital period of and semi-amplitudes of 127 km s-1 and 96 km s-1 are derived for the individual components (Napiwotzki et al. [2001b]). RV curves for both components are displayed in Fig. 7. The ratio of velocity amplitudes is directly related to the mass ratio of both components. Additional information comes from the mass dependent gravitational redshift , which for a given mass-radius relation can be computed as a function of white dwarf mass. The difference in gravitational redshift corresponds to the apparent difference of “systemic velocities” of both components, as derived from the RV curves. Only one set of individual white dwarf masses fulfils the constraints given by both the amplitude ratio and redshift difference. We estimate the masses of the individual components with this method: and . Another estimate of the white dwarf parameters is available from a model atmosphere analysis of the combined spectrum. The formal result indicates an average mass of consistent with the results derived from the analysis of the RV curve. The total mass of the HE 14140848 system is , only 10% below the Chandrasekhar limit! The system will merge due to loss of angular momentum via gravitational wave radiation after two Hubble times. Therefore HE 14140848 does not qualify as a SN Ia progenitor, but it is the most massive short period DD known today.

4 Spin-off results
SPY produces an immense, unique sample of very high resolution white dwarf spectra. This database will have a large impact on many fields of white dwarf science. It will allow us for the first time to tackle many longstanding questions on a firm statistical basis. Among those are the mass distribution of white dwarfs, kinematical properties of the white dwarf population, surface compositions, luminosity function, rotational velocities, and detection of weak magnetic fields. We have therefore decided to make these results available to the community in the form of a catalog with some preliminary interpretation as soon as feasible, not waiting for the completion of the SPY project. A first part of this catalog was published in the recent paper of Koester et al. ([2001]), covering observations of about 200 white dwarfs of spectral types DA and DB. For all spin-off opportunities mentioned above the statistics will be dramatically improved by the final white dwarf spectra database. We are exploiting the SPY sample for two spin-off projects, which take advantage of the high spectral resolution: the kinematics of white dwarfs and their rotational velocities.
Basic parameters and mass distribution of white dwarfs:
The response of the UVES spectrograph is sufficiently stable and well behaved to allow the determination of temperatures, gravities, and masses for the programme white dwarfs. Thus we carried out a model atmosphere analysis and published the results in our catalog paper (Koester et al. [2001]). Agreement of our results with literature values is quite good for the DA sample, thus confirming that the UVES spectra can be used for accurate and reliable parameter determination of white dwarfs. This was not necessarily expected, since the individual Balmer lines in the DA span several echelle orders. Note that our catalog paper included the second ever published analysis of a sample of helium-rich DB white dwarfs.
Our parameter determinations allow the selection of special types of white dwarfs for further follow-up investigations (by us as well as by other members of the community), and are a prerequisite for the determination of space velocities (see next paragraph).
Kinematical properties of white dwarfs:
The large SPY sample of white dwarfs can be used to study the kinematics of these stars in our Galaxy, especially with respect to their belonging to the thin or thick disk population. The aim is to verify recent claims that a substantial fraction of the mass of the Galactic disk may be provided by thick disk white dwarfs, as it is concluded from the abundance analysis of a local sample of F and G type main sequence stars (Fuhrmann [2001]).


We combined the measured RVs of the white dwarfs and determined proper motions from the DSS1/DSS2 and USNO data. Distances and corrections of the RV for gravitational redshift are computed from the fundamental parameters derived by Koester et al. ([2001]). Thus the space motion in three dimensions is known and Galactic orbits can be computed from a code developed by Odenkirchen & Brosche ([1992]). Examples of thin and thick disk orbits are shown in Fig. 8. So far 47 white dwarfs have been analysed. This will be the first kinematic study of a large sample of white dwarfs, which is based on the complete set of space motion in three dimensions.
Rotational velocities:
High resolution spectra of the H line are very useful for the determination of rotational velocities () of white dwarfs, which puts constraints on the evolution of angular momentum during stellar evolution. Two recent studies (Heber et al. [1997], Koester et al. [1998]) increased the number of determinations just to 54. It turned out that white dwarfs are generally very slow rotators with a few, puzzling exceptions.
Many spectra taken for the SPY project allow the determination of rotational velocities with better accuracy than previous studies. We started the systematic analysis of the present sample (one example is displayed in Fig. 9). The final sample will dramatically increase the number of white dwarfs with known rotational velocities and allow for the first time to explore trends of with, e.g., cooling age.
Chemical abundances:
High-resolution spectra are very valuable for the determination of surface compositions. Most white dwarfs have very pure atmospheres containing only hydrogen (DA) or helium (DO, DB). However, in the atmospheres of some hotter white dwarfs as well as in a fraction of cooler white dwarfs (types DZ, DAZ, DBZ) metal lines can be detected. Our understanding of this phenomenon is currently limited by the insufficient sample size of white dwarfs observed with high enough resolution. The largest published sample contains 38 white dwarfs observed with the HIRES spectrograph of the Keck I telescope (Zuckerman & Reid [1998]). It is obvious that SPY can help to improve the statistics by a large factor.
A few of the white dwarf candidates observed by SPY turned out to be subdwarf B stars (i.e. pre-white dwarfs with lower surface gravities). These stars display puzzling abundance patterns likely caused by diffusion processes (cf. Edelmann et al. [2002]). As an example for the resulting chemical abundance pattern we present in Fig. 10 our analysis of the binary HE 10470436 discussed above (Sect. 3.1).

5 Summary
SPY has now reached about mid term and it has already tripled the number of white dwarfs checked for RV variablity (from 200 to 600) and quadrupled the number of known DDs (from 18 to 72) compared to the results achieved during the last 20 years. Our sample includes many short period binaries (Napiwotzki et al. [2001a], [2001b]), several with masses closer to the Chandrasekhar limit than any system known before, greatly improving the statistics of DDs. We expect this survey to produce a sample of 150 to 200 DDs.
This will allow us not only to find several of the long sought potential SN Ia precursors (if they are DDs), but will also provide a census of the final binary configurations, hence an important test for the theory of close binary star evolution after mass and angular momentum losses through winds and common envelope phases, which are very difficult to model. An empirical calibration provides the most promising approach. A large sample of binary white dwarfs covering a wide range in parameter space is the most important ingredient for this task.
SPY produces a unique sample of white dwarf spectra with many spin-off opportunities, which will have a large impact on white dwarf science. We published a model atmosphere analysis of a first set of 200 white dwarfs (Koester et al. [2001]). This allowed us to construct a mass distribution of a large sample of white dwarfs and made this sample known to the community for further follow-up investigations. We are exploiting the SPY sample for two spin-off projects, which take advantage of the high spectral resolution: we study the kinematics of white dwarfs and determine their rotational velocities. Members of the community interested in spin-off opportunities are invited to participate in the exploitation of the SPY sample.
Acknowledgements.
We express our gratitude to the ESO staff, for providing invaluable help and conducting the service observations and pipeline reductions, which have made this work possible. We gratefully acknowledge the assistence of the Calar Alto staff. D.K. and D.H. thank the Deutsche Forschungsgemeinschaft (DFG) for their support (Ko 739/10-3). C.K. and E.-M.P. also acknowledge support by the DFG (Na 365/2-1). S.M. was supported by a grant (50 OR 96029-ZA) from the Bundesministerium für Bildung und Forschung through the DLR. L.Y. is supported by RFBR grant 99-02-16037 and “Program Astronomy” grant 1.4.4.1. This work was supported by DFG travel grants Na 365/3-1 and Na 365/4-1.References
- [1990] Bragaglia, A., Greggio, L., Renzini, A., D’Odorico, S.: 1990, ApJ, 365, L13
- [2001] Christlieb, N., Wisotzki, L., Reimers, D., et al.: 2001, A&A 366, 898
- [2000] Dekker, H., D’Odorico, S., Kaufer, A., Delabre, B., Kotzlowski, H.: 2000, Proc. SPIE 4008, 534
- [2002] Edelmann, H., Heber, U., Napiwotzki, R.: 2002, AN, these proceedings
- [2001] Ergma, E., Fedorova, A.V., Yungelson, L.R.: 2001, A&A 376, L9
-
[2001]
Fuhrmann, K.: 2001, A&A, submitted
(preprint available:
http://
www.usm.uni-muenchen.de/people/gehren/psdata/pap_100.pdf) - [1995] Hagen, H.-J., Groote, D., Engels, D., Reimers, D.: 1995, A&AS 111, 195
- [1997] Heber, U., Napiwotzki, R., Reid, I.N.: 1997, A&A 323, 819
- [1998] Homeier, D., Koester, D., Hagen, H.-J., et al.: 1998, A&A 338, 563
- [1984] Iben, I.Jr., Tutukov, A.V.: 1984, ApJS 54, 335
- [1997] Iben, I.Jr., Tutukov, A.V., Yungelson, L.R.: 1997, ApJ 475, 291
- [1997] Kilkenny, D., O’Donoghue, D., Koen, C., Stobie, R.S., Chen, A.: 1997 MNRAS 287, 867
- [1998] Koester, D., Dreizler, S., Weidemann, V., Allard, N.: 1998, A&A 338, 563
- [2001] Koester, D., Napiwotzki, R., Christlieb, N., et al.: 2001, A&A 378, 556
- [2000] Lamontagne, R., Demers, S., Wesemael, F., Fontaine, G., Irwin, M.J.: 2000, AJ 119, 241
- [2000] Leibundgut, B.: 2000, A&A Rev. 10, 179
- [2001] Leibundgut, B.: 2001, ARA&A 39, 67
- [2000] Livio, M. 2000: in “Type Ia Supernovae: Theory and Cosmology”, Cambridge Univ. Press, p. 33
- [2000] Marsh, T.R.: 2000, NewAR 44, 119
- [1999] Maxted, P.F.L., Marsh, T.R.: 1999, MNRAS 307, 122
- [2000a] Maxted, P.F.L., Marsh, T.R., Moran, C.K.J.: 2000a, MNRAS 319, 305
- [2000b] Maxted, P.F.L., Marsh, T.R., North, R.C.: 2000b, MNRAS 317, L41
- [1999] McCook, G.P., Sion, E.M.: 1999, ApJS 121, 1
- [1992] Munari, U., Renzini, A.: 1992, ApJ 397, L87
- [2001a] Napiwotzki, R., Edelmann, H., Heber, U., Karl, C., Drechsel, H., Pauli, E.-M., Christlieb, N.: 2001a, A&A 378, L17
- [2001b] Napiwotzki, R., Koester, K., Nelemans, G., et al.: 2001b, A&A, submitted
- [2001] Nelemans, G., Yungelson, L.R., Portegies Zwart, S.F., Verbunt, F.: 2001, A&A 365, 491
- [1992] Odenkirchen, M., Brosche, P.: 1992, AN 313, 69
- [1992] Press, W.H., Teukolsky, S.A., Vetterling, W.T., Flannery, B.P.: 1992, Numerical Recipes in FORTRAN, 2nd edition, Cambridge University Press
- [1998] Riess, A.G., Filippenko, A.V., Challis, P., et al.: 1998, AJ 116, 1009
- [1987] Robinson, E.L., Shafter, R.: 1987, ApJ 322, 296
- [1998] Saffer, R.A., Livio, M., Yungelson, L.R. 1998, ApJ 502, 394
- [1992] van den Heuvel, E.P.J., Bhattacharya, D., Nomoto, K., Rappaport, S.A.: 1992, A&A 262, 97
- [1973] Whelan, J., Iben, I.Jr.: 1973, ApJ 186, 1007
- [2000] Wisotzki, L., Christlieb, N., Bade, N., et al. 2000, A&A 358, 77
- [1998] Zuckerman, B., Reid, I.N.: 1998, ApJ 505, L143