Deep Near Infrared Observations of the X-ray Emitting Class 0 Protostar Candidates in the Orion Molecular Cloud-311affiliation: Based on data collected at Subaru Telescope, which is operated by the National Astronomical Observatory of Japan.
Abstract
We obtained near infrared (NIR) imaging with the Subaru Telescope of the class 0 protostar candidates in the Orion Molecular Cloud-3, two of which were discovered to have X-ray emission by the Chandra X-ray Observatory. We found strong evidence for the class 0 nature of the X-ray sources. First, our deep K-band image shows no emission brighter than 19.6 mag from both of these X-ray sources. Since class I protostars or class II T Tauri stars should be easily detected in the NIR with this sensitivity, the lack of K-band detection suggests that they are likely much more obscured than class I protostars. Second, our H2 S(1) image shows a bubble-like feature from one of the X-ray class 0 protostar candidates, which reinforces the idea that this is a class 0 protostar. We also discuss the nature of nine NIR sources found in our deep image based on their colors, spatial coincidence with millimeter cores, and the properties of their X-ray counterparts.
1 INTRODUCTION
Extensive mapping observations at various wavelengths have been performed in the Orion Molecular Cloud 2 and 3 (hereafter OMC-2/3) in the search for protostars. Chini et al. (1997) detected a chain of 21 cores (MMS1–MMS10 in OMC3, FIR1a–FIR6d in OMC-2) at 1.3 mm using Institut de Radio Astronomie Millimétrique (IRAM) telescope. Combining the James Clerk Maxwell Telescope (JCMT) photometry from 350 µm to 2 mm and the Infrared Astronomical Satellite (IRAS) photometry from 12 µm to 100 µm, they showed that the sub-millimeter luminosity (Lsubmm) of most cores dominates the bolometric luminosity (Lbol). Reipurth, Rodríguez & Chini (1999) observed the same region at 3.6 cm using Very Large Array (VLA), and reported the detection of eight 1.3 mm cores. Lis et al. (1998) discovered more than 30 cores (CSO1–CSO33) in OMC-2/3 at 350 µm, and found that all but one of the 1.3 mm cores have counterparts in 350 µm. Johnstone & Bally (1999) obtained images of this region in 450 µm and 850 µm. Further, Yu, Bally, & Devine (1997) studied this region with H2 S(1) (hereafter H2) emission line and found that about half of the 1.3 mm cores are associated with H2 jets. Aso et al. (2000) found that some cores are also accompanied by CO and HCO+ molecular outflows. All these indicate the existence of protostars, most of which are probably at the class 0 stage.
More astonishing is the detection of hard X-ray emission from two (MMS2 and MMS3) of the millimeter cores using the Chandra X-ray Observatory (Tsuboi et al., 2001). Due to the spatial coincidence with millimeter cores and their hard X-ray spectra, Tsuboi et al. (2001) proposed that they are the first candidates of the X-ray emitting class 0 protostars.
Previous radio and near infrared (NIR) observations indicate the existence of class 0 protostars at MMS2 and MMS3. However, their spatial resolution was not high enough to determine which X-ray source coincides with the class 0 protostar, particularly at MMS2 where there is a cluster of four X-ray sources. Clearly, follow-up observations with much higher spatial resolution, comparable to that of Chandra (positional accuracy of 01), are needed.
This paper reports the results of high resolution NIR imaging targeting the X-ray sources seen at MMS2 and MMS3.
2 OBSERVATIONS
Observations were performed using the Infrared Camera and Spectrograph (IRCS) at the Cassegrain focus of the Subaru Telescope (Tokunaga, 1998; Kobayashi et al., 2000). We took three broad-band (J, H, and K-band) and two narrow-band (H2 and K-continuum) images on 2000 November 30 and December 4. The seeing was 05 on both nights. The J, K, H2, and K-continuum exposure times were 600 seconds each, while the H exposure time was 300 seconds. IRCS provides a field of view (FOV) of 60″ 60″ with a pixel scale of 0058. With dithering, we covered a 90″ 90″ field encompassing both MMS2 and MMS3.
As we had no detection in J-band from two NIR sources at MMS2, we obtained an additional L′-band image of MMS2 with NSFCam (Leggett & Denault, 1996) at the Cassegrain focus of the Infrared Telescope Facility (IRTF) on 2000 December 23. The seeing was 10 and the integration time was 216 seconds. NSFCam provides a 38″38″ FOV with the pixel scale of 0148. With dithering, we obtained a 64″ 64″ field.
The images were reduced following the standard procedures using IRAF111IRAF is distributed by the National Optical Astronomy Observatories, which are operated by the Association of Universities for Research in Astronomy, Inc., under cooperative agreement with the National Science Foundation. : dark-subtraction, flat-fielding, sky-subtraction, and bad pixel removal for each frame, and correction for dithering to construct a final image.
3 RESULTS
3.1 Source Extraction and Photometry of Broad-band Images
SExtractor (Bertin & Arnouts, 1996) was used for source extraction and photometry. Nine sources (IRS1–IRS9) were extracted from the K-band image. (Table 1). For each K-band detected source, we performed a 10-aperture photometry of J, H, and K-bands. We transformed their magnitudes into the CIT system in the following way. Seven sources are listed in the Point Source Catalog of the 2MASS Second Incremental Data Release222http://www.ipac.caltech.edu/2mass/. Referring to their J, H, and Ks magnitudes, we derived a linear relation between IRCS and 2MASS magnitudes in each band. We first converted the IRCS magnitudes into 2MASS magnitudes using these relations and then into the CIT system using the formule given in Carpenter (2001).
For the L′-band image with NSFCam, we performed a 20-aperture photometry of IRS3, IRS4, and IRS5. We first calculated the magnitudes with the photometric zeropoint of 20.3 mag333http://irtf.ifa.hawaii.edu/Facility/nsfcam/hist/backgrounds.html, and then converted them into the CIT L-band color using
| (1) |
where we assume KKIRTF as the first order approximation.
3.2 Correlation with X-ray Sources
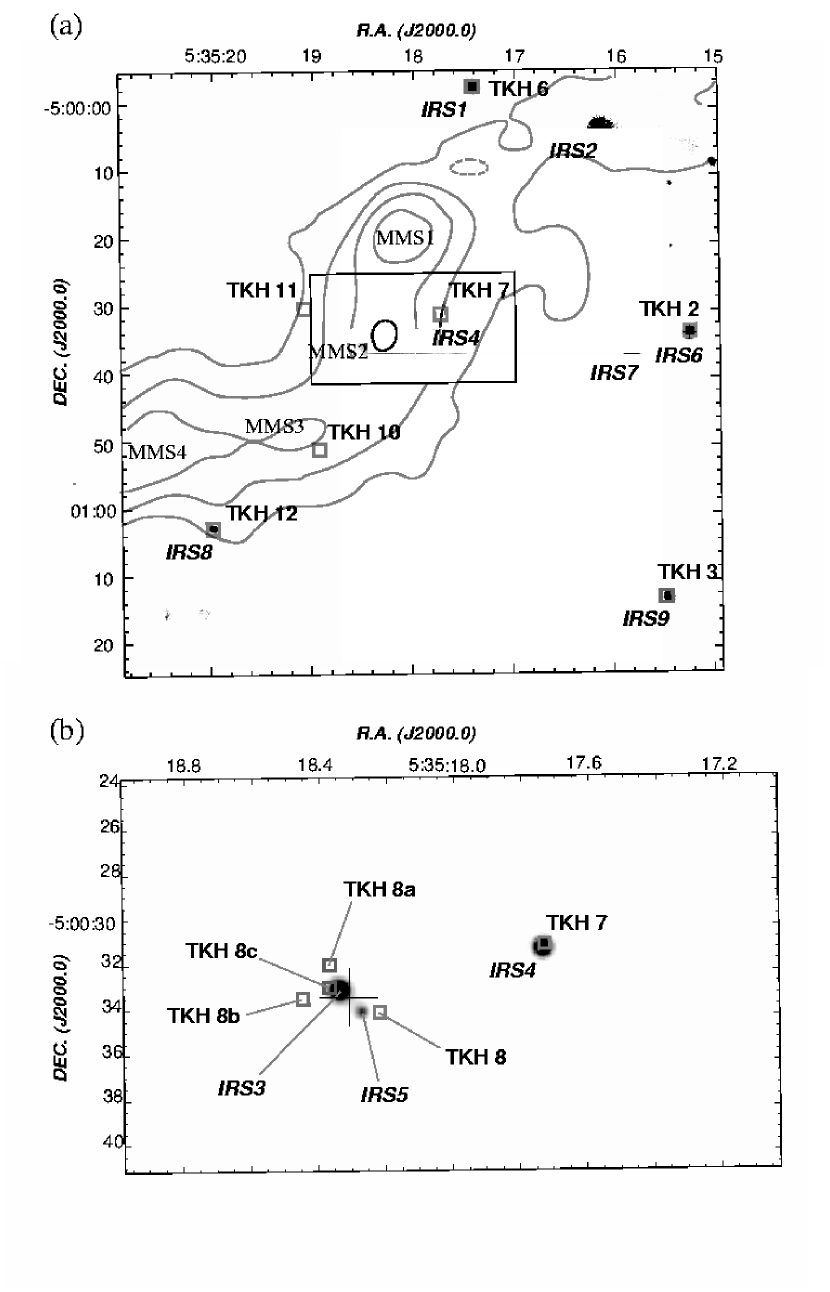
The X-ray counterpart was searched for each NIR source using the Chandra data given in Tsuboi et al. (2001). From the visual inspection of the NIR and X-ray images, the X-ray sources 6, 7, 2, 12, and 3 in Tsuboi et al. (2001) (hereafter we call them TKH 6, TKH 7, TKH 2, TKH 12, and TKH 3 ; the rests follow the same rule.) were identified to be the counterpart of IRS1, IRS4, IRS6, IRS8, and IRS9, respectively.
Two NIR sources (IRS3 and IRS5) and four X-ray sources (TKH 8, TKH 8a, TKH 8b, and TKH 8c) are found at MMS2. In order to find the X-ray counterpart of the NIR sources, we adjusted the X-ray image by shift and rotation so that each X-ray source (TKH 2, TKH 3, TKH 6, TKH 7, and TKH 12) comes closest to its NIR counterpart. After this procedure, the positional offset between the NIR sources and their X-ray counterparts is 025 rms (1).
Then, TKH 8c is found to be the closest source to IRS5 with separation of 046, hence is the X-ray counterpart of IRS5. On the other hand, IRS3 is separated by 081 from the closest X-ray source; TKH 8. Assuming that the separation between a NIR and X-ray counterpart pair follows a gaussian distribution of 025, the separation between IRS3 and TKH 8 is more than 3. We therefore conclude that TKH 8 is not the X-ray emission from IRS3. In fact, no separation larger than 081 is found in any other NIR and X-ray counterpart pairs. TKH 10 at MMS3, as well as TKH 8 at MMS2, has no NIR counterpart.
We chose several source-free regions near the positions of TKH 8 and TKH 10 for a 10-aperture photometry in order to estimate the 1 level of the background. We find the K-band upper limit of TKH 8 and TKH 10 to be 19.6 mag at the 3 level.
3.3 Narrow-band Images
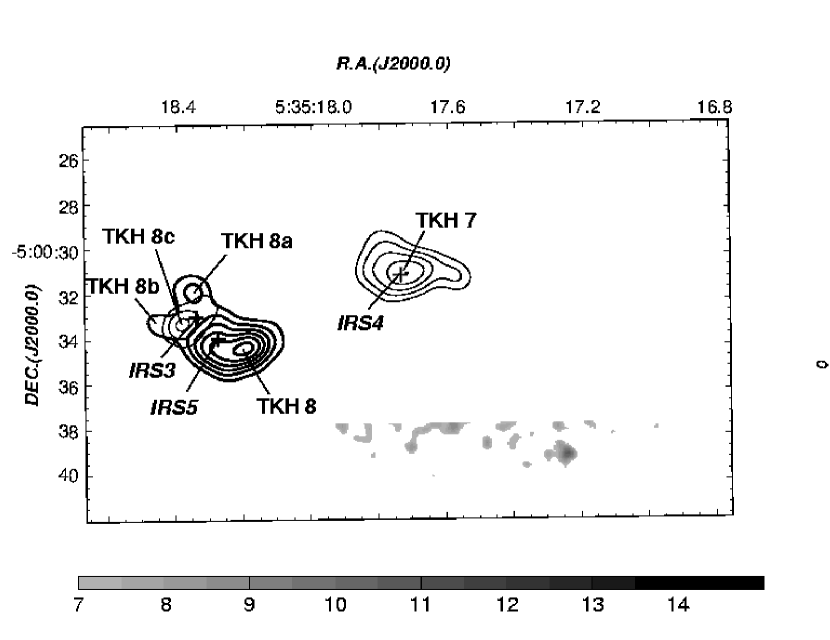
The vibrational-rotational transition of works as an effective coolant of the excited hydrogen molecules. Therefore this emission line serves as a powerful tool to search for jets from a protostar and the position of its powering source (Bally, 1993; Hodapp & Ladd, 1995). In a continuum-subtracted H2-band image, we identified a bubble-like feature originating from MMS2. A close-up view of this bubble-like emission is shown in Figure 2, where we see the origin of this feature spatially coincides with TKH 8. No similar feature was found for TKH 10 at MMS3.
4 DISCUSSION
4.1 The Nature of NIR Sources
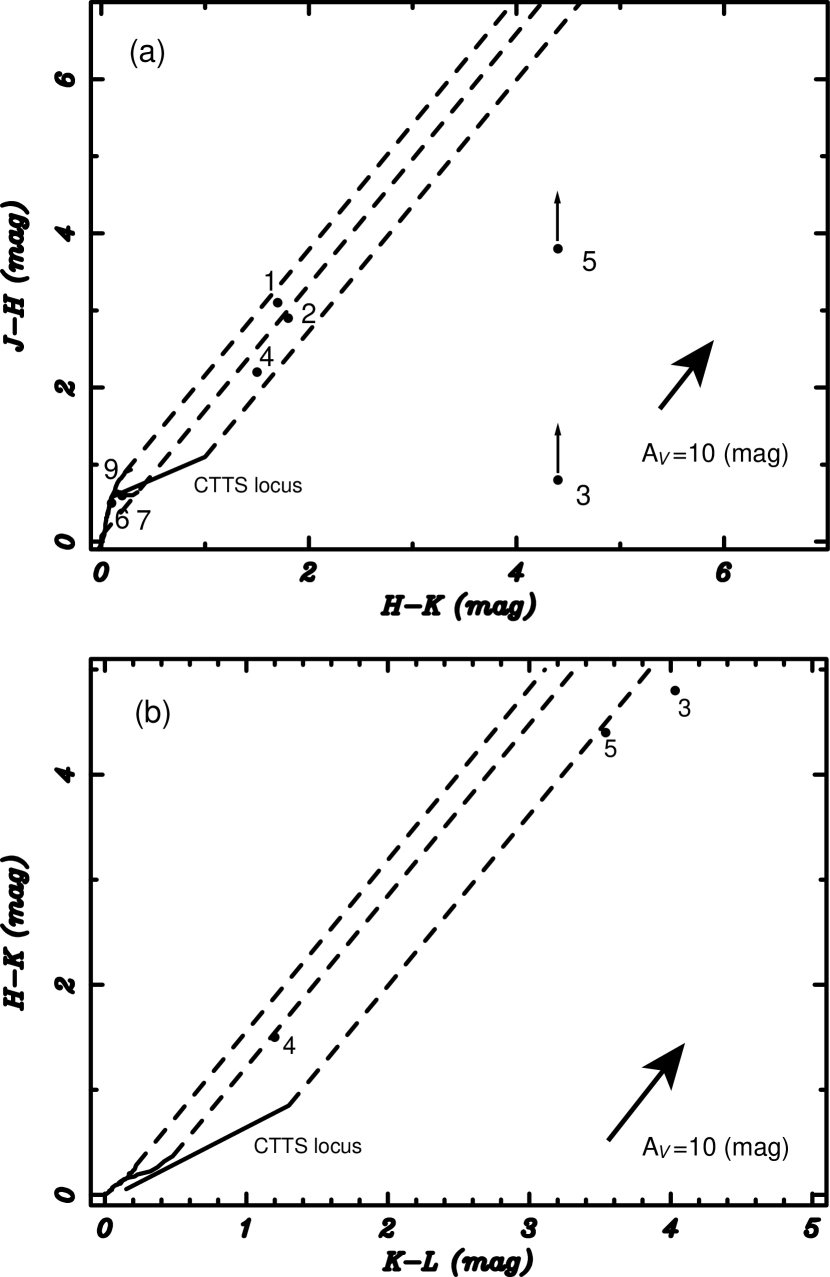
For the classification of Young Stellar Objects (YSOs), we use the NIR color-color diagram (Lada & Adams, 1992). The J–H/H–K diagram is given in Figure 3 (a). Since IRS3 and IRS5 have no positive detection in the J-band, we also give H–K/K–L diagram in Figure 3 (b).
In these diagrams, protostars and classical T Tauri stars (CTTS) are positioned right of the reddening vector where reddened photospheres by extinction are inaccessible, because they have redder colors due to an intense circumstellar disk emission. Thus they can be discriminated from weak-line T Tauri stars (WTTS). Protostars and CTTS can be separated from each other based on the amount of extinction. Protostars generally show larger extinction due to their richer circumstellar material than CTTS.
IRS3 and IRS5 are at the very center of a millimeter core (MMS2) and are located 134 ( 600 AU at the distance of 450 pc) apart from each other (Figure 1). Together with their large extinction of more than mag and large NIR excess seen in Figure 3 (b), they are class I protostars probably comprising a binary system.
IRS1, IRS2 and IRS4 are at the reddening region of the CTTS locus with a moderate extinction of mag (Figure 3a). They are located at the edge of 1.3 mm cores (Figure 1), thus are most likely to be CTTS.
IRS6, IRS7, and IRS9 are located away from the cloud cores (Figure 1) and have less extinction (Figure 3a). Among them, IRS6 and IRS9 are considered to be WTTS due to the association with X-ray emission. IRS7, which has no X-ray counterpart, may be a background source.
It is hard to infer the nature of IRS8 from NIR observation alone because it has only K-band detection. However, its X-ray counterpart (TKH 12) shows a thermal emission of 3.2 keV, erg sec-1, and 6cm-2 (Tsuboi et al., 2001). According to Tsujimoto et al. (2001) who derived a typical X-ray spectrum for protostars (class I), CTTS (class II), and WTTS (class III) in OMC-2/3, TKH 12 (IRS8) is most likely to be a class I protostar.
4.2 The X-ray Emitting Class 0 Protostar Candidates
Class 0 protostars are empirically characterized with the following features (Barsony, 1994) : 1) undetectable at wavelengths 10 µm, 2) a high ratio of Lsubmm/Lbol, 3) a relatively narrow spectral energy distribution resembling that of a single blackbody at T30 K, 4) presence of a molecular outflow, and additionally 5) existence of cm-wave continuum emission, and 6) presence of Herbig-Haro (HH) objects.
MMS2 and MMS3 were already found to have a high ratio of Lsubmm/Lbol (Chini et al., 1997). Tsuboi et al. (2001) proposed that hard X-ray sources at MMS2 and MMS3 are from class 0 protostars.
With a deep K-band imaging observation, we found that TKH 8 at MMS2 and TKH 10 at MMS3 have no NIR emission brighter than 19.6 mag. Class I protostars are generally detected at 10–14 mag and class II T Tauri stars are at 8–12 mag in K-band at the distance of 450 pc (for example, see Fig 24 in Aspin, Sandell, & Russel 1994). Class I and class II stars are therefore easily detected in the NIR with our sensitivity. In fact, two class I protostars at MMS2 (IRS3 and IRS5) show 13.2 mag and 11.4 mag in the K-band. TKH 8 and TKH 10 are fainter than these stars by more than 100 times. This suggests that they are much more obscured than class I protostars, namely at class 0.
A bubble-like emission in H2 from TKH 8 reinforces this idea. Yu, Bally, & Devine (1997) identified the H2 emission from MMS2 in a global scale. MMS2 is also accompanied by HH objects (Reipurth, Bally, & Devine, 1997), molecular outflows (Aso et al., 2000), and 3.6 cm continuum emission (Reipurth, Rodríguez & Chini, 1999). Our bubble-like feature is at the origin of these jet and outflow phenomena. Therefore, this H2 emission should be shock-excited by the jet from a protostar. The close-up view of this feature shows that the bubble has a length of 10″ ( AU) westward away from its central source. This morphology is observed in jets from class 0 protostars ( e.g., L 1448-mm and L 1448 IRS 2 ) (Davis et al., 1994; Eislöffel, 2000) . The well-collimated jet is typical of class 0’s, of which the surrounding material is still rich and the outflow can only go through narrow cavities near the pole (Hodapp, 1998). TKH 8, the powering source of the jet, is thus most likely to be the class 0 protostar.
5 SUMMARY
-
1.
In deep NIR imaging of the OMC-3 region, we detected nine K-band sources, and derived their J, H, and K-band magnitude. We also correlated them with the X-ray sources and found that six sources have the X-ray counterpart.
-
2.
Based on their J–H, H–K, and K–L colors, spatial coincidence with millimeter cores, and X-ray properties of their X-ray counterpart, we find that three are class I protostars, three are CTTS, two are WTTS, and one is a background source.
-
3.
With a deep K-band image, TKH 8 and TKH 10 were found to have no K-band emission brighter than 19.6 mag, suggesting that they are highly obscured sources than class I protostars, namely class 0 protostars. With a H2 S(1) image, a bubble-like feature was found to originate from TKH 8, reinforcing the class 0 nature of this source.
References
- Aso et al. (2000) Aso, Y., Tatematsu, K., Sekimoto, Y., Nakano, T., Umemoto, T., Koyama, K., & Yamamoto, S. 2000, ApJS, 131, 465
- Aspin, Sandell, & Russell (1994) Aspin, C., Sandell, G., & Russell, A. P. G. 1994, A&AS, 106, 165
- Bally (1993) Bally, J., Devine, D., Herald, M., & Rauscher, B. J. 1993, ApJ, 418, 75
- Barsony (1994) Barsony, M. 1994, in ASP Conf. Ser. 65, Clouds, Cores, and Low Mass Stars, ed. D. P. Clemens and R. Barvainis (San Francisco: ASP), 197
- Bertin & Arnouts (1996) Bertin, E. & Arnouts, S. 1996, A&A, 113, 393
- Carpenter (2001) Carpenter, J. M. 2001, AJ, 121, 2851
- Chini et al. (1997) Chini, R., Reipurth, B., Ward-Thompson, D., Bally, J., Nyman, L-Å, Sievers, A., & Billawala, Y. 1997, ApJ, 474, L135
- Davis et al. (1994) Davis, C. J., Dent, W. R. F., Matthews, H. E., Aspin, C., and Lightfoot, J. F. 1994, MNRAS, 266, 933
- Eislöffel (2000) Eislöffel, J. 2000, A&A, 354, 236
- Hodapp & Ladd (1995) Hodapp, K. W. & Ladd, E. F. 1995, ApJ, 453, 715
- Hodapp (1998) Hodapp, K-W. 1998, ApJ, 500, L183
- Johnstone & Bally (1999) Johnstone, D. & Bally, J. 1999, apj, 510, L49
- Kobayashi et al. (2000) Kobayashi, N., et al. 2000, Proc. of SPIE, 4008, 1056
- Lada & Adams (1992) Lada, C. J., & Adams, F. C. 1992, ApJ, 393, 278
- Leggett & Denault (1996) Leggett, S. & Denault, T. 1996, NSFCAM 256256 InSb Infrared Array Camera User’s Guide, Version 3, NASA Infrared Telescope Facility
- Lis et al. (1998) Lis, D. C., Serabyn, E., Dowell, C. D., Benford, D. J., Phillips, T. G., Hunter, T. R., & Wang, N. 1998, ApJ, 509, 299
- Meyer et al (1997) Meyer, M. R., Calvet, N., & Hillenbrandt, L. A. 1997, AJ, 114, 288
- Reipurth, Bally, & Devine (1997) Reipurth, B., Bally, J., & Devine, D. 1997, AJ, 114, 2708
- Reipurth, Rodríguez & Chini (1999) Reipurth, B., Rodríguez, L. F., & Chini, R. 1999, AJ, 118, 983
- Tokunaga (1998) Tokunaga, A. T., et al. 1998, Proc. of SPIE, 3354, 512
- Tokunaga (2000) Tokunaga, A. T. 2000, in Allen’s Astrophysical Quantities, ed. A. N. Cox, (4th ed.; New York: Springer-Verlag), 143
- Tsuboi et al. (2001) Tsuboi, Y., Koyama, K., Hamaguchi, K., Tatematsu, K., Sekimoto, Y., Bally, J., & Reipurth, B. 2001, ApJ, 554, 734
- Tsujimoto et al. (2001) Tsujimoto, M., Koyama, K., Tsuboi, Y., Goto, M., and Kobayashi, N. 2001, ApJ, 556, in press
- Yu, Bally, & Devine (1997) Yu, K. C., Bally, J., & Devine, D. 1997, ApJ, 485, L45
- Yun et al. (1997) Yun, J. L., Clemens, Dan P., Morelra, M. C., and Santos, N. C. 1997, ApJ, 479, L71
| Name | R.A.aaThe positions are determined from the IRCS K-band image in the equinox J2000.0. | DEC.aaThe positions are determined from the IRCS K-band image in the equinox J2000.0. | JbbAll magnitudes are in the CIT system. | HbbAll magnitudes are in the CIT system. | KbbAll magnitudes are in the CIT system. | LbbAll magnitudes are in the CIT system. | 2MASS | X-rayccThe X-ray counterpart with the source number in Tsuboi et al. (2001). |
|---|---|---|---|---|---|---|---|---|
| mag | mag | mag | mag | Identification | Identification | |||
| IRS1 | 05:35:17.415 | 04:59:57.24 | 17.8 | 14.7 | 13.0 | 0535174-045957 | X-6 | |
| IRS2 | 05:35:16.168 | 05:00:02.58 | 17.0 | 14.1 | 12.3 | 0535161-050002 | ||
| IRS3ddAssociated with MMS2. | 05:35:18.275 | 05:00:33.93 | 19.6 | 18.0 | 13.2 | 9.17 | 0535183-050033eeIRS3 and IRS5 are not resolved in the 2MASS data. | |
| IRS4 | 05:35:17.736 | 05:00:31.07 | 15.4 | 13.2 | 11.7 | 10.5 | 0535177-050031 | X-7 |
| IRS5ddAssociated with MMS2. | 05:35:18.340 | 05:00:33.01 | 19.6 | 15.8 | 11.4 | 7.86 | 0535183-050033eeIRS3 and IRS5 are not resolved in the 2MASS data. | X-8c |
| IRS6 | 05:35:15.265 | 05:00:33.47 | 13.3 | 12.7 | 12.5 | 0535152-050033 | X-2 | |
| IRS7 | 05:35:15.837 | 05:00:36.34 | 12.3 | 11.8 | 11.7 | 0535158-050036 | ||
| IRS8 | 05:35:19.980 | 05:01:02.64 | 19.6 | 18.8 | 14.4 | 0535199-050102 | X-12 | |
| IRS9 | 05:35:15.463 | 05:01:12.59 | 14.2 | 13.6 | 13.4 | 0535154-050112 | X-3 |