The shape of rotation curves: models vs. observations
Abstract
We discuss the shape and decomposition of rotation curves (RCs) of galaxies formed within growing cold dark matter halos. The outer RC shape correlates mainly with the surface brightness (SB), the luminous mass fraction, fd, and the bulge fraction. In order the shapes of RC depend significantly on luminosity, fd should be a strong function of mass (feedback). For the preferred values of fd (), the high SB models can be maximum disks only when the halos have a shallow core. The low SB models are sub-maximum disks. The residuals of the baryonic Tully-Fisher (TF) and mass-radius relations show a clear anti-correlation, but when one passes to the TF and L-R relations, the anti-correlation almost disappears. Therefore, the observed lack of correlation among the residuals of the last two relations should not be interpreted as an evidence of sub-maximal disks.
1. Introduction
The shape and amplitude of the rotation curves (RCs) reflect the mass distribution of luminous and dark matter in disk galaxies. The luminous mass distribution is inferred from the observed surface brightness and gas profiles after assuming a stellar mass-to-luminosity ratio M/L. The uncertainty in the determination of the M/L ratio is reflected in the large number of RC decomposition models proposed, from maximum disk hypothesis to sub-maximum disks to minimum disks. Whether luminous or dark matter dominates can in a first approximation be inferred from the shape of the RCs. If the luminous mass contribution to the gravitational potential is dynamically important, then the shapes of the RCs are expected to differ among galaxies with different surface brightness (SB) distributions. The dark matter halo modulates these differences and in the extreme case of dark halo dominion, the shapes of the RCs will be largely independent from the SB profile.
In this paper we will present the shape and decomposition of RCs of modeled disk galaxies within cold dark matter (CDM) halos and discuss these results in the light of the observations.
2. The model
The disk is build up within a growing CDM halo. We use the extended Press-Schechter approach to generate the statistical mass aggregation histories (MAHs) of the halos, and a generalized secondary infall model to calculate the virialization of the accreting mass shells (Avila-Reese et al. 1998). The evolution and structure of our CDM halos agree well with results from cosmological N-body simulations. The mass shells are assumed to have aligned rotation axis and to be in solid body rotation, with specific angular momentum given by , where , , Mv and are the total angular momentum, mass and energy of the halo at the shell virialization time . The spin parameter, , is assumed to be constant in time. As the result of the assembling of these mass shells, a present day halo ends with an angular momentum distribution close to the universal distribution found by Bullock et al. (2001). A fraction fd of the mass of each shell is assumed to cool down and form a disk in a dynamical time. The radial mass distribution of the infalling gas is calculated by equating its specific angular momentum to that of its final circular orbit in centrifugal equilibrium (detailed angular momentum conservation is assumed). The gravitational interaction of disk and halo is calculated using the adiabatic invariant formalism. As the result of this modeling, disks with a nearly exponential surface density distribution are formed (Firmani & Avila-Reese 2000, hereafter FA00; Avila-Reese & Firmani 2002). The local star formation (SF) is triggered by the Toomre gas gravitational instability criterion and self-regulated by a vertical disk balance between the energy input due to SNe and the turbulent energy dissipation in the ISM. The SF efficiency depends on the gas surface density determined mainly by , and on the gas accretion rate determined by the cosmological MAH. Finally, we consider the formation of a secular bulge using the Toomre criterion for the stellar disk.
In this paper we use a flat model with non-vanishing vacuum energy density () and the power spectrum normalized to COBE.
3. Shapes of rotation curves
Although the outer model RCs are not always flat, their shapes are smooth, showing a conspiracy between the dark and luminous matter distributions. The maximum of the RC is typically attained at 2-3 stellar scale radii, Rs. For a given mass, the outer shape of the RC correlates with the disk SB, the bulge-to-disk (b/d) ratio, and the galaxy mass fraction MMv. The MAH does not play major role in the outer RC shape but, for a given mass, it defines the amplitude of the RC (Vm) (see Fig. 4 in FA00).
We find that the higher the disk SB is, the steeper the declining shape of the RC (Fig. 1) and the larger the b/d ratio. In Fig. 2(a) we plot the outer slope of the RC, , vs the stellar central surface density for 20 models of M, fd=0.05, and the MAH and calculated randomly from the corresponding statistical distributions (see FA00). Filled and empty symbols are for models with b/d ratios larger and smaller than 0.1, respectively. is the logarithmic slope of the RCs at 2.2 and 5 Rs. Some observational works found similar correlations for the family of high SB galaxies (e.g., Casertano & van Gorkom 1990; Verheijen 1997, who also included low SB galaxies), and in the extreme of low SB, it is well known that low SB galaxies have typically rising RCs (de Blok & McGaugh 1997). As is smaller, the gaseous disk is more concentrated and the stellar disk is more unstable giving rise to high SBs and large b/d ratios as well as to more peaked RCs. As seen in Fig. 1, for the range of the most probable values of and for this may happen in spite of the CDM halos being cuspy. Nevertheless, for these halos, only the more concentrated disks may resemble the maximum disk solution and only very few models (low SB) present rising RCs. We will return to this question below.
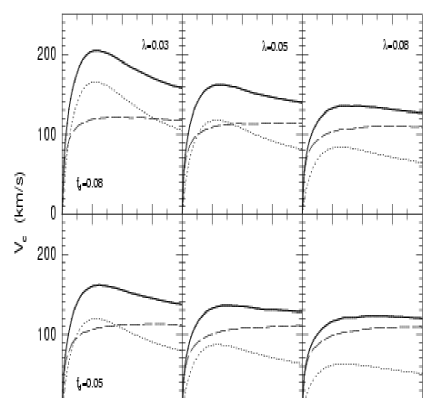
In Fig. 1 one sees that as fd gets larger, the more declining is the outer RC slope. In our models the fraction of galaxy mass is a free parameter. The gas cooling efficiency within the dark halos can be a function of mass; in large halos the cooling time tends to be larger than the Hubble time in such a way that only a fraction of the original baryons could be in the galaxy. At the other extreme, very small systems may lose significant fractions of gas due to SF activity (SNe). Calculations taking into account these two processes indeed show that fd may be times the original baryon-to-dark matter fraction in the CDM halos (van den Bosch 2001). These calculations show that the final fd of the halos does not follow a particular trend with Mv; if any, smaller halos have on average smaller fd’s than larger halos. On the other hand, the original baryon-to-dark matter fraction in the halos can not be larger than the universal fraction, which for has a central value of . Cosmological simulations have recently shown that due to the gas heating in the shocks during the formation of filaments, only roughly one third of the baryons are trapped within collapsed galaxy halos at (Davé et al. 2001). Therefore, on the ground of all these theoretical calculations, one may expect that the galaxy-to-halo mass fraction in halos is on average . Estimates of this fraction for our Galaxy and other galaxies indeed suggest similar values.
Modelers have commonly used values of 0.05 for fd (e.g., Mo et al. 1998; FA00). For this value, model disks with ( of the distribution) have typically highly declining RCs to be realistic. Since disk component dominates strongly in these cases, the disk is dynamically unstable and probably turns into a spherical system. As fd gets smaller, the disk component becomes less dominant (Fig. 1) and, therefore, models with smaller ’s can still be stable. On the other hand, for fd=0.05 low SB galaxies will be those with ( of the distribution). The SB distribution of disk galaxies shows that more than 50% of them are probably of low SB type (de Jong & Lacey 2000). Using , (i) the low SB galaxies are those with (now more than 50%) and (ii) high SB models with have still realistic RCs.

Finally, we find that the outer RC correlates slightly with mass (luminosity) in the sense that massive systems tend to have declining RCs at one optical radius for example, while for the smallest systems the RCs are slightly rising at this radius. At first glance this could seem to be in conflict with the CDM halos: the less massive halos are more concentrated than the more massive ones. However, the central surface density of the model disks increases with the mass as M with (see also Dalcanton et al. 1997), and as discussed above, the outer shape of the RCs correlates with the disk surface density. In Fig. 2 squares are models with the average MAHs, , but with 3 different masses, M, from left to right, respectively. The plot shows that the mass dependence of is mainly due to the dependence of Mv on SB. From an analysis of a large sample of late-type galaxy RCs, Persic et al. (1996) concluded that RCs follow an universal trend which depends only on luminosity, L. The RCs of our models could be more dependent on L if fd would depend on mass. We have mentioned above that for small galaxies (dwarfs), fd could be on average smaller than for massive ones; feedback is probably important for the small galaxies.
We conclude that model galaxies have different RC shapes, which correlate primarily with the disk SB (determined mainly by ) and fd. A dependence on L as suggested by Persic et al. (1996) may appear but as a secondary effect, due to the dependence of the SB and fd on the mass. A more careful comparison of model and observed RCs could allow us to put some constraints on the value and dependence on mass of the unknown parameter fd.
3.1. Rotation curve decompositions
From Fig. 1 one sees that the halo component dominates in the RC decomposition of models with fd=0.05 and . In other words, models with SB typical for normal high SB galaxies are sub-maximal (FA00; Avila-Reese & Firmani 2002). If , as theoretical and observational arguments hint (see above), then even for the highest SB galaxies the halo component will be dominant in the center, i.e. all the models are sub-maximum disks, the low SB ones tending to the minimum disk case. Observations suggest that HSB galaxies tend to the maximum disk case (e.g., Corsini et al. 1998; Salucci & Persic 1999; Palunas & Williams 2000). Comparison of population synthesis models with the photometric properties of HSB galaxies also point to mass-to-luminosity ratios corresponding to the maximum disk case (e.g., Bell & de Jong 2001). Theoretical arguments as the swing amplifier constraints also suggest central luminous matter dominion in HSB galaxies.
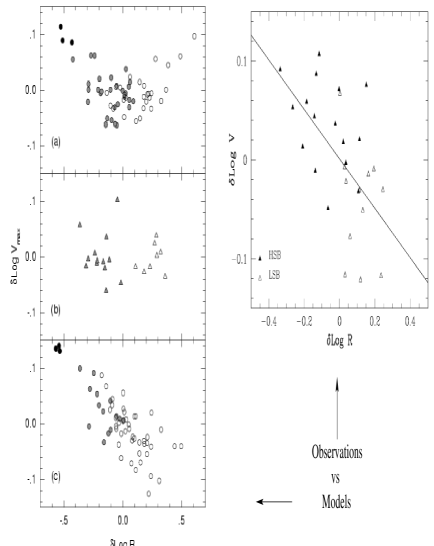
The model RC decompositions are dominated by the dark component because the CDM halos are cuspy. Observations of the RCs of dark-matter-dominated galaxies point to halo central mass distributions that are less concentrated than what CDM predicts. Recent high resolution H (Blais-Ouellete et al. 2000; see this volume), HI (Côtè et al. 2000) and CO (Bolatto et al. 2002) RC observations for dwarf galaxies, and HI and H RC observations for low SB galaxies (de Blok et al. 2001; Marchesini et al. 2002) show that the inner density profile of halos is much shallower than r-1. Using data for dwarf and LSB galaxies and cluster of galaxies, Firmani et al. (2001) inferred the scaling laws of the halo cores: the central density does not depend on mass, and the core radius increases roughly proportional to Vm. Using these scaling laws, we artificially smoothed the central density profiles of our CDM halos. The RC decompositions obtained for these shallow CDM halos show central dominance of the disk component over the halo for models with and 0.035 when and 0.03, respectively. In other words, high SB model disks are now close to the maximum disk solution (more the models with than those with ). As the SB decreases, the models are more and more dark-halo-dominated. Low SB galaxies indeed seem to be sub-maximum disks; a maximum disk solution for these galaxies demands too high M/L ratios from the stellar population point of view (de Blok et al. 2001). Also, the outer logarithmic slope of RCs of model galaxies increase on average when the soft core is introduced, in better agreement with observations (panel b in Fig. 2).
4. Correlation among the residuals of the L-Vm and L-Rs relations: are disk galaxies sub-maximal?
As mentioned in the introduction, if dark matter dominates strongly, then variations in the disk density will not affect significantly the shape and amplitude of the RC, and in particular the Vm, for a given disk mass. Courteau & Rix (1998; hereafter CR98) studied this question in a statistical sense by using the Tully-Fisher (TF) and L-Rs relations. They considered that if the halo component dominates for most of galaxies, then the residuals of the TF relation should not correlate with the residuals of the L-Rs relation, i.e. with the SB of the disk. CR98 analyzed two large observational samples of high SB galaxies and found a very small correlation among the residuals of these relations. So they concluded that high SB galaxies are sub-maximum disks. On the other hand, observations suggest a dependence of the shape of RCs with SB (see §3). It would seem that these two observational results are at odds one with the other.
According to the models, the shape of RCs may depend on the SB (Fig. 1) and, at the same time, the residuals among the infrared TF and L-Rs relations may not be correlated. In Fig. 2(a) we show lgVm, the residual of the TF relation vs. lgRs, the residual of the L-Rs relation. The filled circles are for high SB models while empty circles are for low SB models. The observational sample used by CR98 has values of lgR between -0.3 and 0.3. Within this range there is a good agreement between models and observations; high SB galaxies show a small negative gradient while for low SB models this behavior is reversed. On average, for galaxies of typical SBs (not very high or not very low SBs) the correlation vanishes. This is because, for a given mass, not only Vm (or V2.2) decreases as the SB decreases, but also the stellar disk mass, Ms (or L); according to our SF mechanism, the efficiency of transformation of gas into stars is lower as the surface density is smaller. In panel (b) of Fig. 2 we plot the non-disturbed galaxies from the homogeneous and complete sample of galaxies of the Ursa Major cluster from Verheijen (1997). The observations follow roughly the same behavior of the high and low SB models!
The argument that dark halo dominance in the RC decomposition implies no correlation among the residuals of the TF and L-Rs relations (CR98) applies for the total disk mass (baryonic mass), i.e. when instead of L (or Ms) we use the total (stars+gas) disk mass, Md. When one passes from Md to L or Ms the compensation effect due to the dependence of SF efficiency on SB eliminates the correlation among the residuals of the TF and L-R relations if it exists. This is why also the residuals of the TF relation are not correlated with SB, and the TF relation of high and low SB galaxies is roughly the same (see FA00). In panel (c) of Fig. 2 we plot the residuals of the Md-Vm and Md-Rs relations for the same models of panel (a) (where was used). The average slope of the correlation is (this slope is for maximum disks). If a shallow core is introduced (see §3.1), then the slope is steeper, . For the slope results close to and for the cuspy and shallow CDM halos, respectively.
Do observations show a correlation among the residuals of the Md-Vm and Md-Rs relations? In order to answer this question we constructed the baryonic TF and Md-Rs relations using the data from Verheijen (1997) with a distance to Ursa Major of 20.7 Mpc. The residuals from these relations are shown in Fig. 3(d). In order to calculate Md we used the fiducial M/LK-() relation presented in Bell & de Jong (2001), and for the LSB galaxies we used the M/LK obtained by Verheijen (1997) for the unconstrained fits of the RCs to an isothermal model. The gas mass was estimated from the integrated HI flux, taking into account the fraction of He and H2. The approximate slope of the correlation among the residuals is . This is in agreement with our models with and shallow cores, although due to the large uncertainties in the observational derivation we do not think that we are able to constrain between cuspy or shallow halos. If fd is much larger than 0.03, the observational inference is pointing to dark-matter-dominated galaxies, i.e. cuspy halos. Nevertheless, we have already seen that several arguments suggest .
5. Conclusions
The outer RCs of disk galaxies formed within CDM halos, assuming detailed angular momentum conservation, tend to be more declining as the SB, b/d ratio, galaxy mass fraction fd, and mass (luminosity) gets larger. The dominant correlation is the SB one and the key parameter is . Since the mass correlates with SB, then the RC shape correlates with L, but an extra correlation of fd with mass (feedback?) is necessary to reproduce Persic et al. (1996) synthetic RCs. For fd=0.05 the halo component dominates typically in the RC decomposition and only the highest SB models tend to be maximum disks.
Several arguments suggest , with probably a small dependence on mass. For this case, given the -distribution, more than 50% of disk galaxies are of low SB and the RCs are still realistic for . On the other hand, even the highest SB models are sub-maximum disks. Introducing shallow cores in the CDM halos, models with (high SB) are close to the maximum disk solution. As the SB decreases, the model tends to the minimum disk solution.
Galaxy models of high and low surface density are segregated in the baryonic TF relation. Therefore, the (anti) correlation among the residuals of the Md-Vm and Md-Rs relations is significant. However, when one passes to the TF and L-Rs relations the correlation almost disappears, but the correlation of the RC shape with SB remains, in agreement with observations. This is because as the SB is higher, not only Vm is larger for a given mass, but the luminosity also (the SF efficiency depends on SB!). Thus, models of high and low SB shift along the main TF relation. The lack of correlation among the residuals of the L-Vm and L-R relations should not be interpreted as an evidence of sub-maximal disks, where the RC shape does not depend on SB.
A first comparison of the correlation among the residuals of the baryonic TF and Md-Rs relations inferred from observations and models suggest that if , then the observed galaxies are strongly dark-matter-dominated in the center. For the better preferred values of , the slope of the observed correlation is in better agreement with models with shallow halos.
Acknowledgments.
V.A. thanks the organizers for financial support in order to attend to the meeting, and J.C. Yustis for computational assistance. This work was supported by CONACyT grant 33776-E to V.A.
References
Avila-Reese, V. & Firmani, C. 2002, ASP Conf. Series, in press (astro-ph/0202195)
Avila-Reese, V., Firmani, C. & Hernández X. 1998, ApJ, 505, 37
Bell, E. & de Jong, R.S. 2001, ApJ, 550, 212
Blais-Ouellete, C., Amram, P. & Carignan, C. 2000, AJ, 121, 2524
Bolatto, A. D. et al. 2002, ApJ, 565, 238
Bullock, J. et al. 2001, ApJ, 555, 240
Casertano, S. & van Gorkom, J.H. 1991, AJ, 101, 1231
Côtè, S, Carignan, C. & Freeman, K. 2000, AJ, 120, 3027
Corsini, E.M. et al., 1998, A&A, 342, 671
Courteau, S., & Rix, H-W. 1998, ApJ, 513, 561 (CR98)
Dalcanton J.J., Spergel D.N., & Summers F.J., 1997, ApJ, 482, 659
Davé, R. et al. 2001, ApJ, 552, 473
de Blok, W.J.G. & McGaugh, S.S 1997, MNRAS, 290, 533
de Blok, W.J.G, McGaugh, S. S. & Rubin, V. C. 2001, AJ, 122, 2396
de Jong, R.S. & Lacey, C. 2000, ApJ, 545, 781
Firmani, C. & Avila-Reese, V. 2000, MNRAS, 315, 457 (FA00)
Firmani, C. et al. 2001, MNRAS, 321, 713
Marchesini, D. et al. 2002, astro-ph/0202075
McGaugh S.S. & de Blok W.J.G., 1997, ApJ, 481, 689
Mo H.J., Mao S. & White S.D.M., 1998, MNRAS, 295, 319
Palunas, P. & Williams, T.B. 2000, AJ, 120, 2884
Persic, M., Salucci, P. & Stel, F. 1996, MNRAS, 281, 27
Salucci P. & Persic M. 1999, A&A, 351, 442
van den Bosch, F.C., 2001, MNRAS, in press (astro-ph/0112566v1)
Verheijen, M.A.W., 1997, PhD. Thesis, Groningen University