Neutral hydrogen in dwarf galaxies
This paper is the first in a series presenting a sample of 30 late-type dwarf galaxies, observed with the Westerbork Synthesis Radio Telescope (WSRT) in the 21-cm line of neutral atomic hydrogen (HI). The sample itself, the HI content of and the HI distribution in the sample galaxies are briefly discussed. Four sample galaxies were also detected in the continuum.
Key Words.:
galaxies: irregular dwarf galaxies – HI emission1 Introduction.
Galaxies come in a wide variety of shapes and sizes. The larger galaxies are usually accompanied by a number of smaller (dwarf) galaxies, although dwarf galaxies also occur by themselves. Late-type dwarf galaxies are generally rich in neutral atomic hydrogen (HI) gas, usually more so than much larger late type spiral galaxies. Their optical luminosity can vary considerable. Blue, compact dwarf galaxies (BCGD) which appear subject to intense star formation are relatively easy to observe. More quiescent, redder galaxies are not so easy to find, especially if they have low surface brightnesses (LSB). The ratio of HI-mass to light is higher in dwarf galaxies than in much larger galaxies of high luminosity (e.g. Roberts Haynes 1994). The 21-cm HI line is therefore an excellent tool for finding dwarf galaxies many of which otherwise might escape attention. Many HI line surveys exist, for example those by Fisher Tully (1975, 1981), Thuan Seitzer (1979), Thuan Martin (1981), Hoffman et al. (1987). However, only radio interferometers provide sufficient spatial resolution to study the actual HI structure of dwarf galaxies. This is important, because relatively easily observed neutral hydrogen is the major constituent of the interstellar medium in galaxies (cf. Israel, 1988).
2 The galaxy sample
In constructing our observing sample, we have based ourselves on the compilation by Melisse Israel (1994) of galaxies classified Im and Sm, and limited ourselves to those galaxies that are in the northern hemisphere , i.e. have declinations above 14∘ so as to be observable with the WSRT). There is no single unambiguous definition of a dwarf galaxy. Often, a galaxy is considered to be a dwarf if its absolute luminosity corresponds to the light of no more than half a billion suns (), about one per cent of the luminosity of a spiral galaxy such as the Milky Way or M 31. Although guided by this definition, we have not strictly adhered to it. Rather, we have selected a sample of mostly Im galaxies primarily chosen to cover a range of optical properties, in particular colour. Sample galaxy colours range from to . No attempt was made to define a complete sample. Basic information on the sample galaxies is given in Table 1.
| Name | Fringe Stopping Center | dist. | log | group | Other names | ||||
| Mpc | mag | mag | W m-2 | ||||||
| [1] | [2] | [3] | [4] | [5] | [6] | [7] | [8] | [9] | [10] |
| D 22 | G7 | U 2014 | |||||||
| D 43 | close to G6 | U 3860 | |||||||
| D 46 | close to G6 | U 3966 | |||||||
| D 47 | N 2683 | U 3974 | |||||||
| D 48 | N 2549 | U 4121 | |||||||
| N 2537 | a | U 4274,Mk 86 | |||||||
| U 4278 | a | U 4274,Mk 86 | |||||||
| D 52 | close to G6 | U 4426 | |||||||
| D 63 | M81;L 176 | U 5139,Ho I | |||||||
| N 2976 | M81;L 176 | U 5221 | |||||||
| D 64 | N 2903b | U 5272 | |||||||
| D 68 | N 2903 | U 5340 | |||||||
| D 73 | G42 | U 5478 | |||||||
| D 83 | G12 | U 5764 | |||||||
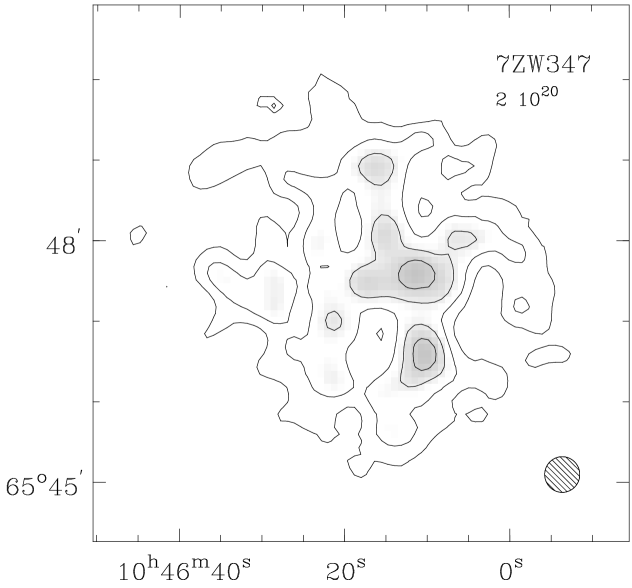
| D 87 | M81 | U 5918,7Zw347 | |||||||
| Mk 178 | U 6541 | ||||||||
| N 3738 | : | U 6565,Arp 234 | |||||||
| D 101 | CVn II(G10) | U 6900 | |||||||
| D 123 | close to G10 | U 7534 | |||||||
| Mk 209 | L 290? | 1Zw36 | |||||||
| D 125 | L 290c | U 7577 | |||||||
| D 133 | CVn I (G3);L 291 | U 7698 | |||||||
| D 165 | N 4236 | U 8201 | |||||||
| D 166 | N 5033d;L 334 | U 8303,Ho VIII | |||||||
| D 168 | Uma/M101;L 347 | U 8320 | |||||||
| D 185 | M101 (G5); L 371 | U 8837,Ho IV | |||||||
| D 190 | (Uma/M101) | U 9240 | |||||||
| D 216 | Local Group | U 12613e | |||||||
| D 217 | N 7640 | U 12632 | |||||||
Column Designations: [1] Object name: D = DDO, Mk = Markarian, N = NGC,
U = UGC; [2, 3] Adopted position for aperture synthesis fringe-stopping
center; [4] Distances
compiled from the literature. Stellar distances for DDO 63,
NGC 2976, NGC 3738, DDO 165,
DDO 168 and DDO 216 (Karachentsev Tikhonov 1994;
Rozanski Rowan-Robinson 1994). Group distances from the larger spiral
group members and based on stellar indicators wherever possible
(Rowan-Robinson 1988, Rozanski Rowan-Robinson 1994) and the blue
Tully-Fisher relation (Kraan-Korteweg et al. 1988; data from
de Vaucouleurs et al. 1991). For a few galaxies recession velocities
were used, corrected for Local Group peculiar motion and H0 = 75
Mpc-1. [5] Distance quality flag: 1 = reliable distance from
two or more independent indicators (excluding Hubble expansion); 2 =
distance from only one reliable indicator; 3 = tentative distance based
on group membership or recession velocity. [6, 7, 8] Absolute B band
magnitudes, corrected for Galactic foreground absorption, () colours
and log(FIR) luminosities all taken from Melisse Israel (1994); [9]
Group membership according to de Vaucouleurs et al. (1983). Objects
appearing as a group member in Garcia (1993) are listed as L = LGG.
[10] Any other names, mostly UGC.
Notes : a: NGC 2537 and UGC 4278 are a pair of
galaxies; The galaxy NGC 2537A (,
) could be associated with this pair, but
it is not visible in the HI data. b: DDO 64 has a small
companion (see text); c: DDO 125 is a companion of the irregular
galaxy NGC 4449; d: DDO 166 is probably a
companion of NGC 5033; e: DDO 216 is also
called Pegasus dwarf galaxy.
| Name | Neighbours | proj. dist. | type | ||
|---|---|---|---|---|---|
| kpc | |||||
| [1] | [2] | [3] | [4] | [5] | [6] |
| DDO 47 | CGCG 087-033 | – | |||
| NGC 2537 | NGC 2537A | SBc | |||
| UGC 4278 | SBd | ||||
| DDO 64 | UGC 5272A | ||||
| DDO 125 | DDO 129 | Im | |||
| NGC 4449 | IBm | ||||
| MCG+07-26-012 | – | ||||
| UGC 7690 | Im: | ||||
| MCG+07-26-011 | – | ||||
| NGC 4460 | SB | ||||
| DDO 166 | UGC 8314 | Im: | |||
| NGC 5014 | Sa? | ||||
| NGC 5033 | SAc Sy1.9 | ||||
| DDO 168 | DDO 167 | Im | () | ||
| UGC 8215 | Im | () | |||
| DDO 169 | IAm |
Note: Column 4 lists velocity difference (neighbour - sample dwarf) and column 6 the B-magnitude difference (neighbour - sample dwarf), i.e. positive if the neighbour is less luminous.
| Name | Neighbours | proj. dist. | type | ||
|---|---|---|---|---|---|
| kpc | |||||
| [1] | [2] | [3] | [4] | [5] | [6] |
| DDO 48 | NGC 4241 | Sab | |||
| IC 2209 | GROUP | ||||
| NGC 2460 | SAa | ||||
| DDO 52 | PGC 22900 | I? | 0.3 | ||
| UGC 4278 | SBd | ||||
| NGC 2537 | SBm pec | ||||
| DDO 83 | DDO 84 | Im | |||
| NGC 3413 | S0 | ||||
| NGC 3274 | SABd? | ||||
| DDO 123a | (NGC 4605) | () | () | (SBc pec) | () |
| UGC 6931 | SBm | ||||
| UGC 6926 | Sdm | ||||
| UGC 7544 | dwarf | () | |||
| UGC 8146 | Scd | ||||
| DDO 165b | UGC 7748 | Sdm: | |||
| UGC 7490 | SAm | ||||
| NGC 4236 | SBdm |
Note: Columns as in Table 2; a: Only the nearest five objects in the field are listed here. NGC 4605 is ouside the velocity range of 500 . b: DDO 165 was added to this list because the high relative velocity of UGC 7748 suggests that this galaxy could be a background object.
The majority of the galaxies in the sample (21 out of 29 objects) are ‘true’ dwarfs in the sense that their luminosity does not exceed . Four objects (UGC 4278, DDO 123, DDO 166 and DDO 217) are brighter than . All but four galaxies are classified Im (Magellanic irregular). Exceptions are DDO 48 (SBm), NGC 2976 (Sd), DDO 185 (SBm) and DDO 217 (Sm). This sample is much larger than the number of dwarf galaxies previously studied in HI at comparable resolutions, such as the VLA-based studies by Lo et al. (1993) and Puche Westpfahl (1993), and the individual case studies listed in the inventory given by Salpeter Hoffman (1996).
| Name | obsdate | SP | BW | ||
|---|---|---|---|---|---|
| YYMMDD | m | MHz | |||
| [1] | [2] | [3] | [4] | [5] | [6] |
| D 22 | 911006 | 72 | 570 | 2.50 | 4.12 |
| D 43 | 861217 | 72 | 355 | 1.25 | 4.12 |
| D 46 | 861222 | 72 | 364 | 1.25 | 4.12 |
| D 47 | 911019 | 72 | 265 | 2.50 | 4.12 |
| D 48 | 881021 | 72 | 1183 | 2.50 | 4.12 |
| N 2537 | 911109 | 72 | 450 | 2.50 | 4.12 |
| D 52 | 861228 | 72,72 | 392 | 1.25 | 4.12 |
| D 63 | 911006 | 72 | 140 | 2.50 | 4.12 |
| N 2976 | 870702 | 36,72 | 60 | 2.50 | 8.24 |
| D 64 | 840722 | 36 | 520 | 1.25 | 4.12 |
| D 68 | 840721 | 36 | 504 | 1.25 | 4.12 |
| D 73 | 911108 | 72,72 | 1370 | 2.50 | 4.12 |
| D 83 | 911010 | 72 | 585 | 2.50 | 4.12 |
| D 87 | 911011 | 72 | 335 | 2.50 | 4.12 |
| Mk 178 | 910831 | 72 | 240 | 1.25 | 2.06 |
| N 3738 | 911012 | 72 | 225 | 2.50 | 4.12 |
| D 101 | 911013 | 72 | 550 | 2.50 | 4.12 |
| D 123 | 900910 | 36,72 | 723 | 2.50 | 4.12 |
| Mk 209 | 910902 | 72 | 240 | 1.25 | 2.06 |
| D 125 | 911017 | 72 | 195 | 2.50 | 4.12 |
| D 133 | 910906 | 72 | 331 | 1.25 | 2.06 |
| D 165 | 870507 | 54 | 33 | 1.25 | 4.12 |
| D 166 | 881016 | 72 | 1009 | 2.50 | 4.12 |
| D 168 | 911019 | 72 | 200 | 2.50 | 4.12 |
| D 185 | 910907 | 72 | 141 | 1.25 | 2.06 |
| D 190 | 861228 | 72 | 153 | 1.25 | 4.12 |
| D 216 | 911020 | 72 | -180 | 2.50 | 4.12 |
| D 217 | 840716 | 36 | 424 | 1.25 | 4.12 |
Interactions may have a profound effect on structure and evolution of galaxies, especially dwarf galaxies. We have therefore searched the NED111The NASA/IPAC Extragalactic Database (NED) is operated by the Jet propulsion Laboratory, California Institute of Technology, under contract with the National Aeronautics and Space Administration for galaxies within of the objects in our sample. This field of view corresponds to a linear size of 900 kpc at 5 Mpc, the median distance of the sample galaxies. Most of the sample dwarf galaxies are in groups, but not necessarily close to massive members. As satellites of the Galaxy or of M31 are usually found within a radius of 100-200 kpc and with a relative velocity of a few hundred (Lynden-Bell, 1994), we have first listed dwarfs with such relatively nearby neighbours in Table 2. The predominance of positive velocity differences reflects a bias caused by the large velocity window as compared to the typical systemic velocity. The resulting large volume effect introduces more interlopers at higher velocities.
Six dwarf galaxies have such nearby companions. NGC 2537, and UGC 4278 are close enough in space and velocity to include in a single WSRT field of view. The other companion, NGC 2537A is not visible in the WSRT field. Neither is is CGCG 087-033, a companion of DDO 47, discovered by Walter Brinks (2001). The dwarf companion of DDO 64 (=UGC 5272) was first described by Hopp Schulte-Ladbeck (1991) and is referred to as UGC 5272B following these authors. It can likewise be included with DDO 64 in a single WSRT field. Although there are no large nearby galaxies, the dwarfs UGC 5209, UGC 5186, DDO 68, UGC 5427 and UGC 5464 occur not far away (projected distance less than 500 kpc and velocites within 40 ). DDO 125 is located near the edge of the large HI halo of the irregular galaxy NGC 4449 (Bajaja et al. 1994). DDO 166 is a member of the NGC 5033 group. Both NGC 5033 and UGC 8314 can be included in the same WSRT observation. Finally, DDO 168 is not far from the low-luminosity dwarf DDO 167. NGC 5023 is at a projected distance of 117 kpc and a relative velocity 213 .
The most isolated dwarfs in the sample are DDO 48d, DDO 52, DDO 83, DDO 123, DDO 165 and DDO 216 (Table 3). The projected distance between DDO 52 and its nearest known neighbour, PGC 22900, is 326 kpc, and its large velocity difference suggests that PGC 22900 is an unrelated background galaxy. The NGC 2537/UGC 4278 pair is part of the present sample; this pair is relatively far from DDO 52, but at nearly the same velocity. The nearest neighbour of DDO 83 is DDO 84, at a very similar velocity but at a projected distance of 500 kpc, just as NGC 3413 and NGC 3274. DDO 123 appears to be the most isolated galaxy in the sample. The data in Table 3 suggest that DDO 123 is associated with UGC 7544 and UGC 8146, so that the nearest neighbour is a dwarf galaxy at least 800 kpc distant. Four of the ‘isolated’ objects in Table 3 are accompanied by late-type galaxies with radial velocities not differing by more than 50 . As the number density of galaxies along the velocity axis is low, it is highly unlikely that these galaxies are unrelated.
3 Observations and reduction
All observations discussed in this paper were made with the Westerbork Synthesis Radio Telescope (WSRT) between 1984 en 1991. At the observing fequency of 1.4 GHz, the primary beam is 40′ (FWHM), and the synthesized beam is sin. For a galaxy at distance , this beamsize corresponds to a linear resolution of pc. For the nearest dwarf galaxies in our sample this is approximately the size of the Orion starforming complex. The largest scales which can be studied are mostly determined by the sensitivity to low-column-density HI in the outer regions; the sensitivity of a 12 hour observation with the WSRT is about HI atoms or 0.8 . Each galaxy was observed for a full 12-hour period, resulting in a map with the first grating response at a radius of 10′. Four galaxies were observed for 2 x 12 hours; for NGC 2976 and DDO 123 the first grating response is at a radius of 20′. In general, the shortest baseline sampled was 72 m (341 wavelengths). Five galaxies were observed with a shortest spacing of 36 m (171 wavelengths) and one with a shortest spacing of 54 m. The lack of short spacings causes a depression of the map zerolevel proportional to source strength and a dilution of the interferometer response to extended structures. However, the limited overall extent of the sample galaxies, and the limited extent of emission in any particular velocity channel served to greatly minimize any interferometric dilution. Flux and phase were calibrated by using the strong radio sources 3C48, 3C147 and 3C286. Additional information in Table 4, where we list for each galaxy observation the date, the shortest spacing SP in m, the central velocity in , the total bandwidth BW in MHz, and the channel separation in . All data were Hanning-tapered, so that the velocity resolution is similar to a gaussian with a FWHM equal to .
Standard gain and phase calibrations were applied by the WSRT reduction group in Dwingeloo (cf. Bos et al. 1981). The UV data were subsequently imported into the NEWSTAR reduction package for inspection and Fourier transformation. Data points of poor quality were excluded from the analysis in all frequency channels, in order to keep identical UV-coverage for all frequency channels. In each channel, maps were constructed with resolutions of , and, for the larger objects, (FWHM) resolution. At decreasing resolutions, the circular gaussian weight functions used progressively circularize the synthesized beams, because the longer projected baselines are suppressed more strongly than the shorter projected baselines. For convenience in defining ‘clean’ areas at later reduction stages, we produced all output maps with identical pixel sizes of , fully sampling the high-resolution beam and oversampling the low-resolution beam by a factor of two. Separately produced continuum maps (see below) were sampled with and pixels respectively. For each datacube, we produced five antenna patterns distributed evenly over the whole frequency band. This was sufficient for the expected 0.18 size variation of the synthesized beam over a 2.5 MHz passband at 1420 MHz.


| Object | Object | ||||
|---|---|---|---|---|---|
| MHz | mJy | MHz | mJy | ||
| [1] | [2] | [3] | [1] | [2] | [3] |
| DDO 22 | 1.58 | 3.6 | Mk 178 | 0.81 | 21: |
| DDO 43 | 0.51 | 4.9 | NGC 3738 | 1.31 | 132 |
| DDO 46 | 0.41 | 4.3 | DDO 101 | 1.66 | - |
| DDO 47 | 1.29 | 4.3 | DDO 123 | 1.31 | 4.0 |
| DDO 48 | 1.23 | 6.8 | Mk 209 | 0.59 | 5.4 |
| NGC 2537 | 1.54 | 122 | DDO 125 | 1.60 | 10 |
| DDO 52 | 0.37 | 7.3 | DDO 133 | 0.55 | 7.1 |
| DDO 63 | 1.54 | 5.9 | DDO 165 | 0.61 | 5.7 |
| NGC 2976 | 1.17 | 655 | DDO 166 | 1.60 | 7.0 |
| DDO 64 | 0.41 | 8.8 | DDO 168 | 1.27 | 5.5 |
| DDO 68 | 0.39 | 15 | DDO 185 | 0.34 | 11 |
| DDO 73 | 1.58 | 5.2 | DDO 190 | 0.33 | 7.1 |
| DDO 83 | 1.33 | 41 | DDO 216 | 1.35 | 6.2 |
| DDO 87 | 1.56 | 7.2 | DDO 217 | 0.39 | 9.0 |
After Fourier transformation, the raw datacubes were imported into the GIPSY package and searched for line emission from the object and the Galaxy foreground. Excluding noisy channel maps at the edges of the frequency band and channels containing line emission, we fitted a first order polynomial to the remaining continuum channels. For each galaxy we took the lowest-resolution datacube, and marked in each continuum-subtracted channel map the area containing line emission. These areas were stored and used for all datacubes as input search areas for the clean algorithm. The clean areas thus manually defined were larger than those defined through clipping, and have smooth boundaries. Within the search areas, the clean algorithm searched for positive as well as negative components to a level of half the r.m.s. noise value as determined from empty channels. The components were restored onto the map with gaussian beams fitted to the antenna pattern at the center of the frequency band.


We added the line-free channels at either side of the passband to make a ‘broad band’ continuum map. These maps were made in separate runs because they must be bigger in order to allow us to ‘clean’ bright continuum (background) sources far from the map center.
4 Results
4.1 Radio continuum emission from dwarf galaxies
Although only a limited bandwidth was available in the continuum, the large collecting area of the WSRT and the long integration times allowed determination of continuum flux-densities of the sample galaxies at sensitivities of a few mJy, comparable to those of published single-dish surveys (Klein et al. 1986, Klein 1986, Altschuler et al. 1984), but unlike these unhampered by background confusion (cf. Hoeppe et al. 1994). The sensitivity of our continuum maps is determined by the effective bandwidth used, i.e on the line-free part of the original bandwidth. The effective continuum bandwidths are given in Table 5.
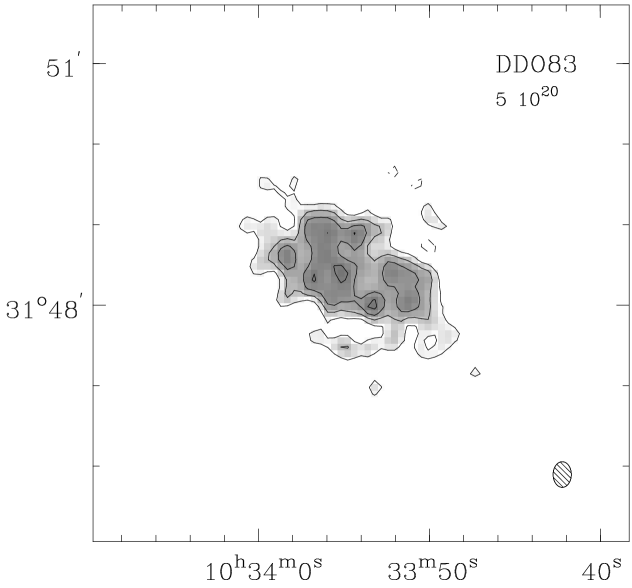
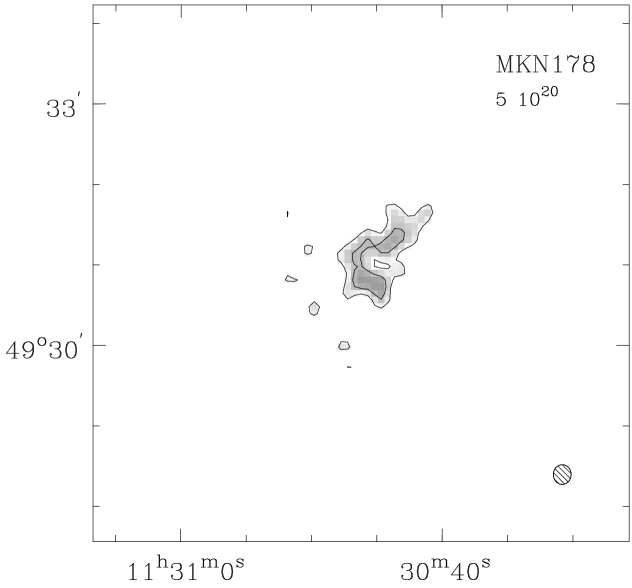
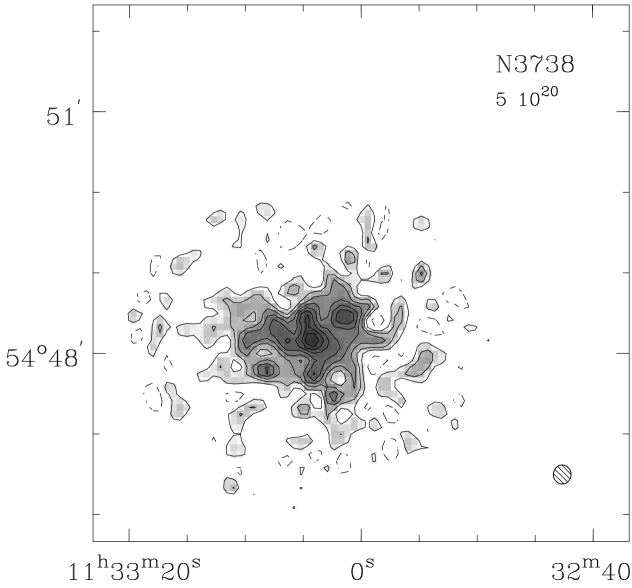
We integrated fluxes inside by boxes centered on each galaxy’s position, and on at least five map positions judged to be free of continuum emission in order to determine the local noise level. Results are listed in Table 5. Upper limits are three times the r.m.s. noise. The high upper limits for Mk 178 and DDO 68 are due to residual sidelobes of unrelated strong continuum sources in the field. For the same reason no value is listed for DDO 101. Only four out of 28 galaxies (15) were unequivocally detected in the continuum: NGC 2537, NGC 2976, NGC 3738 and DDO 83 of which maps are shown in Fig. 1. This detection rate is similar to those yielded by single dish continuum surveys. It may suffer from a positive bias because blue compact dwarf galaxies, which tend to be more luminous at radio wavelengths (Klein et al. 1984), are overrepresented in our sample.
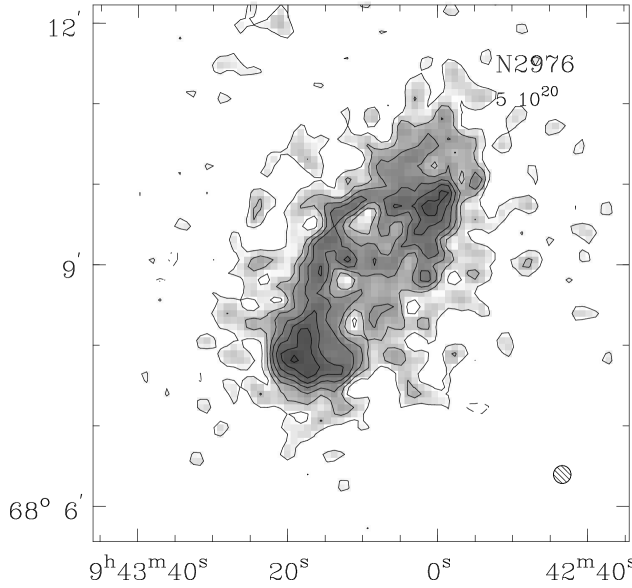
The best continuum detection (13) is that of NGC 2976. Our vale S1.4 = 64.5 mJy is consistent with Condon’s (1987) value S1.5 = 50.8 mJy. The higher frequency determination S4.85 = 295 mJy by Gregory Condon (1991) suggests an overall nonthermal spectral index = –0.8 (S). The map shows two bright compact sources, almost coincident with the two regions of highest HI column density (see below) and connected by more diffuse emission. Within a aperture, these sources have flux densities, uncorrected for underlying extended emission, of (SE: , ) and (NW: , ), where the errors reflect the uncertainty in the definition of the emitting regions. We have verified that these radio continuum sources correspond precisely with major H emission regions in the galaxy (cf. Stil 1999). Their emission is thus almost certainly thermal. The two objects then have excitation parameters 500 resp. 700 pc cm-2, corresponding to the Lyman continuum photon output of 270 resp. 400 O6 stars, i.e. to major star formation regions.
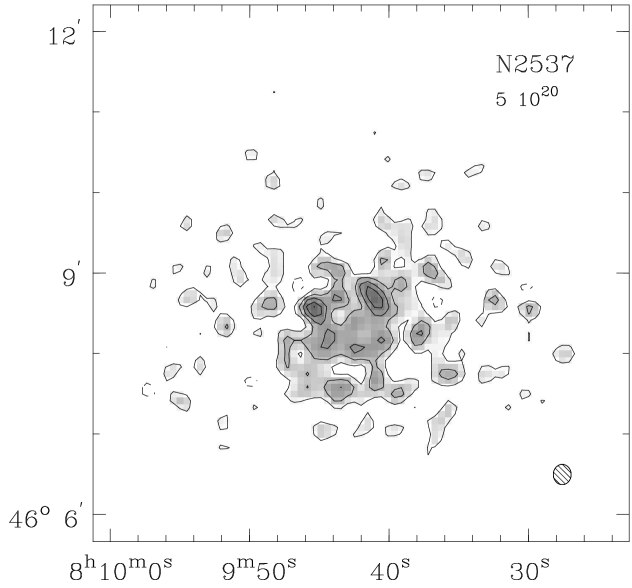
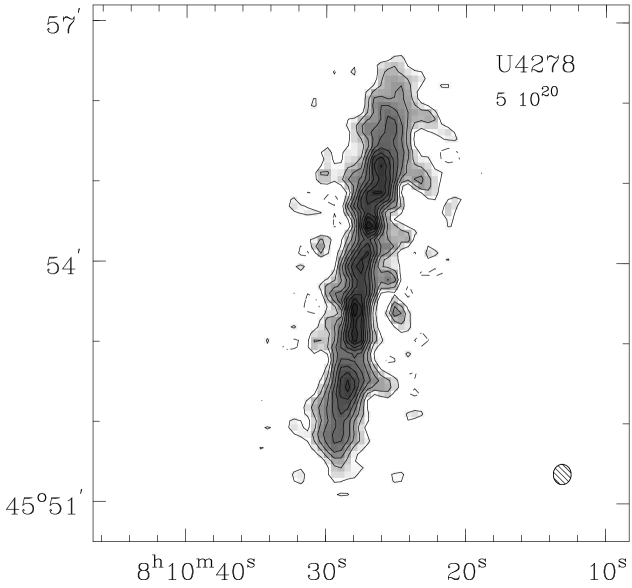
The other three detections are less strong. A just resolved source coincides with strong H emission in the main body of NGC 2537 (Stil 1999). Higher-frequency flux-densities at 6.3 cm and (Klein et al. 1984) agree well with our value in Table 5 and suggest a flat radio spectrum, i.e. optically thin thermal emission as suggested by the strong H emission. The greater distance of NGC 2537, and the observed flux-density suggest a total excitation parameter 1050 pc cm-2, corresponding to the output of some 2800 O6 stars. This suggests a major burst of star formation within the kiloparsec-sized region. It is tempting to speculate that the companion UGC 4278 bears responsibility for this.
NGC 3738 also has a somewhat extended radio continuum source coincident with the optical galaxy. No other radio continuum information is available, because of confusion with the nearby, relatively strong point source 1132+5450 (whose contribution is, of course, not included in our determination). We have searched for HI in absorption against this source but found none down to a (1 ) level of (). However, this upper limit does not provide strong constraints on the HI size of NGC 3738.
Finally, a faint and somewhat marginal source appears in the map of DDO 83. This source was accepted as a detection because it is resolved and occurs within the HI emission boundary. Optically, nothing is evident at its position. An even more marginal detection (Klein et al. 1992) is at least consistent with our result. The Effelsberg beamsize of 2.5′ was small enough to exclude confusion by other sources in the field.
4.2 Serendipitous objects

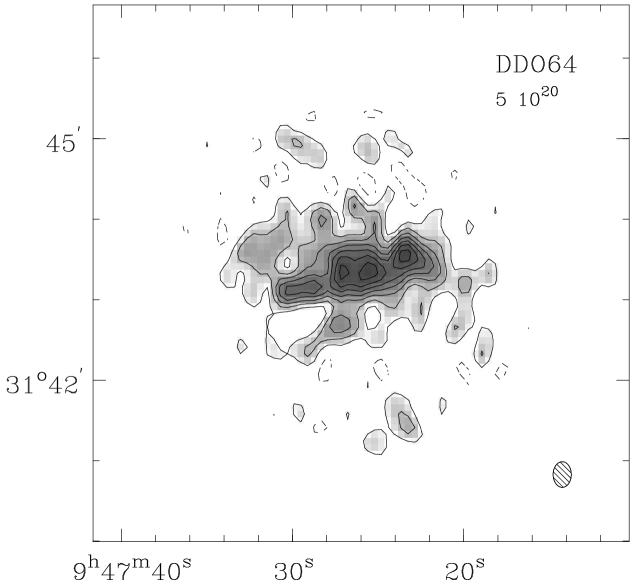
In a few cases, other galaxies are included in the same WSRT datacube as the target galaxy. This is the case for UGC 4278, companion of NGC 2537, which occurs at a large distance to the field center, causing a primary beam attenuation changing significantly over the galaxy. The other companion, NGC 2537A is not visible in the Westerbork data. Likewise, UGC 5272B is clearly visible in the DDO 64 channel maps at , in the velocity range . It can also be seen in the HI column density map of DDO 64 in Fig. 4, but there it is no stronger than the noise feature to the north of DDO 64. An HI line profile of UGC 5272B is included in Fig. 2. HI emission from DDO 166’s companion NGC 5033 is discernable only at the noiselevel; although UGC 8314 appears in the same field of view, it cannot be studied with the present data. Although additional uncatalogued dwarf galaxies may occur in the vicinity of the sample galaxies, no previously unknown objects have been found in the present survey.
4.3 Integrated HI emission
| Name | Sdv | ||||
|---|---|---|---|---|---|
| [1] | [2] | [3] | [4] | [5] | [6] |
| D 22 | 564 | 6.1 0.6 | 1.41 | 1.0 | 14 |
| D 43 | 353 | 14.5 0.8 | 0.82 | 1.4 | 19 |
| D 46 | 364 | 19.3 0.6 | 1.09 | 0.9 | 72 |
| D 47 | 274 | 64.3 1.2 | 0.61 | 1.7 | 47 |
| D 48 | 1084 | 11.7 0.9 | 6.77 | 1.2 | 23 |
| N 2537 | 443 | 18.8 0.9 | 1.82 | 0.2 | 1.0 |
| U 4278 | 558 | 44.9 2.0 | 4.33 | 0.3 | … |
| D 52 | 395 | 8.1 0.8 | 0.54 | 1.0 | 10 |
| D 63 | 139 | 39.5 1.0 | 1.08 | 0.7 | 40 |
| N 2976 | 3 | 56.5 1.2 | 1.54 | 0.1 | 0.6 |
| D 64a | 515 | 14.9 1.6 | 1.30 | 1.1 | 9.2 |
| U 5272B | 537 | 1.0 0.1 | 0.09 | … | … |
| D 68 | 500 | 26.1 1.0 | 2.29 | 2.8 | 17 |
| D 73 | 1376 | 8.5 0.7 | 6.48 | 0.9 | 11 |
| D 83 | 582 | 12.0 1.0 | 2.29 | 1.4 | 21 |
| D 87 | 340 | 18.3 0.8 | 0.50 | 2.4 | 25 |
| Mk 178 | 250 | 2.8 0.5 | 0.18 | 0.1 | 3 |
| N 3738 | 225 | 22.0 2.0 | 1.40 | 0.2 | 2.4 |
| D 101 | 498 | 1.0 0.2 | 0.12 | 0.1 | 1.5 |
| D 123 | 723 | 29.0 0.6 | 8.91 | 0.6 | 21 |
| Mk 209 | 280 | 7.0 0.7 | 0.40 | 0.5 | 3.1 |
| D 125 | 196 | 22.2 0.9 | 1.06 | 0.4 | 16 |
| D 133 | 331 | 37.0 0.8 | 2.36 | 0.9 | 38 |
| D 165 | 29 | 20.2 0.7 | 1.01 | 0.3 | 5 |
| D 166 | 961 | 11.0 1.3 | 6.64 | 0.4 | 2.8 |
| D 168 | 191 | 71.1 1.3 | 2.05 | 1.1 | 31 |
| D 185 | 136 | 25.1 1.1 | 2.82 | 1.0 | 22 |
| D 190 | 151 | 23.6 0.9 | 2.00 | 0.6 | 20 |
| D 216 | 16.3 0.5 | 0.04 | 0.2 | 13 | |
| D 217 | 433 | 81.3 1.3 | 16.56 | 1.0 | 29 |
Note : a : Flux does not include UGC 5272B.
For each object, we extracted the integrated HI line profile from its low resolution datacube which provided the best signal-to-noise ratio. In each channel map, we determined the cumulative flux as a function of concentric box area over the size range of 1 to 20 arcmin. This procedure yielded for each velocity channel an accurate flux with minimum noise contribution. It also provided a good check on possible systematic errors such as residual zero offsets left by imperfect cleaning. We found such effects to be small compared to the uncertainty in the flux calibration, except for NGC 3738 where we had to apply a relatively large flux correction factor of 1.4.
As we have already mentioned, the lack of the shortest spacings may cause us to underestimate the total flux contained in the interferometer map. In order to verify the importance of this effect, we have compared the WSRT flux-integrals just determined with flux-integrals based on single dish measurements. In Fig. 3 we have plotted the values listed in the large compilation by Bottinelli et al. (1990) as a function of the WSRT values. The errorbars do not take into account the (systematic) flux calibration uncertainty, which is about of 10. There is good agreement is good, but the WSRT fluxes tend to be lower by factors up to 1.25. However, as an anonymous referee has pointed out, the values listed by Bottinelli et al. (1990) represent a very inhomogeneous sample, incorporating corrections for assumed HI extent and corrections for telescope-deptendent HI flux scales. The magnitude of and uncertainty in these corrections may easily be comparable to the difference in integral values noted above.

The line profiles resulting from this procedure are shown in Fig. 2 From these line profiles we calculated the HI flux integral , the flux-density-weighted mean velocity and, assuming optically thin emission, the total HI mass , where is the distance in Mpc, the flux density in Jy and the width of a single channel in . is in units of solar mass. The resulting values are listed in Table 6. In that table, we have also listed the ratios of the HI mass to the blue luminosity (defined as the ratio of the absolute blue magnitudes of the galaxy and the Sun) and far-infrared luminosity (defined as respectively.
As we have already mentioned, the lack of the shortest spacings may cause us to underestimate the total flux contained in the interferometer map. In order to verify the importance of this effect, we have compared the WSRT flux-integrals just determined with flux-integrals based on single dish measurements. In Fig. 3 we have plotted the values listed in the large compilation by Bottinelli et al. (1990) as a function of the WSRT values. The errorbars do not take into account the (systematic) flux calibration uncertainty, which is about of 10. There is good agreement is good, but the WSRT fluxes tend to be lower by factors up to 1.25. However, as an anonymous referee has pointed out, the values listed by Bottinelli et al. (1990) represent a very inhomogeneous sample, incorporating corrections for assumed HI extent and corrections for telescope-deptendent HI flux scales. The magnitude of and uncertainty in these corrections may easily be comparable to the difference in integral values noted above. In an attempt to further investigate this matter, we have also compared the WSRT integrals to those listed by Tifft Huchtmeier (1990) for seven of the eight galaxies in common (excluding the relatively extended DDO 217). The single-dish integrals listed by those authors were determined with the Effelsberg 100 m and NRAO 300 ft telescopes (HPBW 9.3′ and 10′ respectively) on practically identical flux scales; no correction for extent was applied. We find that the seven WSRT integrals are on average 10 higher than the single-dish vales by Tifft Huchtmeier 1990). This suggests that at least these seven galaxies (a) are correctly represented by the WSRT maps, not suffering from missing flux problems and (b) should have overall HI sizes of order 3′ as indeed shown in Fig. 4, although the flux scale uncertainties are easily of the same magnitude.
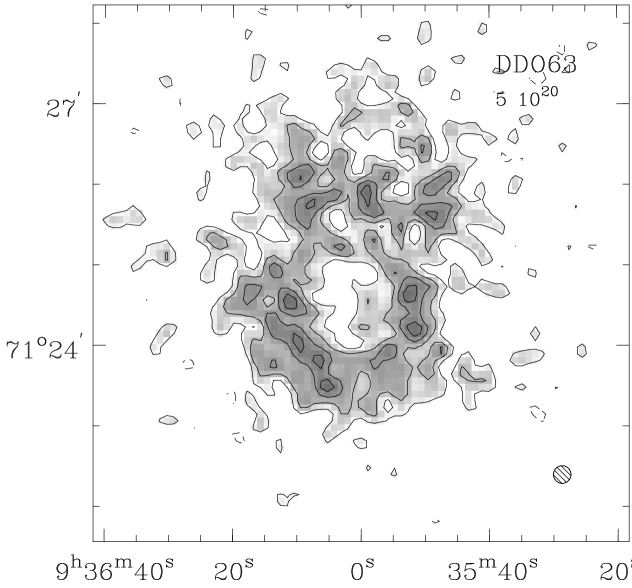
The actual shape of an HI line profile depends on both the HI gas distribution and on the HI gas kinematics. For instance, a double-peaked line profile may result from a uniform surface density disk with a flat rotation curve, but it may also be the signature of a rotating ring. Inspection of Figs. 2 and 4 shows that the HI distribution of galaxies having a double-peaked profile is indeed relatively homogeneous. In contrast, the line profiles of galaxies with a distinct central minimum (DDO 63, DDO 125, DDO 165, Mk 178) are all single-peaked. Galaxies with a double peaked profile are on average more luminous, but the low luminosity objects DDO 52 and DDO 87 () also have a double-peaked line profile. These objects have nearly flat rotation curves at the outermost measured point, as we will show later.
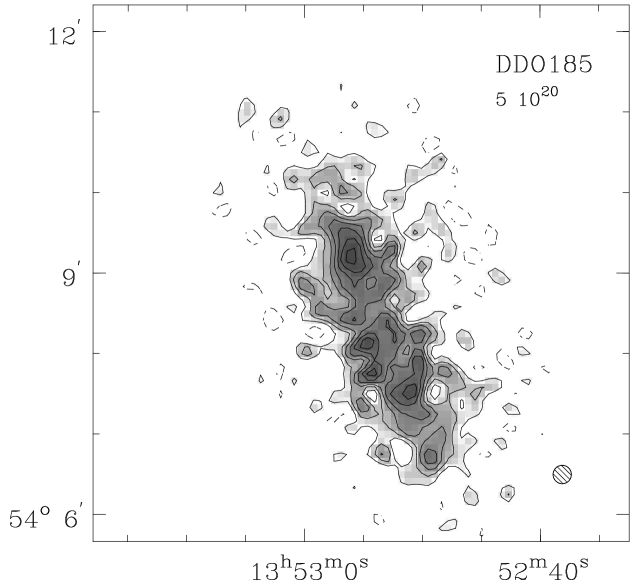
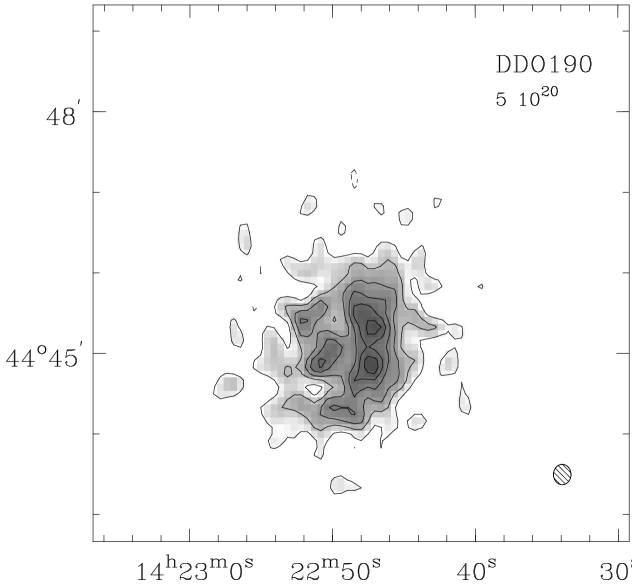
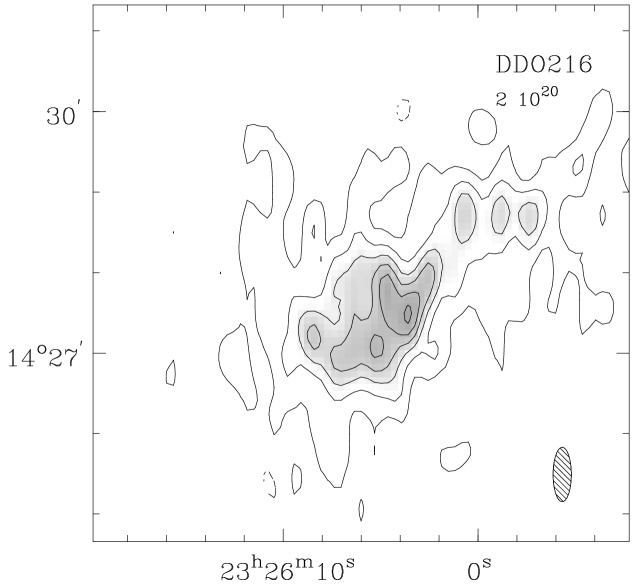
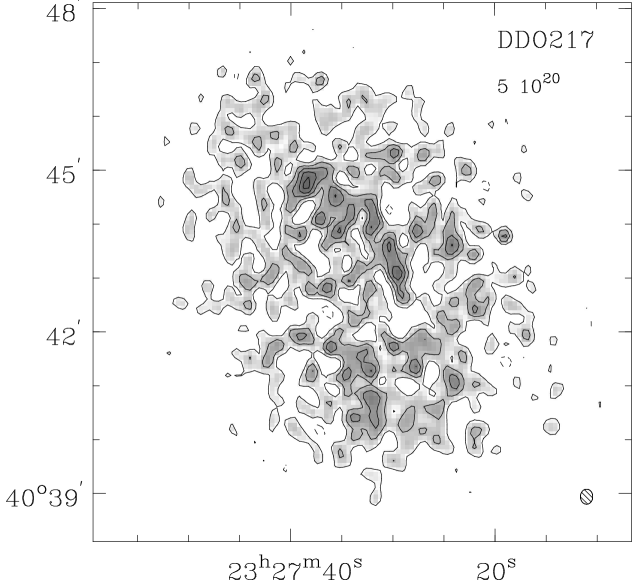
4.4 HI distribution in dwarf galaxies
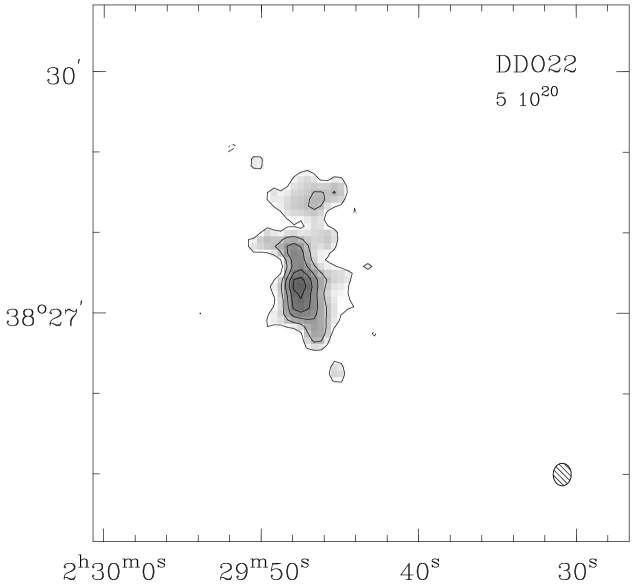
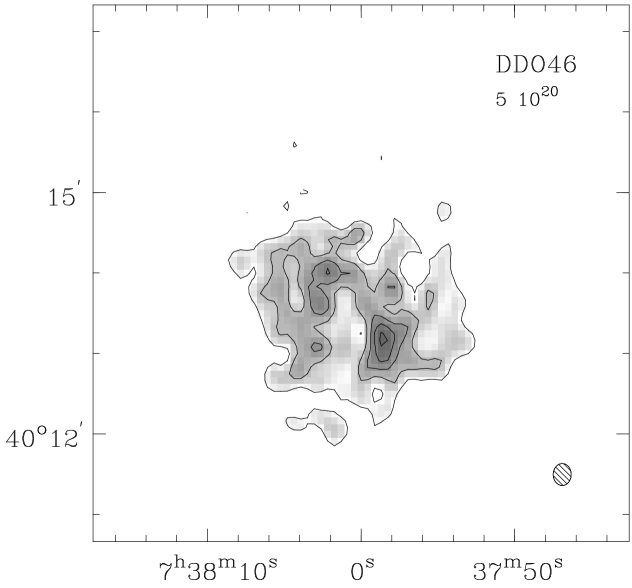
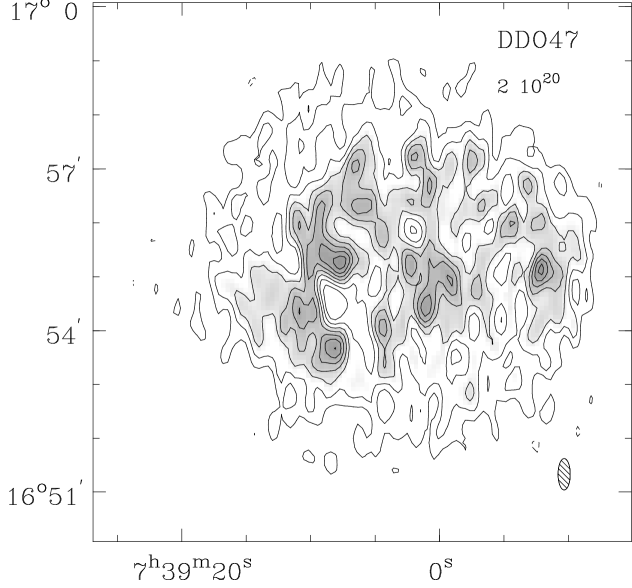
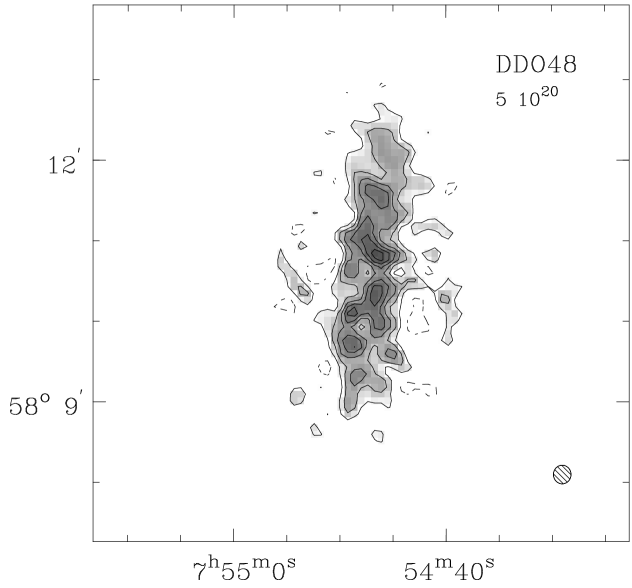
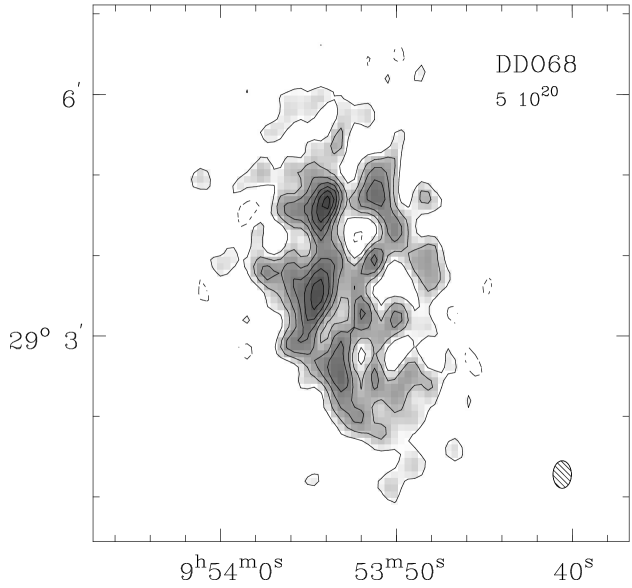
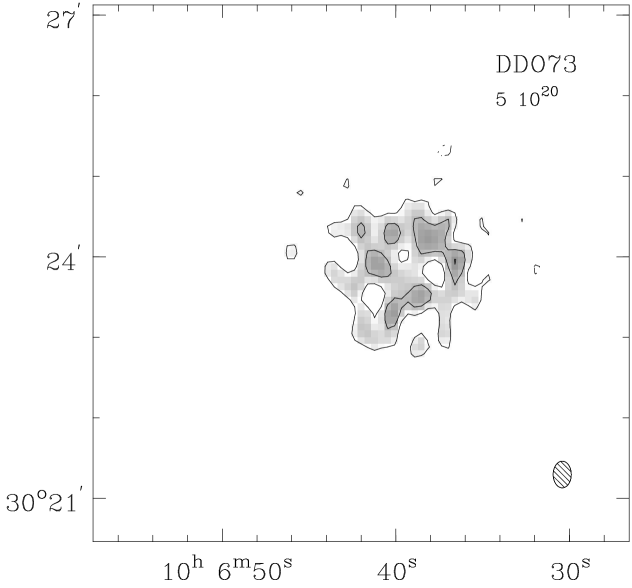
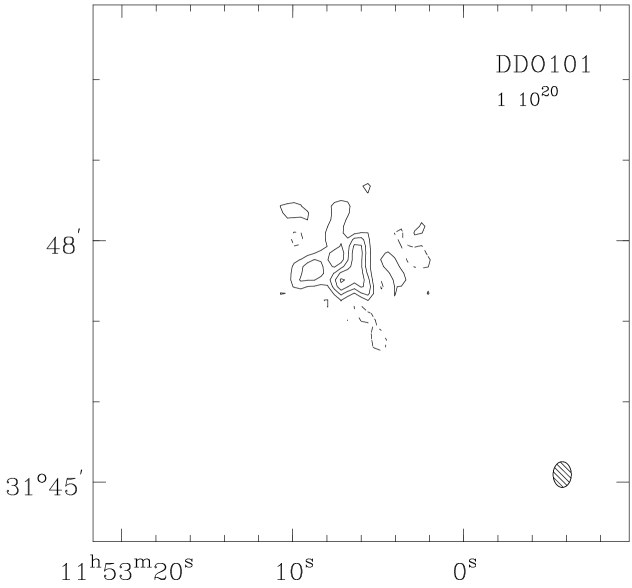
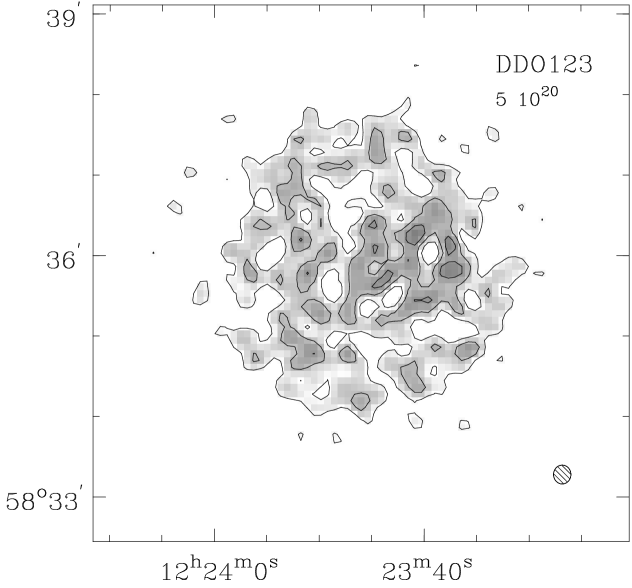
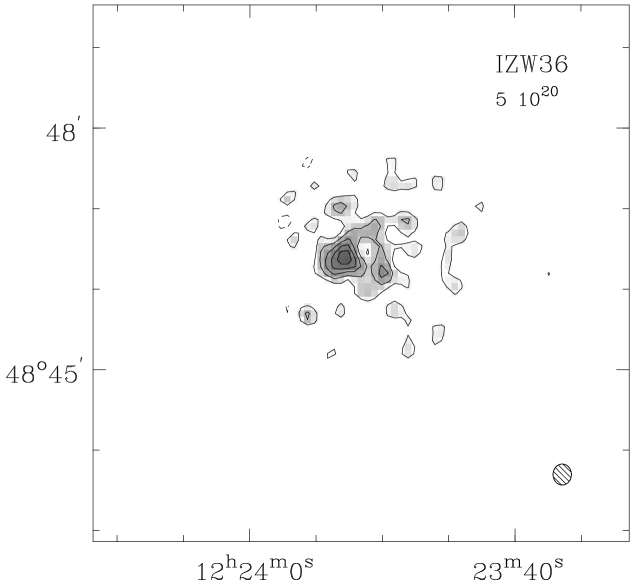
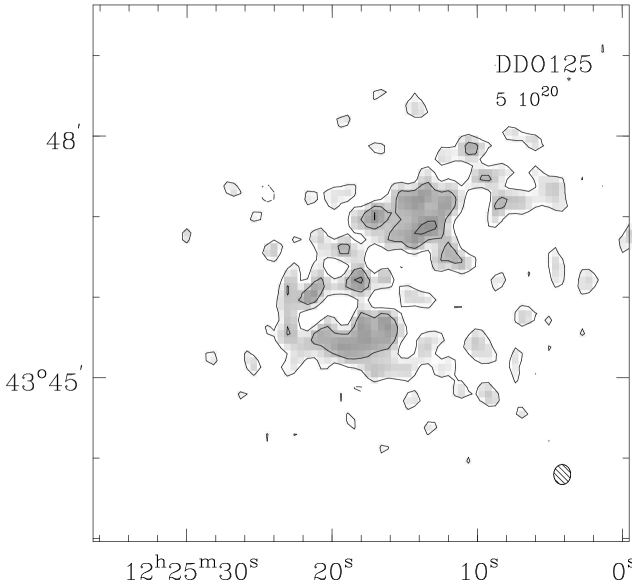
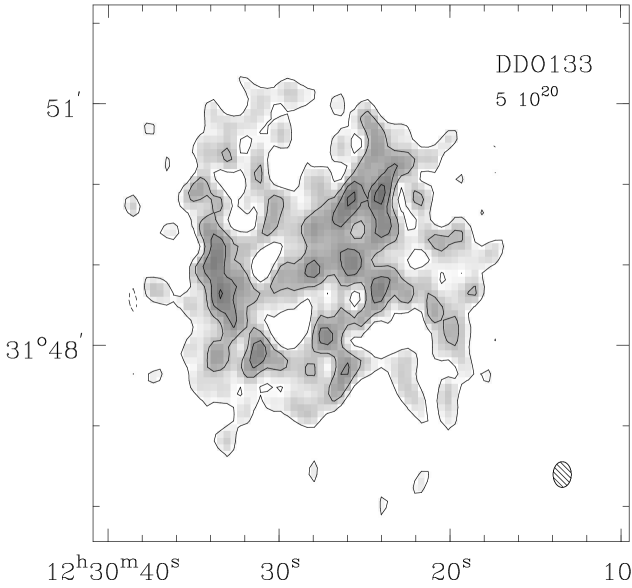
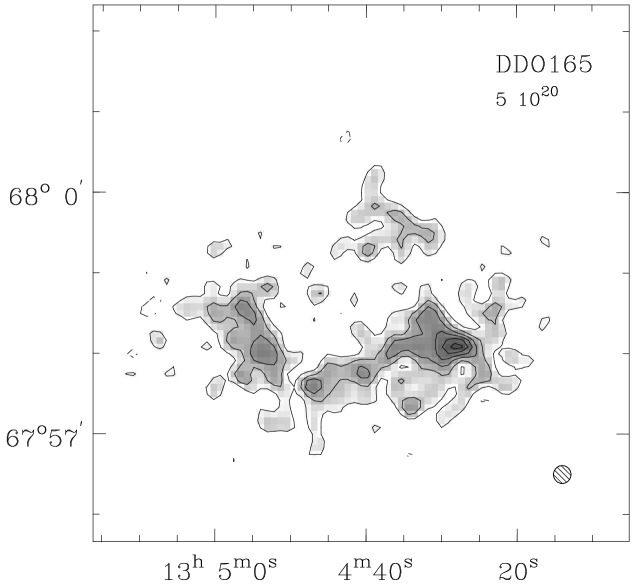
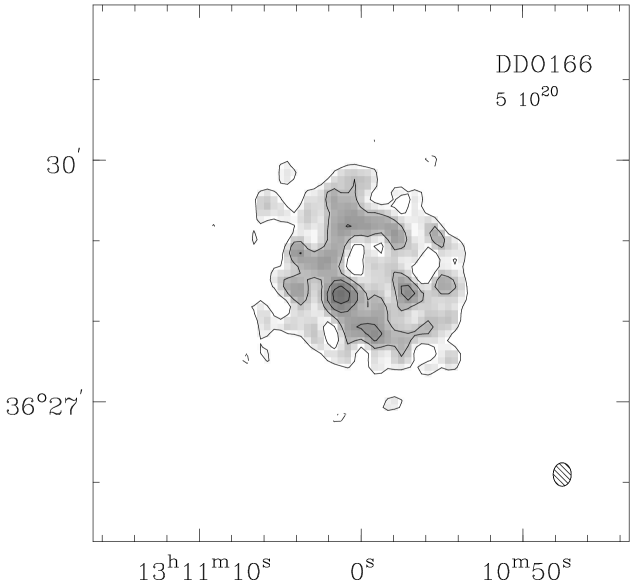
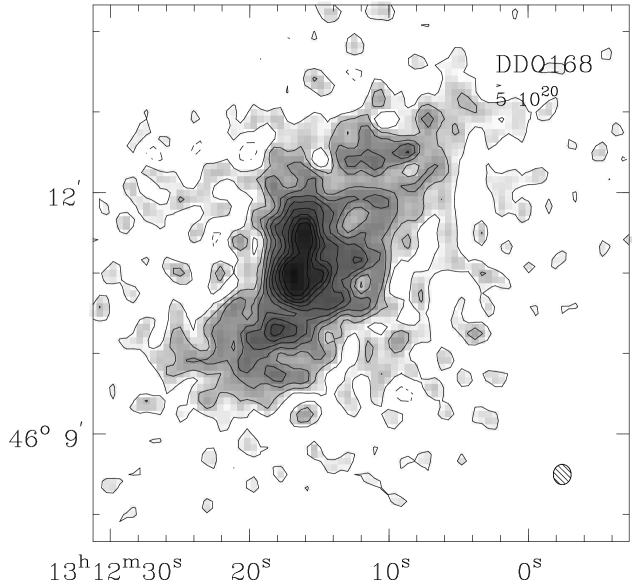
We have produced maps of the HI distribution of the sample galaxies by summation of the individual cleaned channel maps. In order to minimize noise contributions of emission-free positions, we took from each channel map only the region contained within the cleaning mask. As a consequence, the remaining noise is now a function of position in the map. Assuming optically thin emission, we have converted HI line intensities into HI column densities (H atoms per ), by using:
where is in mJy, is in , and and are the FWHM beamsizes (in arcsec) in right ascension and declination respectively.
In comparing HI column density maps, one should take into account the linear resolution of the maps. For example, the small DDO 43 is, in fact, approximately the same linear size as the larger DDO 47. The size of condensations at a particular column density level relative to the overall HI distribution is a useful parameter in comparisons of HI column density maps, because it is relatively insensitive to the linear resolution. The greyscales in Fig. 4 are the same for all objects in order to facilitate such comparisons.
The sample dwarf galaxies can be divided broadly into three classes based on the appearance of the high-column-density HI distribution.
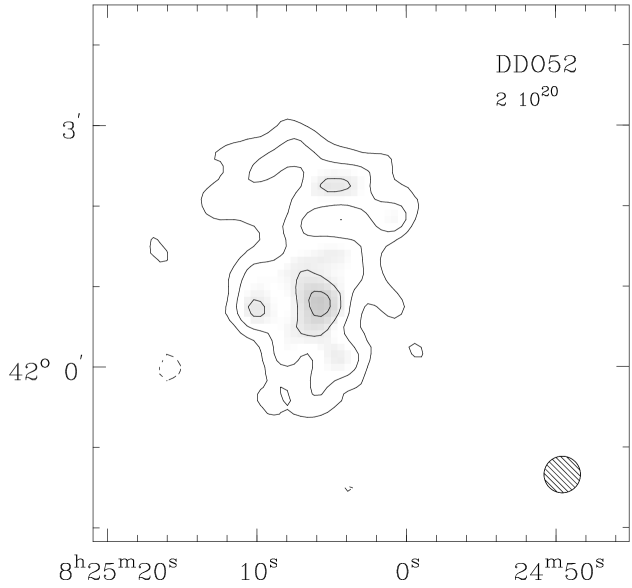
A. Relatively small high-column-density regions are distributed throughout the HI disk. Typical sizes are smaller than 100 pc. The average HI column density is low, and very high HI column density regions () do not occur. On the whole, these objects are rather featureless. The morphology resembles the HI distribution in Sc galaxies. DDO 43, DDO 47, DDO 52, DDO 73, DDO 87, DDO 123, DDO 133 and DDO 217 all belong to this class.
B. A high-column-density region () in the shape of a (sometimes broken) ring is present, comparable in size to the HI disk. The central parts of the galaxy have relatively low column densities. Objects in this class are DDO 46, NGC 2537, DDO 63, NGC 2976, DDO 68, DDO 83, Mk 178, DDO 125, DDO 165 and DDO 166.
C. The structure is dominated by a single prominent complex of very high column density (). Galaxies in this class are NGC 3738, Mk209, DDO 168 and DDO 190.
Some sample galaxies are left unassigned to a class, mainly because they appear to be viewed edge-on: DDO 22 (class B?), DDO 48 (class A?), UGC 4278, DDO 64 (class C?) and DDO 185. DDO 101 is too small. DDO 216 is hard to assign, but may be closest to class B.
DDO 47 is the only object in the sample with some evidence of spiral structure in the HI. Two arms appear on either side of the HI disk in position angle (see also Puche & Westpfahl 1993).
References
- Altschuler et al. (1984) Altschuler D.R., Giovanelli R., Haynes M.P., Giovanardi C., 1984, AJ 89, 224
- Bajaja (1994) Bajaja E., Huchtmeier H.K., Klein U., 1994, A&A 285, 385
- Bos et al. (1981) Bos A., Raimond E., van Someren Greve H.W., 1981, A&A 98, 251
- Bottinelli et al. (1990) Bottinelli L., Gouguenheim L., Fouqué P., Paturel G., 1990, A&AS 82, 391
- Condon (1987) Condon, J.J., 1987, ApJS 65, 485
- (6) Fisher J.R., Tully B.R., 1975, A&A 44, 151
- (7) Fisher J.R., Tully B.R., 1981, ApJS 47, 139
- Garcia (1993) Garcia, A.M., 1993, A&AS 100, 47
- (9) Gregory P.C., Condon J.J., 1991 ApJS 75, 1011
- Hoeppe et al. (1994) Hoeppe G., Brinks E., Klein U., et al. 1994, AJ 108, 446
- (11) Hoffman G.L., Helou G., Salpeter E.E., Glosson J., Sandage A., 1987, ApJS 63, 246
- Hopp & Schulte-Ladbeck (1991) Hopp U. Schulte-Ladbeck R.E., 1991, A&A 248, 1
- (13) Israel F.P., 1988, A&A 194, 24
- Karachentsev & Tikhonov (1994) Karachentsev I.D. Tikhonov N.A., 1994, A&A 286, 718
- Klein et al. (1984) Klein U., Wielebinski R., Thuan T.X., 1984, A&A 141, 241
- Klein et al. (1986) Klein U., Gräve R., 1986, A&A 161, 155
- Klein (1986) Klein U., 1986 A&A 168, 65
- Klein et al. (1992) Klein U., Giovanardi C., Altschuler D.R., Wunderlich E., 1992, A&A 255, 49
- Kraan-Korteweg et al. (1988) Kraan-Korteweg R.C., Cameron L.M., Tammann G.A., 1988, ApJ 331, 620
- (20) Lo K.Y., Sargent W.L.W., Young K., 1993 AJ 106, 507
- Lynden-Bell (1994) Lynden-Bell D., 1994, in ‘The Formation and Evolution of Galaxies’, V Canary Islands Winter School of Astrophysics Eds C. Muñoz-Tuñón & F. Sánchez
- Melisse and Israel (1994) Melisse J.P.M. Israel F.P., 1994, A&AS 103, 391
- Puche & Westpfahl (1993) Puche D., Westpfahl D., 1993, in ESO/OHP workshop ‘DWARF GALAXIES’, eds. Meylan G. & Prugniel P., p. 273
- Roberts & Haynes (1994) Roberts M.S. Haynes M.P., 1994, ARAA 32, 115
- Rowan-Robinson (1988) Rowan-Robinson M., 1988, SpScR 48, 1
- Rozanski & Rowan-Robinson (1994) Rozanski, R. Rowan-Robinson M., 1994, MNRAS 271, 530
- Salpeter & Hoffman (1996) Salpeter E.E. Hoffman G.L., 1996, ApJ 465, 595
- (28) Stil J.M., 1999, Ph.D. Thesis Leiden University
- (29) Taylor C.R., Brinks E., Grashuis R.M., Skillman E.D., 1995, ApJS 99, 247
- (30) Thuan T.X., Seitzer P.O, 1979 ApJ 231, 327
- (31) Thuan T.X., Martin G.E., 1981 ApJ 247, 823
- (32) Tifft W.G., Huchtmeier W.K., A&AS 84, 47
- de Vaucouleurs et al. (1983) de Vaucouleurs G., de Vaucouleurs A., Buta R., 1983, AJ 88, 764
- de Vaucouleurs et al. (1991) de Vaucouleurs G., de Vaucouleurs A., Corwin H.G. et al., ‘Third Reference Catalogue of Bright Galaxies’, 1991, Springer Verlag, N.Y.
- (35) Walter F., Brinks E., 2001, AJ 121, 3026